Stansbury Park: Fire Incidents, Utah (UT)
Where are fire incidents reported in Stansbury Park, UT
Something went wrong! Please refresh the page.
|
| |||||||||||||||||||||||||||||||||||||||||||||||||||||||||||||||||||||||||||||||||||||||||||||||||||||||||||||
2002 - 2018 National Fire Incident Reporting System (NFIRS) incidents
- Incident types reported to NFIRS in Stansbury Park, UT
- 1,10457.1%Rescue & EMS
- 29615.3%Good Intent Call
- 1789.2%Fire
- 1558.0%Hazardous Condition
- 1226.3%False Alarm
- 713.7%Service Call
- 50.3%Special Incident
- 30.2%Overpressure Rupture
- Fire incident types reported to NFIRS in Stansbury Park, UT
- 8547.8%Outside Fires
- 5430.3%Structure Fires
- 2715.2%Mobile Property/Vehicle Fires
- 126.7%Other
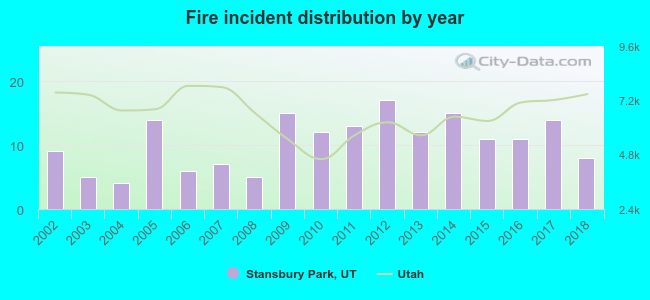 Based on the data from the years 2002 - 2018 the average number of fire incidents per year is 10. The highest number of fire incidents - 17 took place in 2012, and the least - 4 in 2004. The data has a decreasing trend.
The average number of yearly fire incidents per 10k residents in Stansbury Park, UT compared to nearest cities:
(Note: Based on data for the last 3 years, including only cities with population 5,000 and above)
| Stansbury Park: | 21.4 |
| Tooele: | 2.4 |
| Grantsville: | 6.4 |
| Magna: | 32.1 |
| Kearns: | 20.0 |
| West Valley City: | 29.0 |
| Herriman: | 16.2 |
| West Jordan: | 11.0 |
| Taylorsville: | 20.8 |

 28.1% incidents where reported in the morning and 71.9% in the evening. The most fires (20.2%) took place on Tuesday, and the least (10.7%) on Wednesday.
 Based on the 178 reports from years 2002 - 2018 most fires (17.4%) took place during July, and the least (2.2%) in January.
 Out of all 1,935 cases reported during the years 2002 - 2018, the most belonged to the categories: Rescue & EMS (57.1%), Good Intent Call (15.3%), and Fire (9.2%).
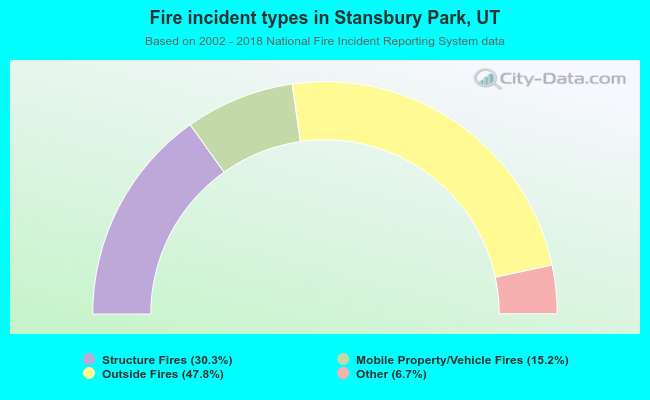 When looking into fire subcategories, the most reports belonged to: Outside Fires (47.8%), and Structure Fires (30.3%).