Suffern: Fire Incidents, New York (NY)
Where are fire incidents reported in Suffern, NY
Something went wrong! Please refresh the page.
|
| |||||||||||||||||||||||||||||||||||||||||||||||||||||||||||||||||||||||||||||||||||||||||||||||||||||||||||||
2002 - 2018 National Fire Incident Reporting System (NFIRS) incidents
- Incident types reported to NFIRS in Suffern, NY
- 86328.8%Fire
- 80526.9%Hazardous Condition
- 67922.7%False Alarm
- 41914.0%Good Intent Call
- 1675.6%Service Call
- 501.7%Rescue & EMS
- 90.3%Severe Weather
- 40.1%Overpressure Rupture
- Fire incident types reported to NFIRS in Suffern, NY
- 60870.5%Structure Fires
- 16519.1%Outside Fires
- 495.7%Mobile Property/Vehicle Fires
- 414.8%Other
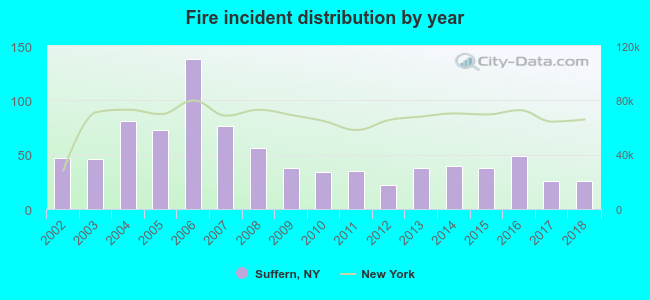 Based on the data from the years 2002 - 2018 the average number of fires per year is 51. The highest number of fire incidents - 138 took place in 2006, and the least - 22 in 2012. The data has a declining trend.
The average number of yearly fire incidents per 10k residents in Suffern, NY compared to nearest cities:
(Note: Based on data for the last 3 years, including only cities with population 5,000 and above)
| Suffern: | 30.6 |
| Airmont: | 33.4 |
| Viola: | 23.8 |
| Kaser: | 16.0 |
| Monsey: | 31.5 |
| Wesley Hills: | 31.0 |
| Spring Valley: | 13.7 |
| Chestnut Ridge: | 18.8 |
| New Hempstead: | 30.8 |
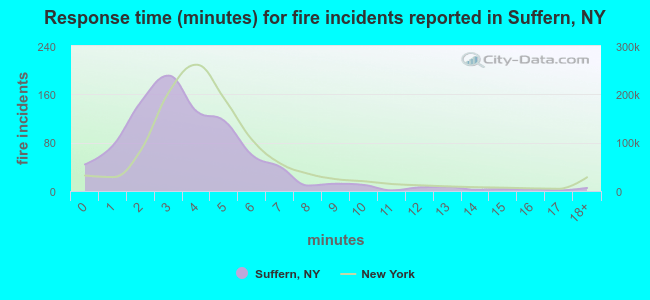 The median response time based on all reported fire incidents is 3 minutes. This is lower than the New York median value.
The median response time in Suffern, NY compared to nearest cities:
(Note: Based on data for all years, including only cities with at least 500 fire incidents)
| Suffern: | 3 minutes |
| Airmont: | 4 minutes |
| Ramsey: | 7 minutes |
| Monsey: | 0 minutes |
| Spring Valley: | 5 minutes |
| Ringwood: | 3 minutes |
| Nanuet: | 5 minutes |
| Pomona: | 5 minutes |
| Oakland: | 5 minutes |
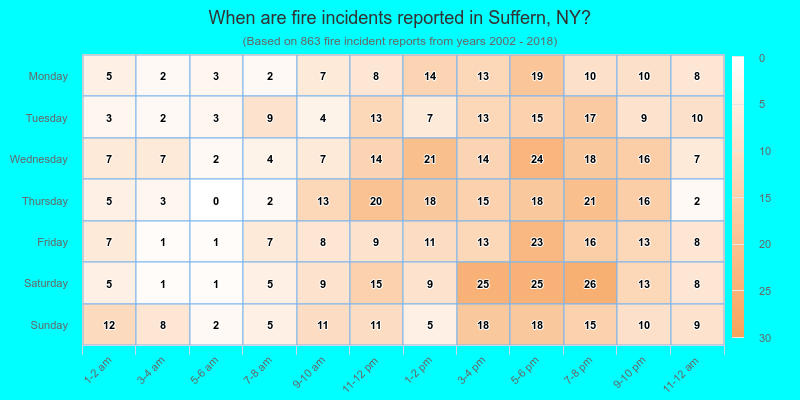
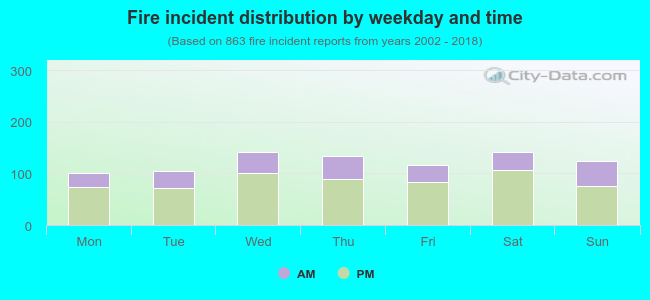 30.5% incidents where reported in the morning and 69.5% in the evening. The most fires (16.5%) took place on Saturday, and the least (11.7%) on Monday.
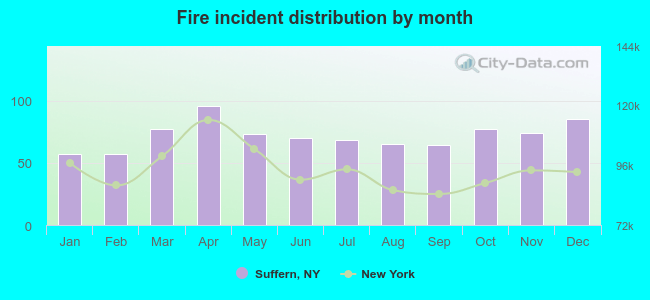 Based on the 863 incident reports from years 2002 - 2018 most fires (11.1%) took place during April, and the least (6.6%) in January.
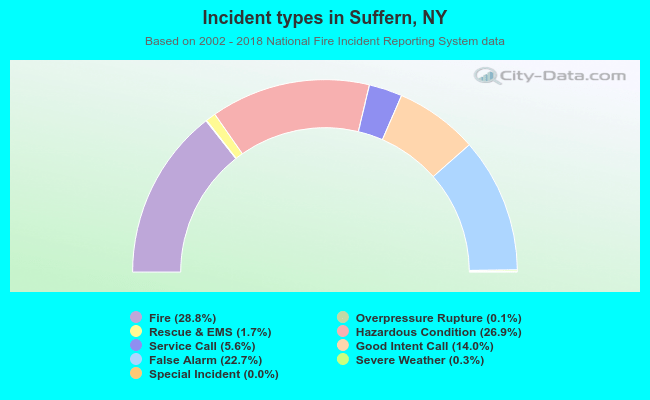 Out of all 2,997 cases reported during the years 2002 - 2018, the most belonged to the categories: Fire (28.8%), Hazardous Condition (26.9%), and False Alarm (22.7%).
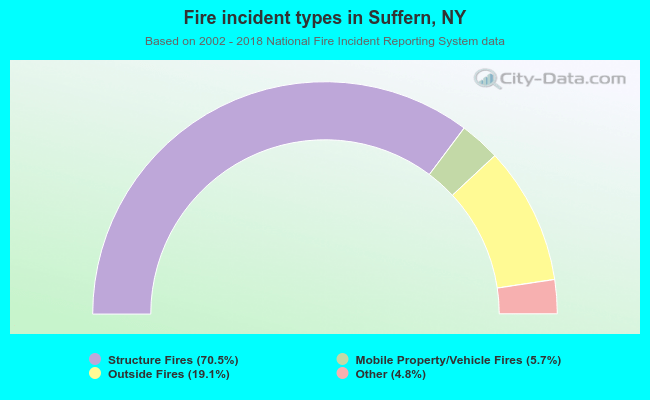 When looking into fire subcategories, the most reports belonged to: Structure Fires (70.5%), and Outside Fires (19.1%).