Sullivan: Fire Incidents, Indiana (IN)
Where are fire incidents reported in Sullivan, IN
Something went wrong! Please refresh the page.
|
| |||||||||||||||||||||||||||||||||||||||||||||||||||||||||||||||||||||||||||||||||||||||||||||||||||||||||||||
| Other | 143 | |||||||||||||||||||||||||||||||||||||||||||||||||||||||||||||||||||||||||||||||||||||||||||||||||||||||||||||
2003 - 2015 National Fire Incident Reporting System (NFIRS) incidents
- Incident types reported to NFIRS in Sullivan, IN
- 76762.5%Fire
- 27322.2%Rescue & EMS
- 12510.2%Hazardous Condition
- 221.8%Service Call
- 211.7%False Alarm
- 121.0%Good Intent Call
- 50.4%Special Incident
- 20.2%Severe Weather
- Fire incident types reported to NFIRS in Sullivan, IN
- 27636.0%Outside Fires
- 25232.9%Structure Fires
- 15219.8%Other
- 8711.3%Mobile Property/Vehicle Fires
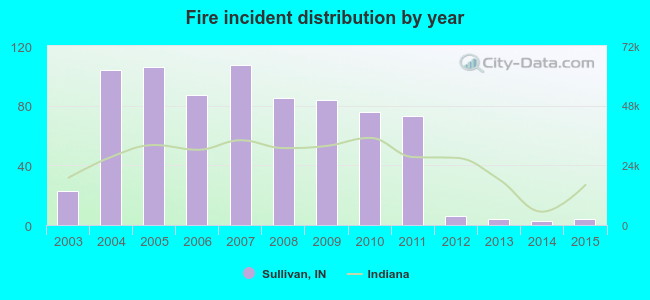 Based on the data from the years 2003 - 2015 the average number of fires per year is 59. The highest number of fire incidents - 107 took place in 2007, and the least - 3 in 2014. The data has a dropping trend.
 The median response time based on all reported fire incidents is 4 minutes. This is lower than the Indiana median value.
The median response time in Sullivan, IN compared to nearest cities:
(Note: Based on data for all years, including only cities with at least 500 fire incidents)
| Sullivan: | 4 minutes |
| Linton: | 5 minutes |
| Robinson: | 7 minutes |
| West Terre Haute: | 5 minutes |
| Bloomfield: | 10 minutes |
| Marshall: | 9 minutes |
| Terre Haute: | 6 minutes |
| Vincennes: | 3 minutes |
| Lawrenceville: | 10 minutes |
 26.9% incidents where reported in the morning and 73.1% in the evening. The most fires (16.4%) took place on Friday, and the least (12.9%) on Wednesday.
 Based on the 767 incident reports from years 2003 - 2015 most fires (11.6%) took place during March, and the least (6.1%) in August.
 Out of all 1,227 cases reported during the years 2003 - 2015, the most belonged to the categories: Fire (62.5%), Overpressure Rupture (22.2%), and Rescue & EMS (10.2%).
 When looking into fire subcategories, the most reports belonged to: Outside Fires (36.0%), and Structure Fires (32.9%).