Vincennes: Fire Incidents, Indiana (IN)
Where are fire incidents reported in Vincennes, IN
Something went wrong! Please refresh the page.
| Fire incidents reported | |
|---|---|
| Sreet name | Count |
| HART ST | 180 |
| 15TH ST | 130 |
| 2ND ST | 108 |
| MAIN ST | 108 |
| 6TH ST | 104 |
| 16TH ST | 78 |
| WASHINGTON AVE | 78 |
| MINNEAPOLIS AVE | 66 |
| FELT KING RD | 62 |
| BROADWAY ST | 60 |
| COLLEGE AVE | 50 |
| NICHOLAS ST | 50 |
| WILLOW ST | 50 |
| 4TH ST | 44 |
| NEW ALBANY AVE | 44 |
| OLD HWY 41 | 40 |
| 10TH ST | 38 |
| 3RD ST | 38 |
| HILLCREST RD | 38 |
| 14TH ST | 36 |
| 15TH | 36 |
| 1ST ST | 36 |
| OLD WHEATLAND RD | 36 |
| 6TH. ST | 34 |
| LOCUST ST | 34 |
| MONTGOMERY AVE | 34 |
| OLD DECKER RD | 34 |
| 6TH STREET RD | 32 |
| 7TH ST | 32 |
| 13TH ST | 30 |
| Other | 623 |
2002 - 2018 National Fire Incident Reporting System (NFIRS) incidents
- Incident types reported to NFIRS in Vincennes, IN
- 3,55939.6%Rescue & EMS
- 2,36326.3%Fire
- 98911.0%Hazardous Condition
- 8699.7%Good Intent Call
- 6947.7%Service Call
- 4244.7%False Alarm
- 500.6%Special Incident
- 250.3%Overpressure Rupture
- Fire incident types reported to NFIRS in Vincennes, IN
- 1,08746.0%Outside Fires
- 68228.9%Structure Fires
- 32613.8%Mobile Property/Vehicle Fires
- 26811.3%Other
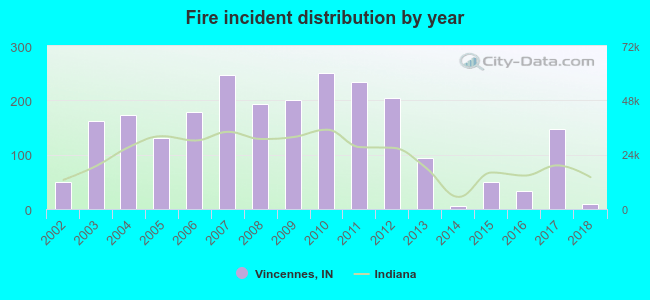 Based on the data from the years 2002 - 2018 the average number of fires per year is 139. The highest number of fires - 251 took place in 2010, and the least - 5 in 2014. The data has a dropping trend.
The average number of yearly fire incidents per 10k residents in Vincennes, IN compared to nearest cities:
(Note: Based on data for the last 3 years, including only cities with population 5,000 and above)
| Vincennes: | 35.5 |
| Washington: | 48.3 |
| Princeton: | 8.7 |
| Linton: | 11.3 |
| Jasper: | 16.7 |
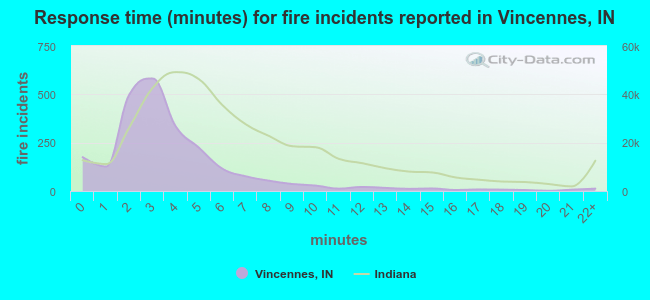 The median response time based on all reported fire incidents is 3 minutes. This is much lower compared to the Indiana median value.
The median response time in Vincennes, IN compared to nearest cities:
(Note: Based on data for all years, including only cities with at least 500 fire incidents)
| Vincennes: | 3 minutes |
| Lawrenceville: | 10 minutes |
| Petersburg: | 10 minutes |
| Washington: | 4 minutes |
| Princeton: | 4 minutes |
| Oakland City: | 5 minutes |
| Robinson: | 7 minutes |
| Sullivan: | 4 minutes |
| Olney: | 5 minutes |
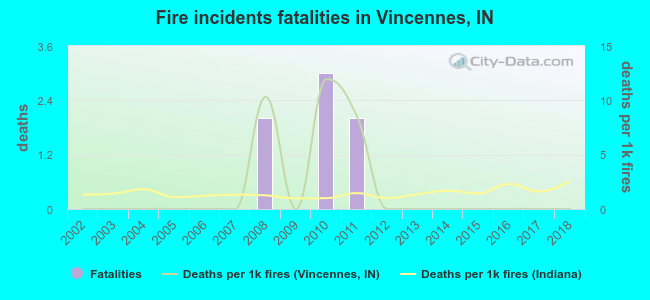 Based on the reports from the years 2002 - 2018 the average number of fire-related fatalities per year is 0. The highest number of deaths - 3 took place in 2010, and the lowest - 0 in 2002. The data has a constant trend.
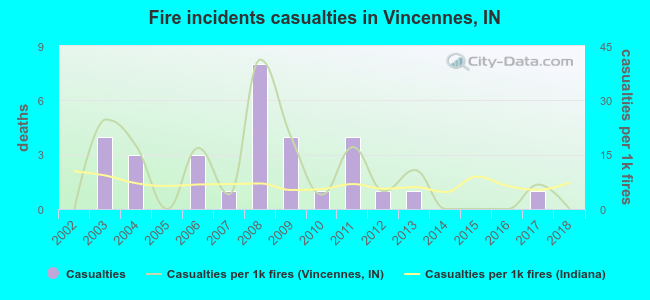 Based on the reports from the years 2002 - 2018 the average number of fire-related casualties per year is 2. The highest number of reported casualties - 8 took place in 2008, and the lowest - 0 in 2002. The data has a constant trend.
The average number of casualties per 1,000 fires is 10. This indicator was the highest - 41 in 2008, and the lowest 0 in 2002. The trend for injuries per 1,000 incidents is constant. Compared to the state value the number of injuries per 1,000 incidents is higher.
Based on the reports from the years 2002 - 2018 the average number of fire-related casualties per year is 2. The highest number of reported casualties - 8 took place in 2008, and the lowest - 0 in 2002. The data has a constant trend.
The average number of casualties per 1,000 fires is 10. This indicator was the highest - 41 in 2008, and the lowest 0 in 2002. The trend for injuries per 1,000 incidents is constant. Compared to the state value the number of injuries per 1,000 incidents is higher.Casualties per 1,000 incidents in Vincennes, IN compared to nearest cities:
(Note: Based on data for all years, including only cities with at least 500 fire incidents)
| Vincennes: | 13.1 |
| Lawrenceville: | 2.2 |
| Petersburg: | 5.3 |
| Washington: | 10.5 |
| Princeton: | 15.7 |
| Oakland City: | 0.0 |
| Robinson: | 10.7 |
| Sullivan: | 0.0 |
| Olney: | 27.3 |
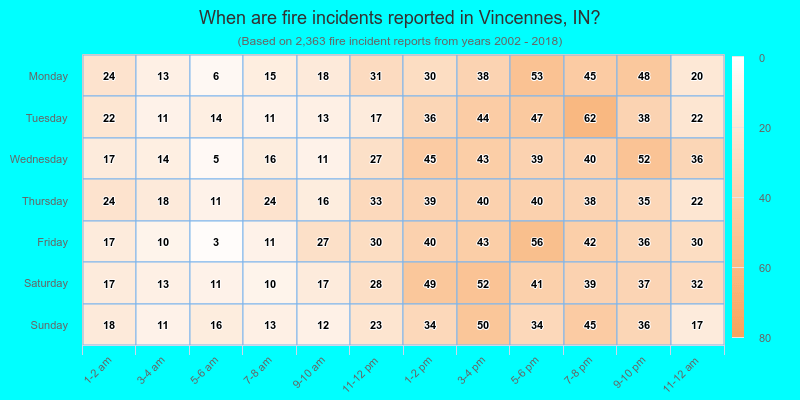
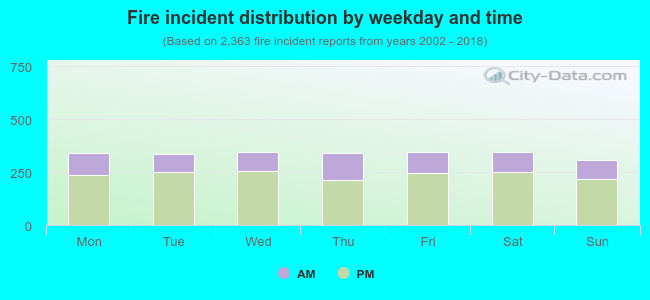 29.5% incidents where reported in the morning and 70.5% in the evening. The most fires (14.6%) took place on Saturday, and the least (13.1%) on Sunday.
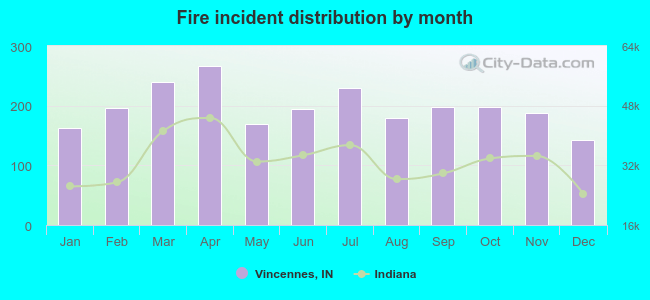 Based on the 2,363 fires from years 2002 - 2018 most fires (11.3%) took place during April, and the least (6.0%) in December.
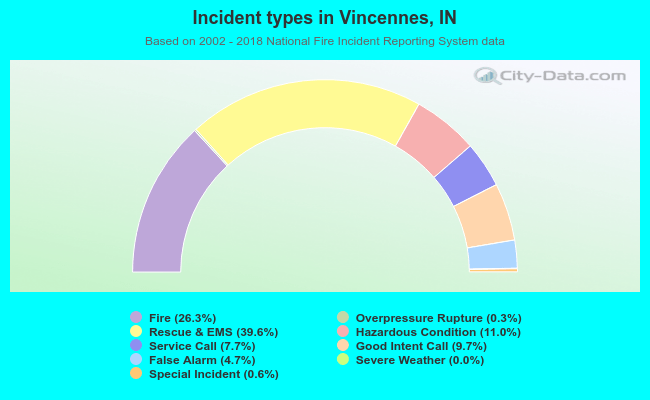 Out of all 8,977 cases reported during the years 2002 - 2018, the most belonged to the categories: Rescue & EMS (39.6%), Fire (26.3%), and Hazardous Condition (11.0%).
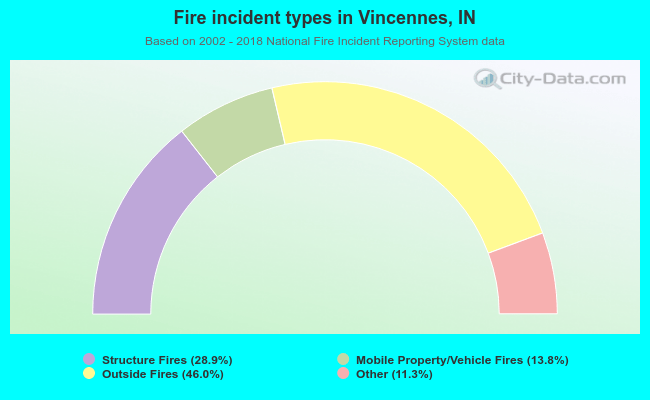 When looking into fire subcategories, the most incidents belonged to: Outside Fires (46.0%), and Structure Fires (28.9%).