Swansea: Fire Incidents, Illinois (IL)
Where are fire incidents reported in Swansea, IL
Something went wrong! Please refresh the page.
| Fire incidents reported | |
|---|---|
| Sreet name | Count |
| ILLINOIS ST | 142 |
| CASEYVILLE AVE | 40 |
| 2ND ST | 32 |
| GILBERT ST | 32 |
| JAMESTOWN RD | 30 |
| KINSELLA AVE | 24 |
| BELT | 22 |
| DUNCAN AVE | 20 |
| ROGER AVE | 18 |
| CASTELLANO DR | 16 |
| MORGAN ST | 16 |
| GRIMMIG RD | 14 |
| OWL CREEK LA | 14 |
| BARBARY WAY | 12 |
| LEIGHIGH DR | 12 |
| OLD CASEYVILLE RD | 12 |
| WEST BLVD | 12 |
| WOODRIDGE DR | 12 |
| 15TH ST | 10 |
| 16TH ST | 10 |
| 17 TH ST | 10 |
| BOBBIE DR | 10 |
| BRACKETT ST | 10 |
| GREEN HAVEN DR | 10 |
| LLEWELLYN RD | 10 |
| MARY JO DR | 10 |
| OLD COLLINSVILLE RD | 10 |
| PAPILLON | 10 |
| PHILECIA DR | 10 |
| SMELTING WORKS RD | 10 |
| Other | 182 |
2002 - 2018 National Fire Incident Reporting System (NFIRS) incidents
- Incident types reported to NFIRS in Swansea, IL
- 78228.9%Fire
- 70426.1%Hazardous Condition
- 58021.5%False Alarm
- 29711.0%Good Intent Call
- 1826.7%Rescue & EMS
- 1284.7%Service Call
- 240.9%Severe Weather
- 30.1%Overpressure Rupture
- Fire incident types reported to NFIRS in Swansea, IL
- 44056.3%Structure Fires
- 24631.5%Outside Fires
- 7810.0%Mobile Property/Vehicle Fires
- 182.3%Other
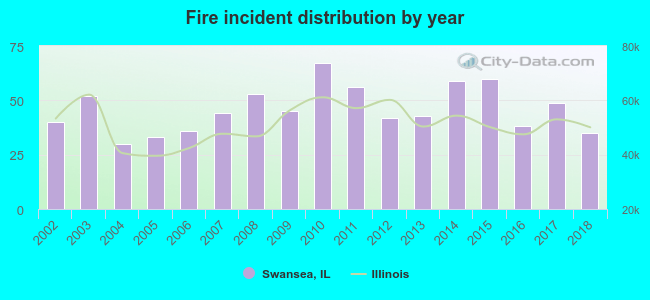 According to the data from the years 2002 - 2018 the average number of fire incidents per year is 46. The highest number of fires - 67 took place in 2010, and the least - 30 in 2004. The data has a declining trend.
The average number of yearly fire incidents per 10k residents in Swansea, IL compared to nearest cities:
(Note: Based on data for the last 3 years, including only cities with population 5,000 and above)
| Swansea: | 29.8 |
| Belleville: | 74.5 |
| Fairview Heights: | 48.7 |
| Shiloh: | 5.4 |
| Centreville: | 233.1 |
| Collinsville: | 53.9 |
| Cahokia: | 146.7 |
| Mascoutah: | 39.8 |
| Maryville: | 3.8 |
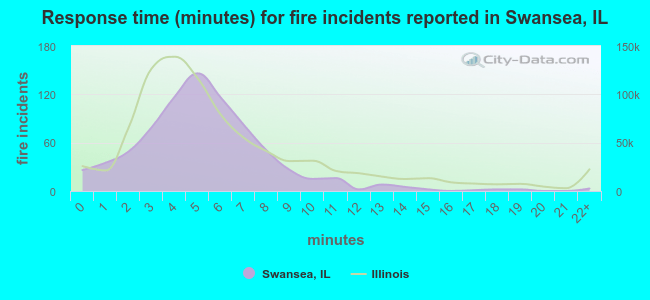 The median response time based on all reported fire incidents is 5 minutes. This is similar to the state median value.
The median response time in Swansea, IL compared to nearest cities:
(Note: Based on data for all years, including only cities with at least 500 fire incidents)
| Swansea: | 5 minutes |
| Belleville: | 4 minutes |
| Fairview Heights: | 5 minutes |
| Caseyville: | 6 minutes |
| Centreville: | 7 minutes |
| Alorton: | 5 minutes |
| Washington Park: | 5 minutes |
| Freeburg: | 8 minutes |
| East St. Louis: | 6 minutes |
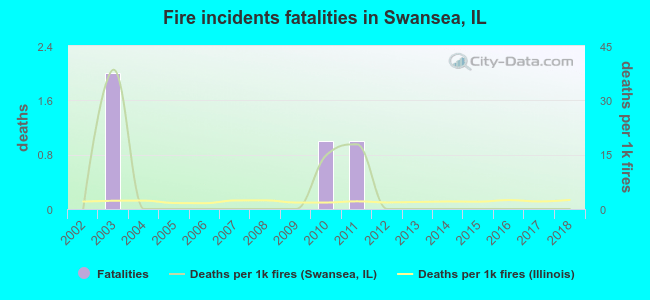 Based on the reports from the years 2002 - 2018 the average number of fire-related fatalities per year is 0. The highest number of reported deaths - 2 took place in 2003, and the lowest - 0 in 2002. The data has a constant trend.
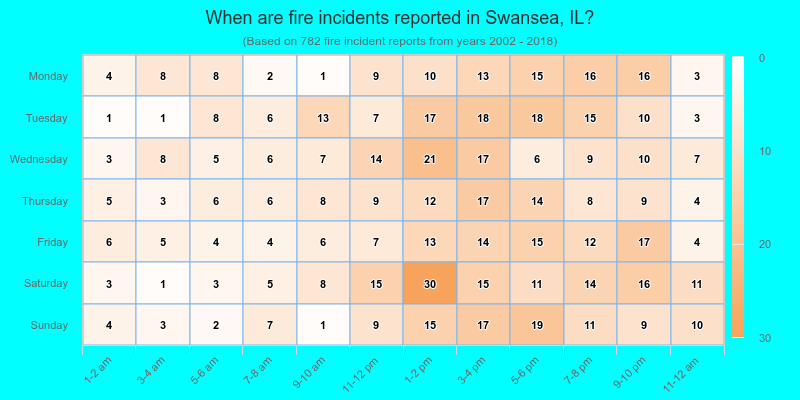
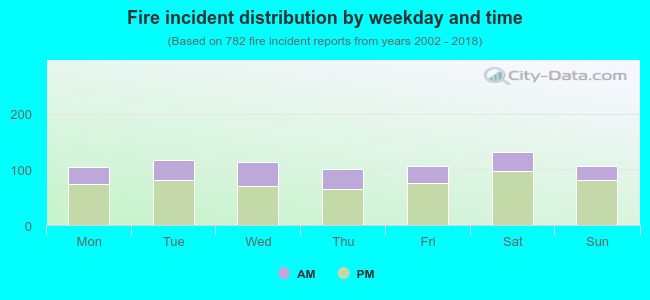 30.8% incidents where reported in the morning and 69.2% in the evening. The most fires (16.9%) took place on Saturday, and the least (12.9%) on Thursday.
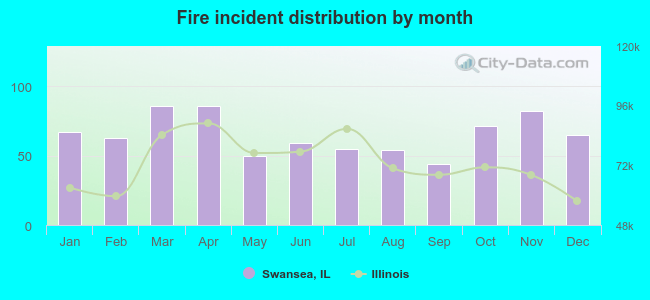 According to the 782 incident reports from years 2002 - 2018 most fires (11.0%) took place during March, and the least (5.6%) in September.
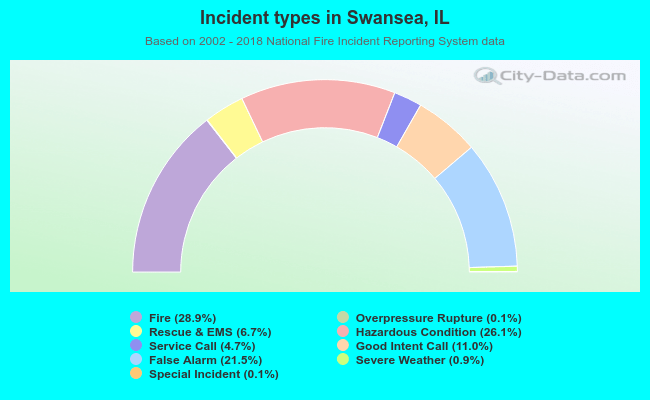 Out of all 2,702 cases reported during the years 2002 - 2018, the most belonged to the categories: Fire (28.9%), Hazardous Condition (26.1%), and False Alarm (21.5%).
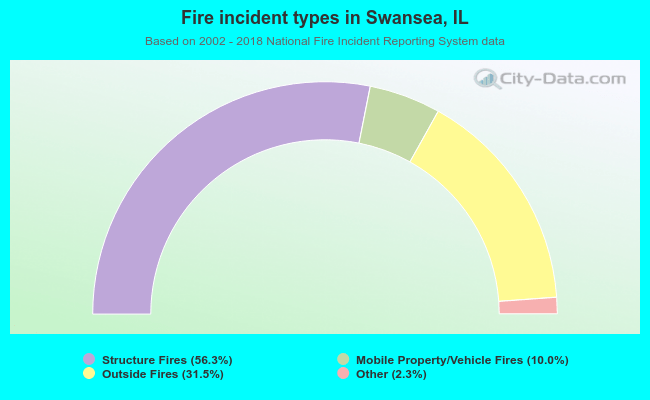 When looking into fire subcategories, the most incidents belonged to: Structure Fires (56.3%), and Outside Fires (31.5%).