Syosset: Fire Incidents, New York (NY)
Where are fire incidents reported in Syosset, NY
Something went wrong! Please refresh the page.
|
| |||||||||||||||||||||||||||||||||||||||||||||||||||||||||||||||||||||||||||||||||||||||||||||||||||||||||||||
2003 - 2018 National Fire Incident Reporting System (NFIRS) incidents
- Incident types reported to NFIRS in Syosset, NY
- 1,73830.6%Rescue & EMS
- 1,61328.4%False Alarm
- 98517.3%Hazardous Condition
- 5389.5%Good Intent Call
- 4548.0%Fire
- 3526.2%Service Call
- Fire incident types reported to NFIRS in Syosset, NY
- 18641.0%Structure Fires
- 14131.1%Outside Fires
- 10422.9%Mobile Property/Vehicle Fires
- 235.1%Other
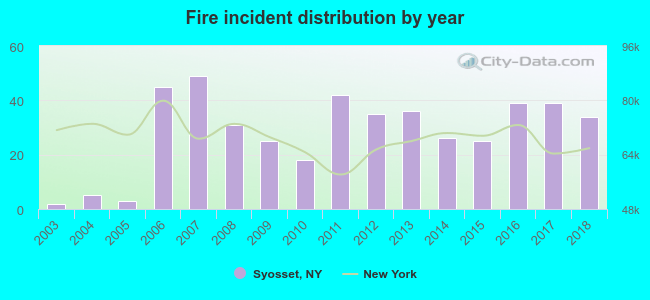 According to the data from the years 2003 - 2018 the average number of fire incidents per year is 28. The highest number of fires - 49 took place in 2007, and the least - 2 in 2003. The data has an increasing trend.
The average number of yearly fire incidents per 10k residents in Syosset, NY compared to nearest cities:
(Note: Based on data for the last 3 years, including only cities with population 5,000 and above)
| Syosset: | 19.8 |
| Woodbury: | 23.2 |
| Plainview: | 9.3 |
| Jericho: | 14.0 |
| Hicksville: | 9.9 |
| Oyster Bay: | 13.9 |
| Old Bethpage: | 3.0 |
| Cold Spring Harbor: | 4.6 |
| Bethpage: | 13.2 |
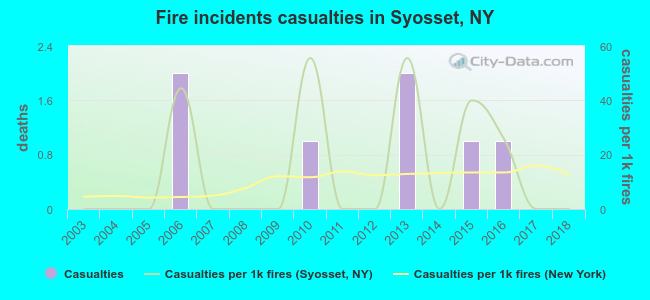 Based on the data from the years 2003 - 2018 the average number of fire-related casualties per year is 0. The highest number of reported injuries - 2 took place in 2006, and the lowest - 0 in 2003. The data has a constant trend.
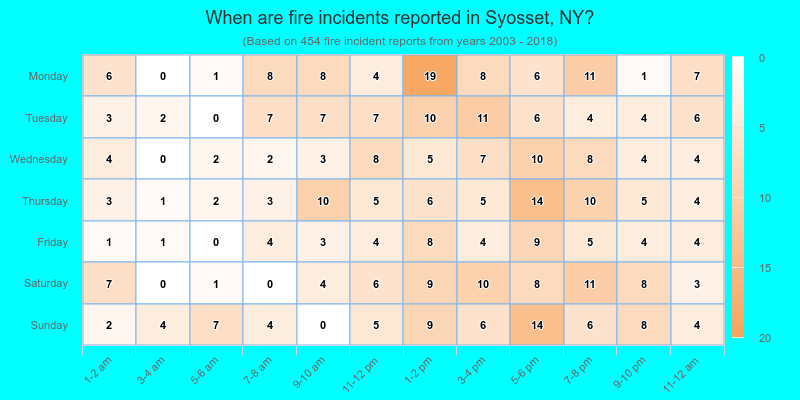
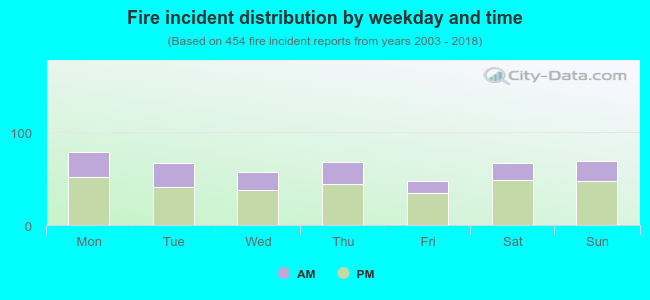 32.8% incidents where reported in the morning and 67.2% in the evening. The most fires (17.4%) took place on Monday, and the least (10.4%) on Friday.
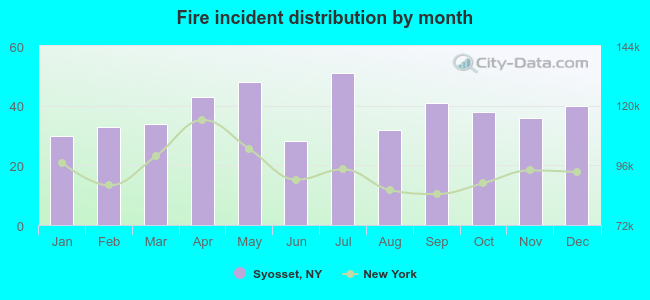 According to the 454 reports from years 2003 - 2018 most fires (11.2%) took place during July, and the least (6.2%) in June.
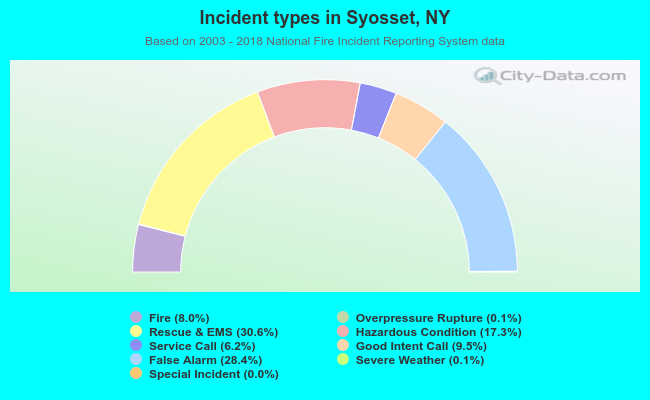 Out of all 5,689 cases reported during the years 2003 - 2018, the most belonged to the categories: Rescue & EMS (30.6%), False Alarm (28.4%), and Hazardous Condition (17.3%).
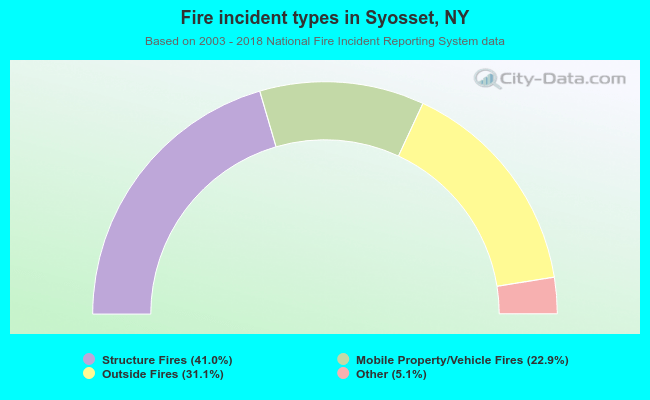 When looking into fire subcategories, the most incidents belonged to: Structure Fires (41.0%), and Outside Fires (31.1%).