| Fire incidents reported |
|---|
| Sreet name | Count |
|---|
| OLD COUNTRY ROAD | 56 | | LONG ISLAND EXPWY EAST BOUND | 18 | | LONG ISLAND EXPRESSWAY | 14 | | SOUTH OYSTER BAY ROAD | 14 | | WOODBURY ROAD | 14 | | LONG ISLAND EXPWY WEST BOUND | 10 | | NORTHERN STATE PARKWAY EAST BO | 10 | | OLD COUNTRY RD | 10 | | MANETTO HILL ROAD | 8 | | ROUND SWAMP ROAD | 8 | | ROXTON ROAD | 8 | | SEAFORD OYSTER-BAY EXPWY | 8 | | SUNNYSIDE BOULEVARD | 8 | | FLORAL AVENUE | 6 | | NASSAU AVENUE | 6 | | NORTHERN STATE PARKWAY | 6 | | RICHARD COURT | 6 | | SEAFORD OYSTER BAY EXPRESSWA | 6 | | SEAFORD OYSTERBAY EXPWY | 6 | | SOUTH SERVICE ROAD | 6 | | WINTHROP ROAD | 6 | | BLANCHE STREET | 4 | | CENTRAL PARK ROAD | 4 | | COMMERCIAL STREET | 4 | | DEBORA DRIVE | 4 |
| | | Fire incidents reported |
|---|
| Sreet name | Count |
|---|
| DUPONT STREET | 4 | | EILEEN AVE | 4 | | EVA LANE | 4 | | EXPRESS STREET | 4 | | FOREST DRIVE | 4 | | GROHMANS LANE | 4 | | MELONY AVENUE | 4 | | NAUTILUS AVENUE | 4 | | NEWTOWN RD | 4 | | NEWTOWN ROAD | 4 | | PLAINVIEW ROAD | 4 | | RIDGE DRIVE | 4 | | ROUND TREE DRIVE | 4 | | SEBREE PLACE | 4 | | SOUTH OAKS BOULEVARD | 4 | | SURREY LANE | 4 | | SYLVIA LANE | 4 | | WEST AMES COURT | 4 | | WESTBURY AVENUE | 4 | | WINDING RD | 4 | | WINTERS COURT | 4 | | 67 CRESENT DRIVE DR | 2 | | ADRIENNE DR | 2 | | AMBY AVENUE | 2 | | AUDLEY CIR | 2 |
|
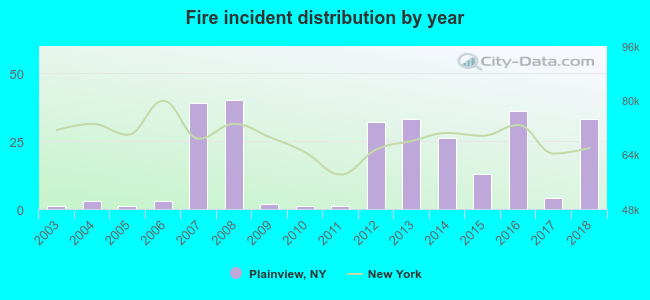 According to the data from the years 2003 - 2018 the average number of fire incidents per year is 17. The highest number of reported fire incidents - 40 took place in 2008, and the least - 1 in 2003. The data has a rising trend.
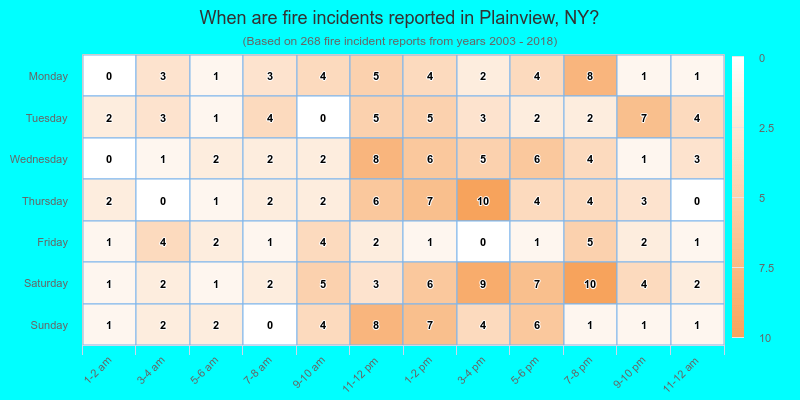
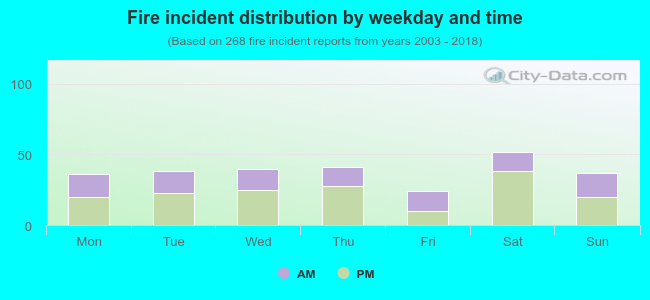 38.8% incidents where reported in the morning and 61.2% in the evening. The most fires (19.4%) took place on Saturday, and the least (9.0%) on Friday.
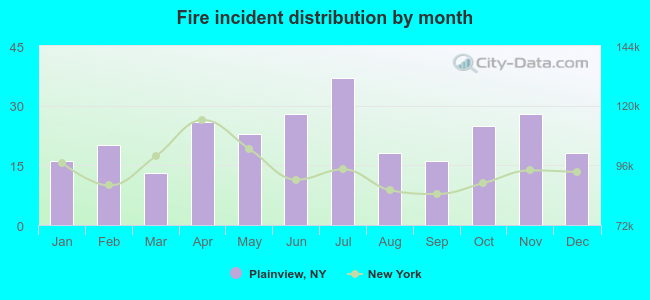 Based on the 268 fires from years 2003 - 2018 most fires (13.8%) took place during July, and the least (4.9%) in March.
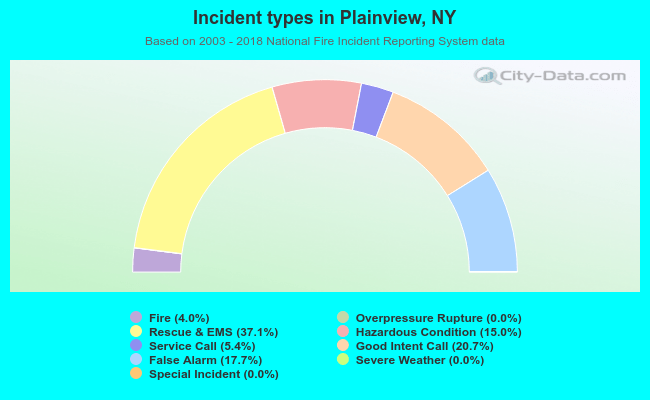 Out of all 6,661 cases reported during the years 2003 - 2018, the most belonged to the categories: Rescue & EMS (37.1%), Good Intent Call (20.7%), and False Alarm (17.7%).
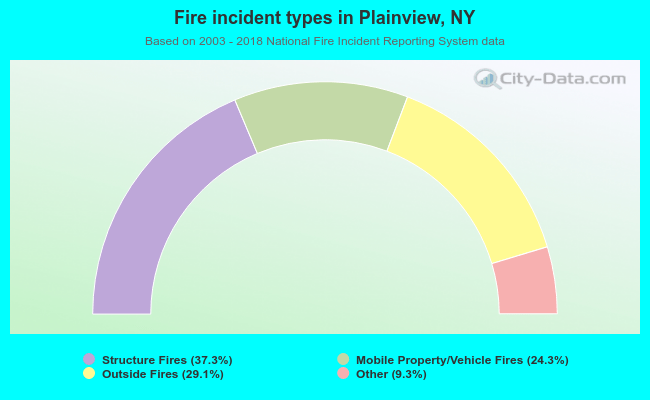 When looking into fire subcategories, the most incidents belonged to: Structure Fires (37.3%), and Outside Fires (29.1%).