| Fire incidents reported |
|---|
| Sreet name | Count |
|---|
| JERICHO TURNPIKE | 90 | | WOODBURY ROAD | 46 | | PLAINVIEW ROAD | 22 | | SOUTHWOODS ROAD | 18 | | LONG ISLAND EXPWY | 14 | | SYOSSET WOODBURY ROAD | 14 | | FOX HOLLOW ROAD | 12 | | JUNEAU BOULEVARD | 12 | | ORCHARD DRIVE | 12 | | PHEASANT LANE | 12 | | CROSSWAYS PARK DRIVE | 10 | | CROSSWAYS PARK WEST | 10 | | SEAFORD OYSTER BAY EXPWY | 10 | | FAIRBANKS BOULEVARD | 8 | | FROEHLICH FARM BOULEVARD | 8 | | HUNTING HILL ROAD | 8 | | SUNNYSIDE BOULEVARD EXT | 8 | | WINDEMERE WAY | 8 | | FAIRHAVEN BOULEVARD | 6 | | GLORIA DRIVE | 6 | | STILLWELL LANE | 6 | | YUKON DRIVE | 6 | | BERING COURT | 4 | | CHESTNUT LANE | 4 | | CYPRESS DRIVE | 4 |
| | | Fire incidents reported |
|---|
| Sreet name | Count |
|---|
| GREENWOOD LANE | 4 | | JERICHO TPK | 4 | | VILLAGE LANE | 4 | | WOODBURY FIRE DIST | 4 | | WOODBURY FIRE DIST. | 4 | | WOODLAKE DRIVE EAST | 4 | | 16 RAANANJI ROAD | 2 | | 3RD STREET | 2 | | ARON DRIVE | 2 | | ASPEN DRIVE | 2 | | BAIRD COURTWOODBURY | 2 | | BAKERTOWN RD | 2 | | CASTLE COURT | 2 | | CASTLE DRIVE | 2 | | CAUMSETT FARMS LANE | 2 | | CAUMSETT WOODS LANE | 2 | | CHAUNCEY PLACE | 2 | | CHRISTOPHER COURT | 2 | | CLEARMEADOW COURT | 2 | | CLEMSON LANE | 2 | | CO RTE 105 | 2 | | COUNTY RT. 105 | 2 | | CROSSWAYS PARK DR | 2 | | CROSSWAYS PARK NORTH | 2 | | CTY RTE 105 | 2 |
|
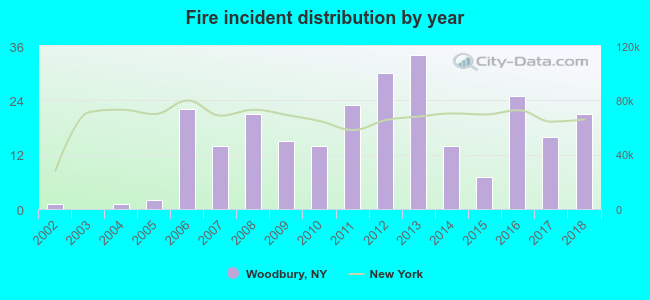 According to the data from the years 2002 - 2018 the average number of fires per year is 15. The highest number of fires - 34 took place in 2013, and the least - 0 in 2003. The data has a growing trend.
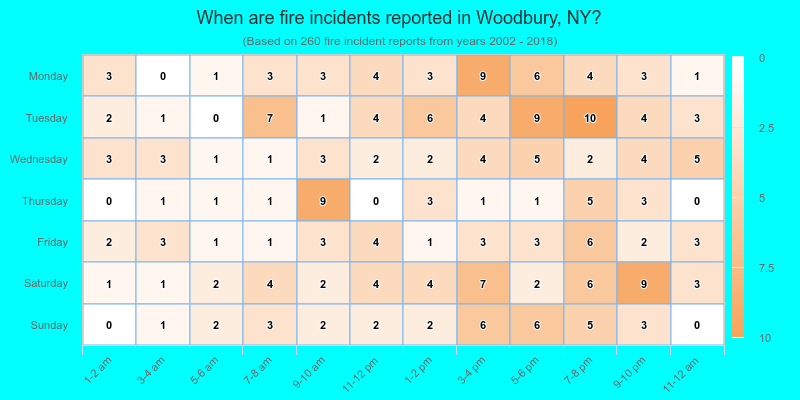
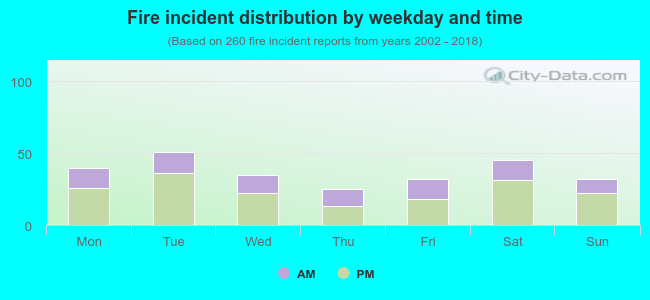 35.4% incidents where reported in the morning and 64.6% in the evening. The most fires (19.6%) took place on Tuesday, and the least (9.6%) on Thursday.
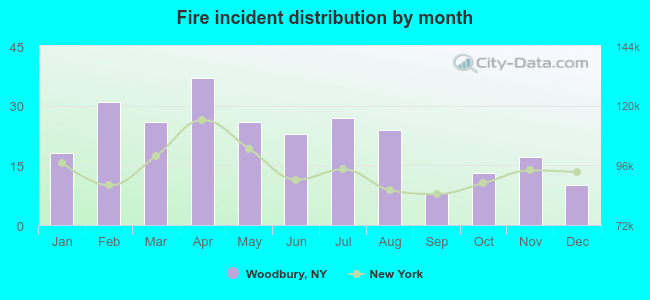 Based on the 260 reports from years 2002 - 2018 most fires (14.2%) took place during April, and the least (3.1%) in September.
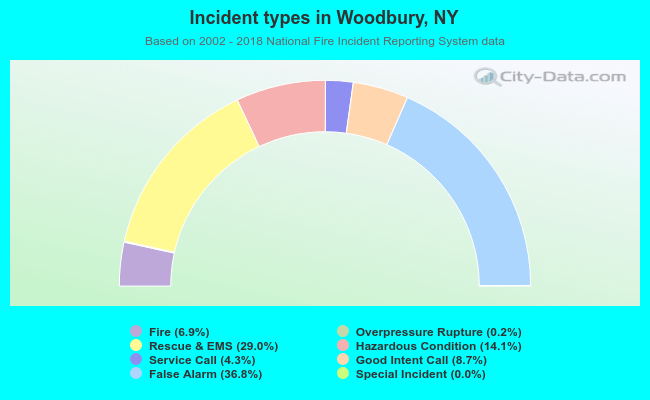 Out of all 3,795 cases reported during the years 2002 - 2018, the most belonged to the categories: False Alarm (36.8%), Rescue & EMS (29.0%), and Hazardous Condition (14.1%).
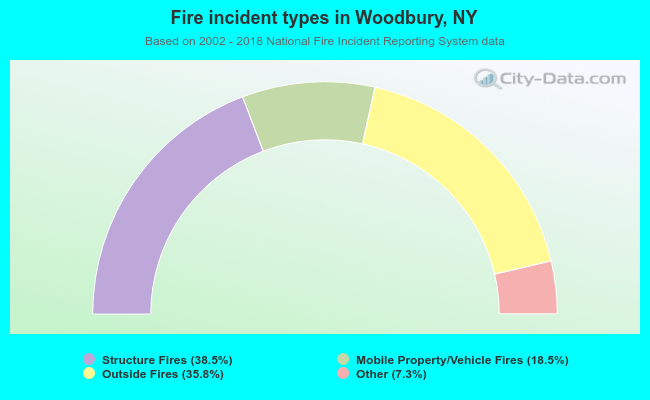 When looking into fire subcategories, the most reports belonged to: Structure Fires (38.5%), and Outside Fires (35.8%).