West Point: Fire Incidents, Utah (UT)
Where are fire incidents reported in West Point, UT
Something went wrong! Please refresh the page.
|
| |||||||||||||||||||||||||||||||||||||||||||||||||||||||||||||||||||||||||||||||||||||||||||||||||||||||||||||
2002 - 2018 National Fire Incident Reporting System (NFIRS) incidents
- Incident types reported to NFIRS in West Point, UT
- 1,11756.6%Rescue & EMS
- 34517.5%Fire
- 1849.3%Hazardous Condition
- 1286.5%False Alarm
- 1196.0%Good Intent Call
- 773.9%Service Call
- 20.1%Special Incident
- Fire incident types reported to NFIRS in West Point, UT
- 15444.6%Outside Fires
- 14441.7%Structure Fires
- 267.5%Mobile Property/Vehicle Fires
- 216.1%Other
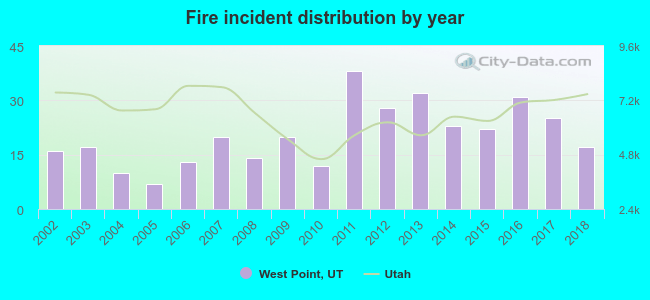 Based on the data from the years 2002 - 2018 the average number of fires per year is 20. The highest number of fires - 38 took place in 2011, and the least - 7 in 2005. The data has a rising trend.
The average number of yearly fire incidents per 10k residents in West Point, UT compared to nearest cities:
(Note: Based on data for the last 3 years, including only cities with population 5,000 and above)
| West Point: | 23.8 |
| Clinton: | 20.5 |
| Syracuse: | 10.4 |
| Sunset: | 30.4 |
| Clearfield: | 29.2 |
| Hooper: | 23.0 |
| Roy: | 20.1 |
| West Haven: | 40.6 |
| Riverdale: | 33.0 |
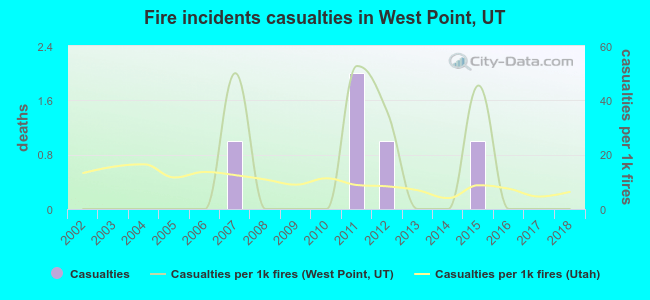 Based on the reports from the years 2002 - 2018 the average number of fire-related casualties per year is 0. The highest number of reported injuries - 2 took place in 2011, and the lowest - 0 in 2002. The data has a constant trend.
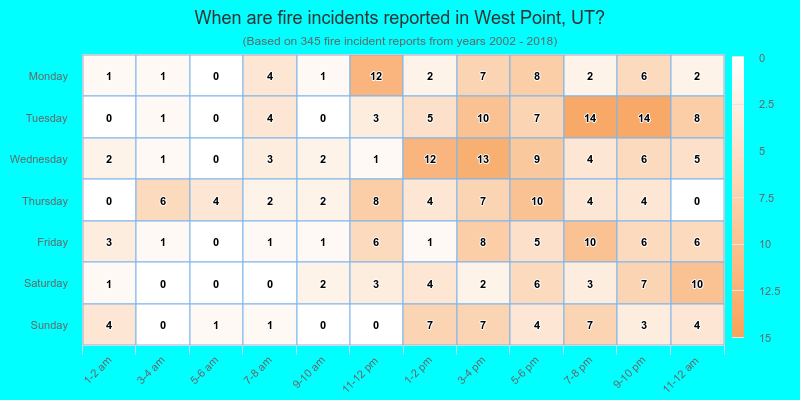
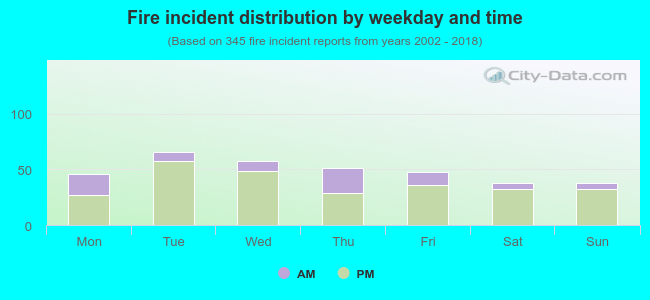 23.8% incidents where reported in the morning and 76.2% in the evening. The most fires (19.1%) took place on Tuesday, and the least (11.0%) on Saturday.
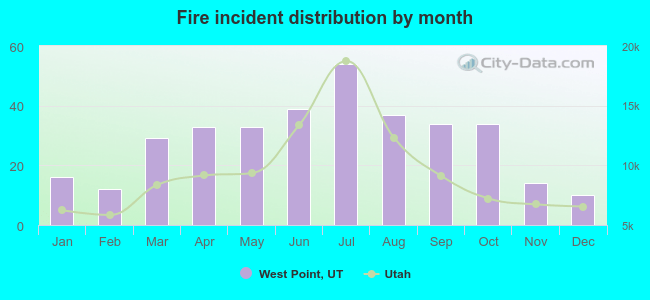 Based on the 345 fire incident reports from years 2002 - 2018 most fires (15.7%) took place during July, and the least (2.9%) in December.
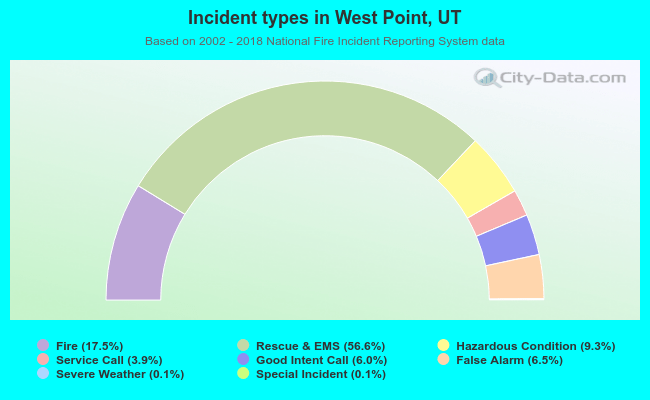 Out of all 1,973 cases reported during the years 2002 - 2018, the most belonged to the categories: Overpressure Rupture (56.6%), Fire (17.5%), and Rescue & EMS (9.3%).
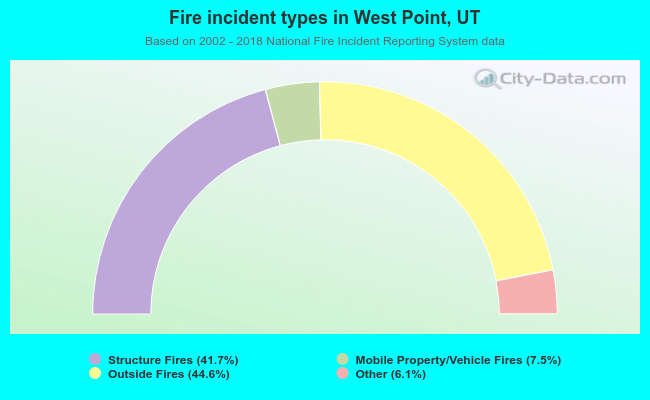 When looking into fire subcategories, the most incidents belonged to: Outside Fires (44.6%), and Structure Fires (41.7%).