Topeka: Fire Incidents, Kansas (KS)
Where are fire incidents reported in Topeka, KS
Something went wrong! Please refresh the page.
| Fire incidents reported | |
|---|---|
| Sreet name | Count |
| TOPEKA BLVD | 706 |
| 6TH AVE | 564 |
| POLK ST | 490 |
| KANSAS AVE | 464 |
| 29TH ST | 450 |
| CLAY ST | 340 |
| WANAMAKER RD | 326 |
| TYLER ST | 322 |
| FILLMORE ST | 316 |
| 10TH AVE | 310 |
| 21ST ST | 302 |
| HARRISON ST | 288 |
| MADISON ST | 276 |
| GAGE BLVD | 270 |
| WESTERN AVE | 270 |
| TAYLOR ST | 234 |
| 17TH ST | 226 |
| BUCHANAN ST | 224 |
| I70 HWY | 214 |
| JACKSON ST | 208 |
| HUNTOON ST | 206 |
| LINCOLN ST | 200 |
| ADAMS ST | 194 |
| CALIFORNIA AVE | 192 |
| 37TH ST | 190 |
| 25TH ST | 188 |
| MONROE ST | 188 |
| WASHBURN AVE | 188 |
| LANE ST | 184 |
| 24 HWY | 180 |
| Other | 8,216 |
2002 - 2018 National Fire Incident Reporting System (NFIRS) incidents
- Incident types reported to NFIRS in Topeka, KS
- 70,36952.8%Rescue & EMS
- 24,79818.6%Good Intent Call
- 16,92612.7%Fire
- 7,8805.9%False Alarm
- 6,6185.0%Service Call
- 6,4034.8%Hazardous Condition
- 2030.2%Overpressure Rupture
- Fire incident types reported to NFIRS in Topeka, KS
- 8,95752.9%Outside Fires
- 5,26631.1%Structure Fires
- 2,41814.3%Mobile Property/Vehicle Fires
- 2851.7%Other
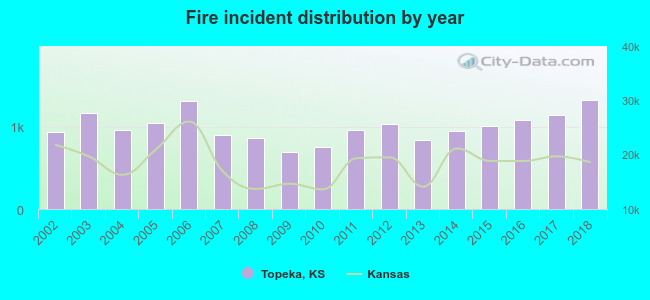 According to the data from the years 2002 - 2018 the average number of fire incidents per year is 996. The highest number of reported fires - 1,318 took place in 2018, and the least - 693 in 2009. The data has a rising trend.
The average number of yearly fire incidents per 10k residents in Topeka, KS compared to nearest cities:
(Note: Based on data for the last 3 years, including only cities with population 5,000 and above)
| Topeka: | 92.7 |
| Lawrence: | 40.1 |
| Eudora: | 108.4 |
| Tonganoxie: | 213.8 |
| Ottawa: | 106.2 |
| De Soto: | 36.4 |
| Basehor: | 108.7 |
| Bonner Springs: | 50.3 |
| Gardner: | 33.9 |
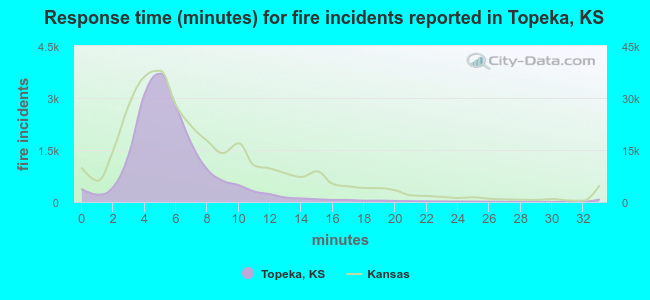 The median response time based on all reported fire incidents is 5 minutes. This is lower than the state median value.
The median response time in Topeka, KS compared to nearest cities:
(Note: Based on data for all years, including only cities with at least 500 fire incidents)
| Topeka: | 5 minutes |
| Silver Lake: | 11 minutes |
| Auburn: | 9 minutes |
| Meriden: | 12 minutes |
| Hoyt: | 10 minutes |
| Carbondale: | 10 minutes |
| Lecompton: | 12 minutes |
| Ozawkie: | 15 minutes |
| Mayetta: | 9 minutes |
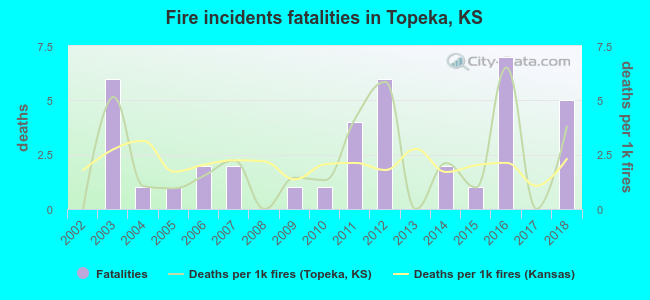 According to the data from the years 2002 - 2018 the average number of fire-related fatalities per year is 2. The highest number of deaths - 7 took place in 2016, and the lowest - 0 in 2002. The data has a growing trend.
The average number of fatalities per 1,000 fire incidents is 2. This indicator was the highest - 7 in 2016, and the lowest 0 in 2002. The trend for fatalities per 1,000 fires is rising. Compared to the Kansas value the number of deaths per 1,000 fire incidents is similar.
According to the data from the years 2002 - 2018 the average number of fire-related fatalities per year is 2. The highest number of deaths - 7 took place in 2016, and the lowest - 0 in 2002. The data has a growing trend.
The average number of fatalities per 1,000 fire incidents is 2. This indicator was the highest - 7 in 2016, and the lowest 0 in 2002. The trend for fatalities per 1,000 fires is rising. Compared to the Kansas value the number of deaths per 1,000 fire incidents is similar.Deaths per 1,000 incidents in Topeka, KS compared to nearest cities:
(Note: Based on data for all years, including only cities with at least 2,500 fire incidents)
| Topeka: | 2.3 |
| Lawrence: | 0.5 |
| Leavenworth: | 1.6 |
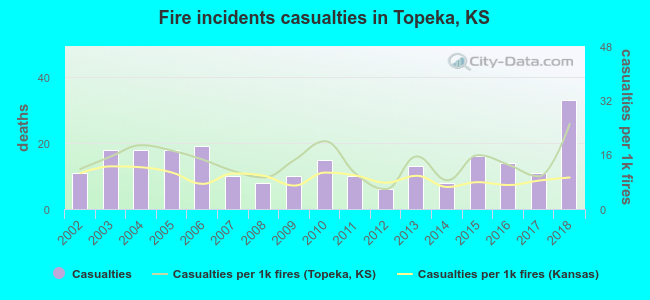 According to the data from the years 2002 - 2018 the average number of fire-related yearly casualties is 14. The highest number of injuries - 33 took place in 2018, and the lowest - 6 in 2012. The data has a rising trend.
The average number of casualties per 1,000 fire incidents is 14. This indicator was the highest - 25 in 2018, and the lowest 6 in 2012. The trend for injuries per 1,000 fire incidents is rising. Compared to the Kansas value the number of injuries per 1,000 fires is higher.
According to the data from the years 2002 - 2018 the average number of fire-related yearly casualties is 14. The highest number of injuries - 33 took place in 2018, and the lowest - 6 in 2012. The data has a rising trend.
The average number of casualties per 1,000 fire incidents is 14. This indicator was the highest - 25 in 2018, and the lowest 6 in 2012. The trend for injuries per 1,000 fire incidents is rising. Compared to the Kansas value the number of injuries per 1,000 fires is higher.Casualties per 1,000 incidents in Topeka, KS compared to nearest cities:
(Note: Based on data for all years, including only cities with at least 500 fire incidents)
| Topeka: | 14.1 |
| Silver Lake: | 3.0 |
| Auburn: | 3.1 |
| Meriden: | 0.0 |
| Hoyt: | 0.0 |
| Carbondale: | 1.7 |
| Lecompton: | 0.0 |
| Ozawkie: | 0.0 |
| Mayetta: | 6.6 |
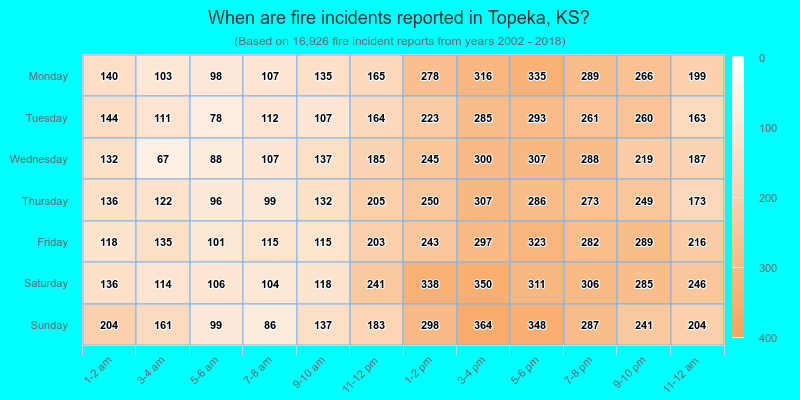
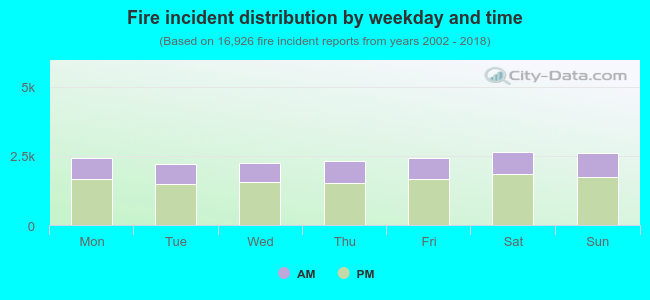 32.2% incidents where reported in the morning and 67.8% in the evening. The most fires (15.7%) took place on Saturday, and the least (13.0%) on Tuesday.
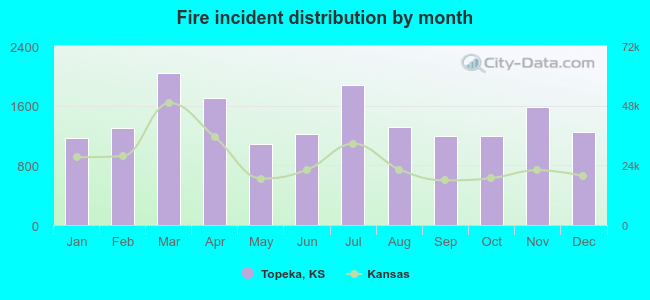 Based on the 16,926 fire incident reports from years 2002 - 2018 most fires (12.0%) took place during March, and the least (6.4%) in May.
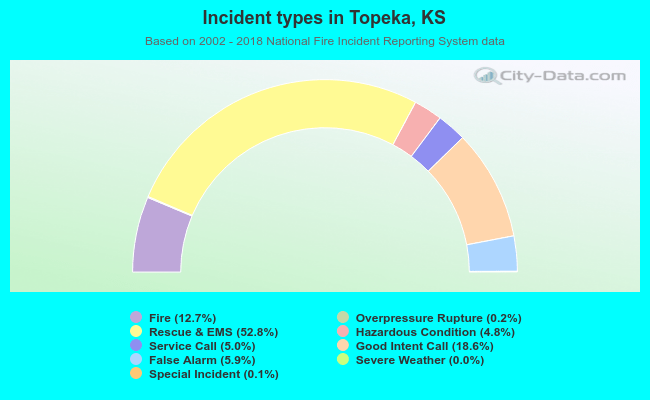 Out of all 133,339 cases reported during the years 2002 - 2018, the most belonged to the categories: Rescue & EMS (52.8%), Good Intent Call (18.6%), and Fire (12.7%).
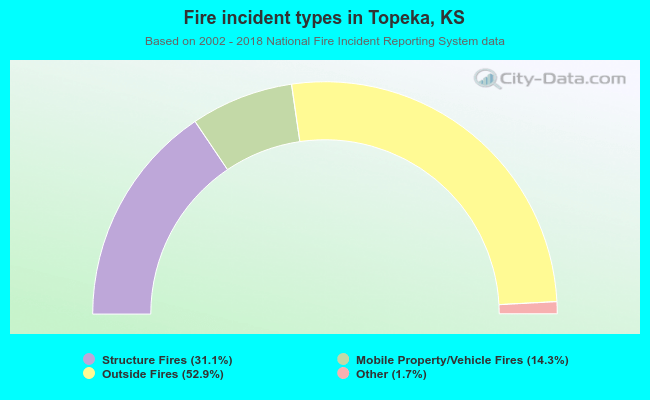 When looking into fire subcategories, the most incidents belonged to: Outside Fires (52.9%), and Structure Fires (31.1%).