Lawrence: Fire Incidents, Kansas (KS)
Where are fire incidents reported in Lawrence, KS
Something went wrong! Please refresh the page.
| Fire incidents reported | |
|---|---|
| Sreet name | Count |
| MASSACHUSETTS ST | 284 |
| 6TH ST | 274 |
| IOWA ST | 266 |
| TENNESSEE ST | 222 |
| 23RD ST | 220 |
| 1000 RD | 200 |
| LOUISIANA ST | 196 |
| 24TH ST | 194 |
| KENTUCKY ST | 168 |
| OHIO ST | 162 |
| 31ST ST | 146 |
| 1100 RD | 144 |
| 19TH ST | 132 |
| 1600 RD | 128 |
| 3RD ST | 114 |
| VERMONT ST | 112 |
| 15TH ST | 104 |
| 900 RD | 102 |
| 27TH ST | 96 |
| MICHIGAN ST | 96 |
| 1500 RD | 94 |
| HASKELL AVE | 94 |
| JAYHAWK BLVD | 94 |
| 9TH ST | 92 |
| MISSISSIPPI ST | 92 |
| 26TH ST | 90 |
| NEW HAMPSHIRE ST | 90 |
| ENGEL RD | 86 |
| ALABAMA ST | 84 |
| EMERY RD | 84 |
| Other | 2,116 |
2002 - 2018 National Fire Incident Reporting System (NFIRS) incidents
- Incident types reported to NFIRS in Lawrence, KS
- 40,23357.1%Rescue & EMS
- 6,7029.5%Good Intent Call
- 6,3849.1%False Alarm
- 6,3769.0%Fire
- 5,9498.4%Hazardous Condition
- 3,9415.6%Service Call
- 7861.1%Special Incident
- 980.1%Overpressure Rupture
- Fire incident types reported to NFIRS in Lawrence, KS
- 3,11248.8%Outside Fires
- 2,18334.2%Structure Fires
- 1,00215.7%Mobile Property/Vehicle Fires
- 791.2%Other
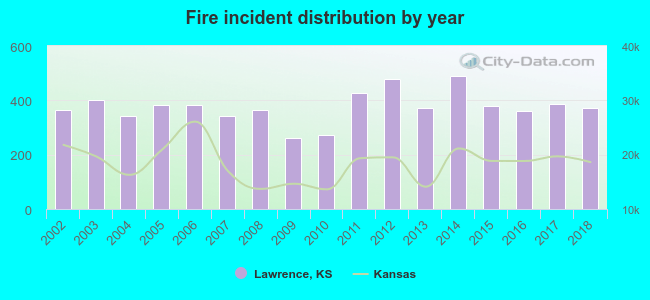 Based on the data from the years 2002 - 2018 the average number of fires per year is 375. The highest number of reported fires - 491 took place in 2014, and the least - 260 in 2009. The data has a growing trend.
The average number of yearly fire incidents per 10k residents in Lawrence, KS compared to nearest cities:
(Note: Based on data for the last 3 years, including only cities with population 5,000 and above)
| Lawrence: | 40.1 |
| Eudora: | 108.4 |
| Tonganoxie: | 213.8 |
| De Soto: | 36.4 |
| Gardner: | 33.9 |
| Basehor: | 108.7 |
| Bonner Springs: | 50.3 |
| Ottawa: | 106.2 |
| Topeka: | 92.7 |
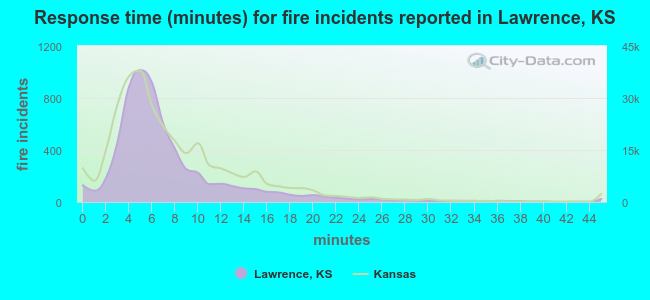 The median response time based on all reported fire incidents is 6 minutes. This is close to the Kansas median value.
The median response time in Lawrence, KS compared to nearest cities:
(Note: Based on data for all years, including only cities with at least 500 fire incidents)
| Lawrence: | 6 minutes |
| Eudora: | 8 minutes |
| Lecompton: | 12 minutes |
| Linwood: | 10 minutes |
| Baldwin City: | 9 minutes |
| Tonganoxie: | 10 minutes |
| McLouth: | 12 minutes |
| Oskaloosa: | 12 minutes |
| Wellsville: | 10 minutes |
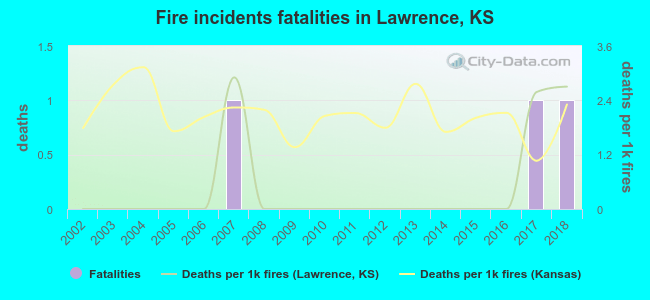 Based on the data from the years 2002 - 2018 the average number of fire-related fatalities per year is 0. The highest number of deaths - 1 took place in 2007, and the lowest - 0 in 2002. The data has an increasing trend.
The average number of deaths per 1,000 fire incidents is 0. This indicator was the highest - 3 in 2007, and the lowest 0 in 2002. The trend for fatalities per 1,000 fires is rising. Compared to the state value the number of deaths per 1,000 fires is much lower.
Based on the data from the years 2002 - 2018 the average number of fire-related fatalities per year is 0. The highest number of deaths - 1 took place in 2007, and the lowest - 0 in 2002. The data has an increasing trend.
The average number of deaths per 1,000 fire incidents is 0. This indicator was the highest - 3 in 2007, and the lowest 0 in 2002. The trend for fatalities per 1,000 fires is rising. Compared to the state value the number of deaths per 1,000 fires is much lower.Deaths per 1,000 incidents in Lawrence, KS compared to nearest cities:
(Note: Based on data for all years, including only cities with at least 2,500 fire incidents)
| Lawrence: | 0.5 |
| Topeka: | 2.3 |
| Olathe: | 2.9 |
| Lenexa: | 2.4 |
| Leavenworth: | 1.6 |
| Overland Park: | 3.3 |
| Kansas City: | 4.0 |
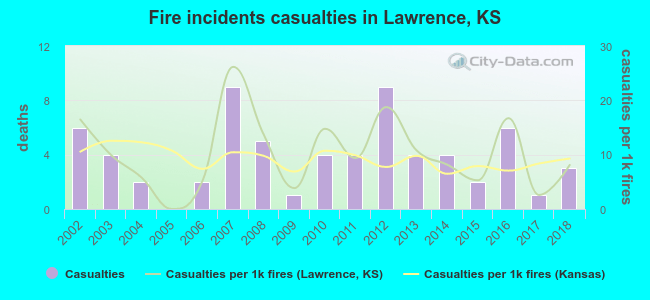 Based on the data from the years 2002 - 2018 the average number of fire-related yearly casualties is 4. The highest number of reported injuries - 9 took place in 2007, and the lowest - 0 in 2005. The data has a dropping trend.
The average number of casualties per 1,000 fire incidents is 10. This indicator was the highest - 26 in 2007, and the lowest 0 in 2005. The trend for injuries per 1,000 incidents is declining. Compared to the state value the number of casualties per 1,000 fire incidents is similar.
Based on the data from the years 2002 - 2018 the average number of fire-related yearly casualties is 4. The highest number of reported injuries - 9 took place in 2007, and the lowest - 0 in 2005. The data has a dropping trend.
The average number of casualties per 1,000 fire incidents is 10. This indicator was the highest - 26 in 2007, and the lowest 0 in 2005. The trend for injuries per 1,000 incidents is declining. Compared to the state value the number of casualties per 1,000 fire incidents is similar.Casualties per 1,000 incidents in Lawrence, KS compared to nearest cities:
(Note: Based on data for all years, including only cities with at least 500 fire incidents)
| Lawrence: | 10.4 |
| Eudora: | 3.3 |
| Lecompton: | 0.0 |
| Linwood: | 0.0 |
| Baldwin City: | 5.7 |
| Tonganoxie: | 0.5 |
| McLouth: | 2.3 |
| Oskaloosa: | 0.0 |
| Wellsville: | 1.3 |
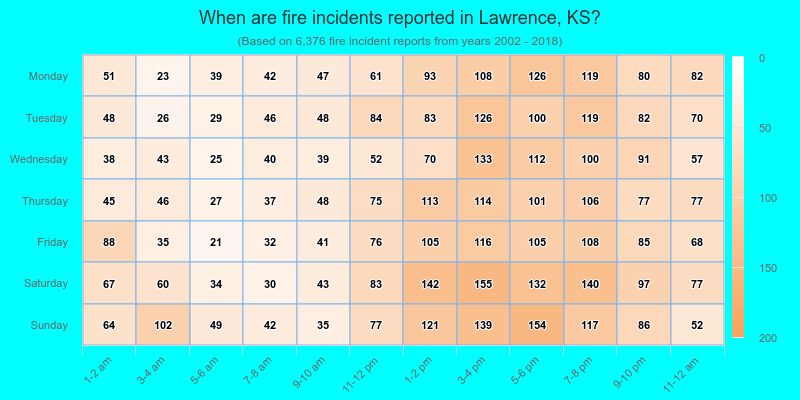
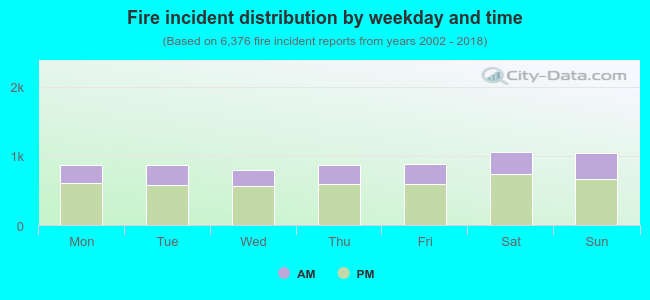 32.0% incidents where reported in the morning and 68.0% in the evening. The most fires (16.6%) took place on Saturday, and the least (12.5%) on Wednesday.
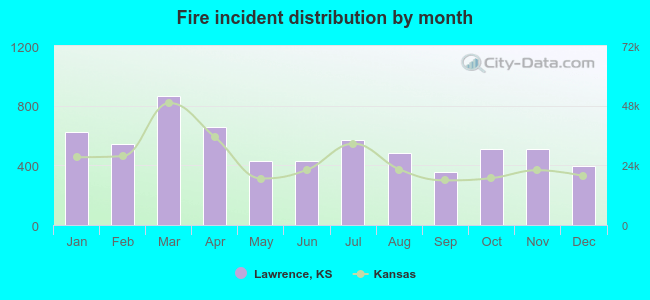 According to the 6,376 fire incident reports from years 2002 - 2018 most fires (13.6%) took place during March, and the least (5.6%) in September.
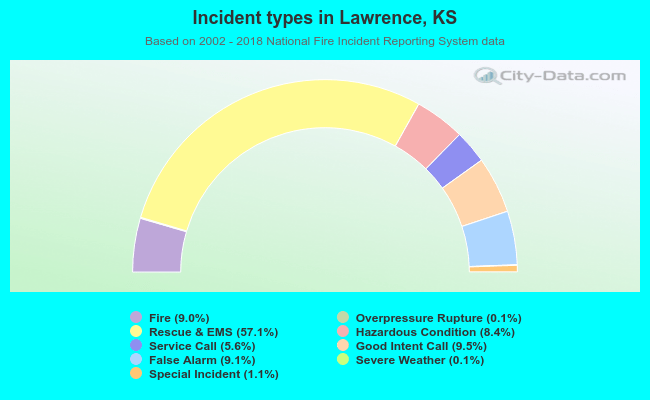 Out of all 70,515 cases reported during the years 2002 - 2018, the most belonged to the categories: Rescue & EMS (57.1%), Good Intent Call (9.5%), and False Alarm (9.1%).
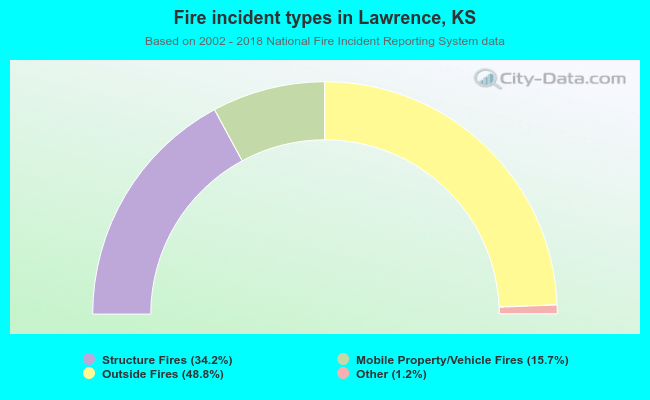 When looking into fire subcategories, the most incidents belonged to: Outside Fires (48.8%), and Structure Fires (34.2%).