Union: Fire Incidents, Kentucky (KY)
Where are fire incidents reported in Union, KY
Something went wrong! Please refresh the page.
|
| |||||||||||||||||||||||||||||||||||||||||||||||||||||||||||||||||||||||||||||||||||||||||||||||||||||||||||||
2002 - 2018 National Fire Incident Reporting System (NFIRS) incidents
- Incident types reported to NFIRS in Union, KY
- 95432.4%Rescue & EMS
- 50117.0%Good Intent Call
- 47016.0%Fire
- 38313.0%Hazardous Condition
- 34511.7%False Alarm
- 2749.3%Service Call
- 130.4%Severe Weather
- 40.1%Overpressure Rupture
- Fire incident types reported to NFIRS in Union, KY
- 19341.1%Structure Fires
- 19240.9%Outside Fires
- 4810.2%Mobile Property/Vehicle Fires
- 377.9%Other
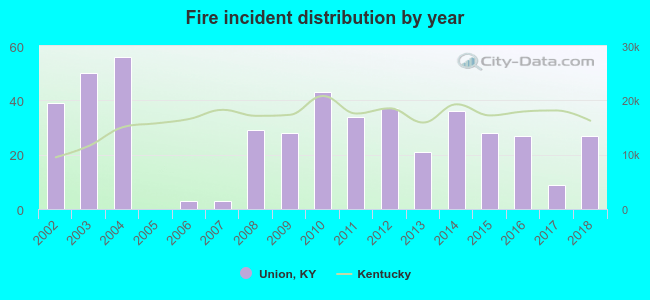 Based on the data from the years 2002 - 2018 the average number of fires per year is 28. The highest number of reported fire incidents - 56 took place in 2004, and the least - 0 in 2005. The data has a dropping trend.
The average number of yearly fire incidents per 10k residents in Union, KY compared to nearest cities:
(Note: Based on data for the last 3 years, including only cities with population 5,000 and above)
| Union: | 36.6 |
| Florence: | 68.6 |
| Elsmere: | 33.3 |
| Burlington: | 20.1 |
| Erlanger: | 44.2 |
| Independence: | 26.2 |
| Edgewood: | 17.9 |
| Villa Hills: | 16.2 |
| Fort Mitchell: | 26.6 |

 29.6% incidents where reported in the morning and 70.4% in the evening. The most fires (20.4%) took place on Saturday, and the least (11.1%) on Wednesday.
 According to the 470 reports from years 2002 - 2018 most fires (10.9%) took place during January, and the least (6.0%) in June.
 Out of all 2,945 cases reported during the years 2002 - 2018, the most belonged to the categories: Rescue & EMS (32.4%), Good Intent Call (17.0%), and Fire (16.0%).
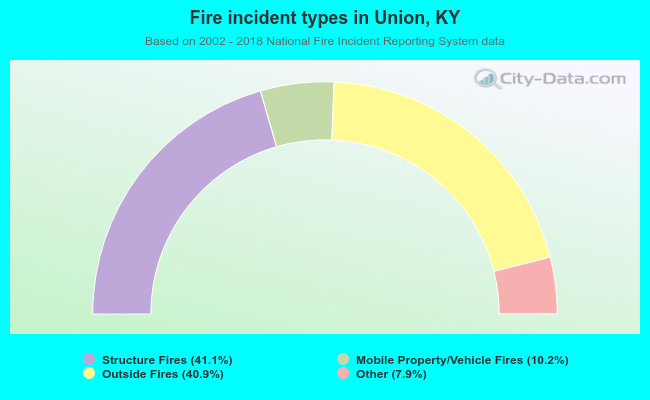 When looking into fire subcategories, the most incidents belonged to: Structure Fires (41.1%), and Outside Fires (40.9%).