Wamego: Fire Incidents, Kansas (KS)
Where are fire incidents reported in Wamego, KS
Something went wrong! Please refresh the page.
|
| |||||||||||||||||||||||||||||||||||||||||||||||||||||||||||||||||||||||||||||||||||||||||||||||||||||||||||||
| Other | 57 | |||||||||||||||||||||||||||||||||||||||||||||||||||||||||||||||||||||||||||||||||||||||||||||||||||||||||||||
2002 - 2018 National Fire Incident Reporting System (NFIRS) incidents
- Incident types reported to NFIRS in Wamego, KS
- 72149.6%Fire
- 30220.8%Hazardous Condition
- 17412.0%Rescue & EMS
- 966.6%Good Intent Call
- 674.6%False Alarm
- 553.8%Severe Weather
- 312.1%Service Call
- 60.4%Special Incident
- 20.1%Overpressure Rupture
- Fire incident types reported to NFIRS in Wamego, KS
- 40355.9%Outside Fires
- 19727.3%Structure Fires
- 719.8%Mobile Property/Vehicle Fires
- 506.9%Other
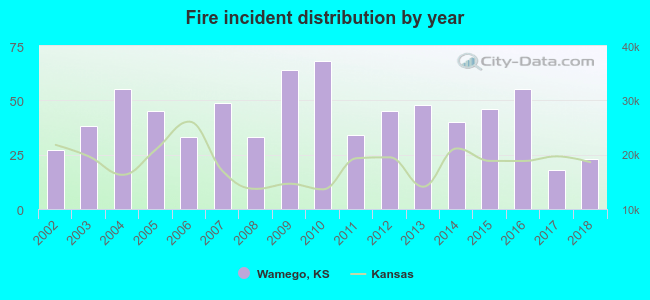 Based on the data from the years 2002 - 2018 the average number of fire incidents per year is 42. The highest number of fires - 68 took place in 2010, and the least - 18 in 2017. The data has a dropping trend.
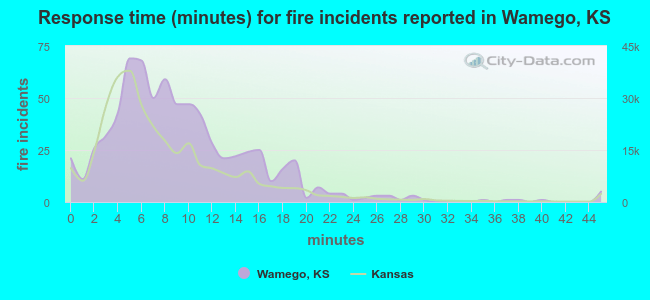 The median response time based on all reported fire incidents is 8 minutes. This is higher than the state median value.
The median response time in Wamego, KS compared to nearest cities:
(Note: Based on data for all years, including only cities with at least 500 fire incidents)
| Wamego: | 8 minutes |
| Manhattan: | 5 minutes |
| Silver Lake: | 11 minutes |
| Junction City: | 4 minutes |
| Hoyt: | 10 minutes |
| Mayetta: | 9 minutes |
| Auburn: | 9 minutes |
| Topeka: | 5 minutes |
| Holton: | 6 minutes |
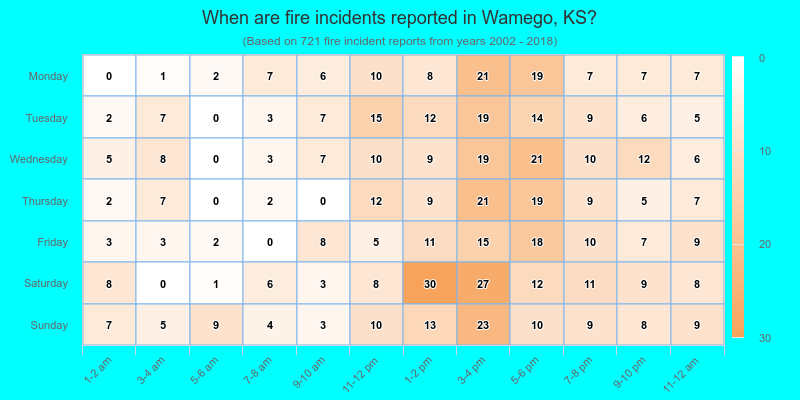
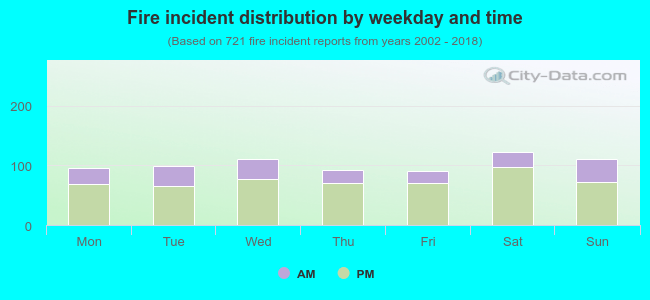 27.9% incidents where reported in the morning and 72.1% in the evening. The most fires (17.1%) took place on Saturday, and the least (12.6%) on Friday.
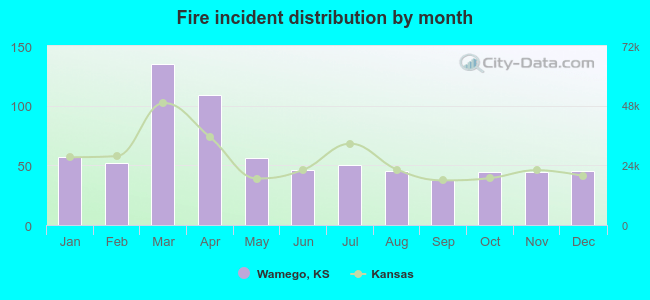 Based on the 721 fires from years 2002 - 2018 most fires (18.7%) took place during March, and the least (5.3%) in September.
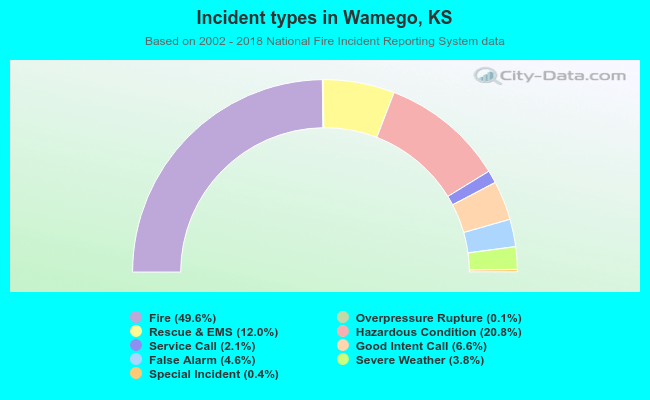 Out of all 1,454 cases reported during the years 2002 - 2018, the most belonged to the categories: Fire (49.6%), Hazardous Condition (20.8%), and Rescue & EMS (12.0%).
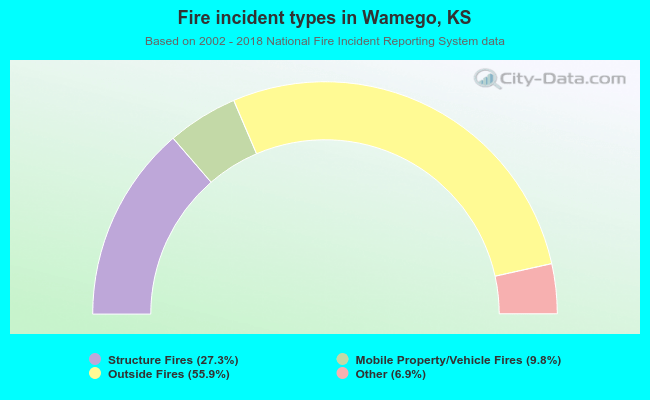 When looking into fire subcategories, the most incidents belonged to: Outside Fires (55.9%), and Structure Fires (27.3%).