Washington: Fire Incidents, Indiana (IN)
Where are fire incidents reported in Washington, IN
Something went wrong! Please refresh the page.
| Fire incidents reported | |
|---|---|
| Sreet name | Count |
| 2ND ST | 172 |
| WALNUT ST | 126 |
| MAIN ST | 118 |
| NATIONAL HWY | 86 |
| VANTREES ST | 86 |
| MERIDIAN ST | 60 |
| 5TH ST | 58 |
| OAK GROVE RD | 50 |
| 11TH ST | 46 |
| MCCORMICK AVE | 46 |
| SOUTH ST | 44 |
| OAK ST | 42 |
| 7TH ST | 40 |
| VINE ST | 40 |
| MAXWELL AVE | 38 |
| 1ST ST | 36 |
| 6TH ST | 36 |
| COSBY RD | 34 |
| 3RD ST | 32 |
| VINCENNES AVE | 32 |
| CHERRY TREE PLZ | 30 |
| 16TH ST | 28 |
| NORTH ST | 26 |
| MILL ST | 24 |
| OGDON ST | 22 |
| 21ST ST | 20 |
| 100 CR | 18 |
| BRETT CABLE RD | 18 |
| JAMESTOWN CT | 18 |
| STATE ROAD 57 HWY | 18 |
2002 - 2017 National Fire Incident Reporting System (NFIRS) incidents
- Incident types reported to NFIRS in Washington, IN
- 1,56331.2%Rescue & EMS
- 1,42528.5%Fire
- 68813.7%Hazardous Condition
- 4839.7%Service Call
- 4468.9%Good Intent Call
- 3797.6%False Alarm
- 100.2%Special Incident
- 90.2%Overpressure Rupture
- Fire incident types reported to NFIRS in Washington, IN
- 74352.1%Structure Fires
- 38527.0%Outside Fires
- 25017.5%Mobile Property/Vehicle Fires
- 473.3%Other
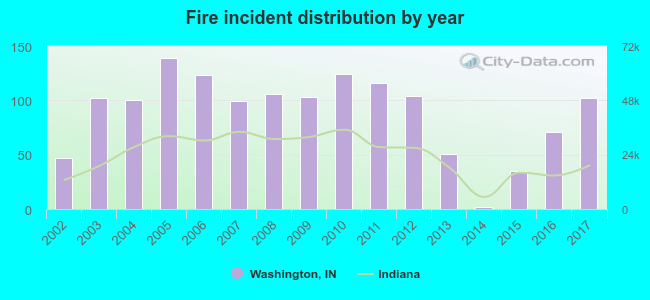 Based on the data from the years 2002 - 2017 the average number of fire incidents per year is 89. The highest number of fire incidents - 139 took place in 2005, and the least - 2 in 2014. The data has an increasing trend.
The average number of yearly fire incidents per 10k residents in Washington, IN compared to nearest cities:
(Note: Based on data for the last 3 years, including only cities with population 5,000 and above)
| Washington: | 48.3 |
| Vincennes: | 35.5 |
| Jasper: | 16.7 |
| Linton: | 11.3 |
| Huntingburg: | 22.6 |
| Princeton: | 8.7 |
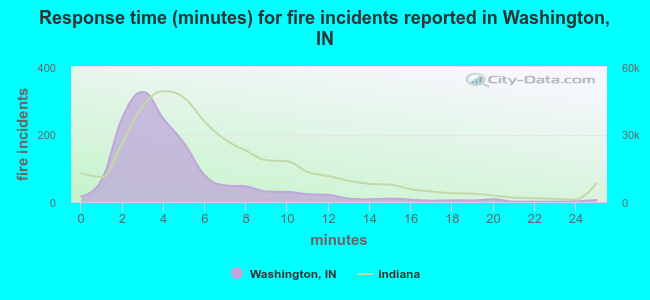 The median response time based on all reported fire incidents is 4 minutes. This is lower than the Indiana median value.
The median response time in Washington, IN compared to nearest cities:
(Note: Based on data for all years, including only cities with at least 500 fire incidents)
| Washington: | 4 minutes |
| Petersburg: | 10 minutes |
| Vincennes: | 3 minutes |
| Jasper: | 5 minutes |
| Oakland City: | 5 minutes |
| Linton: | 5 minutes |
| Lawrenceville: | 10 minutes |
| Bloomfield: | 10 minutes |
| Princeton: | 4 minutes |
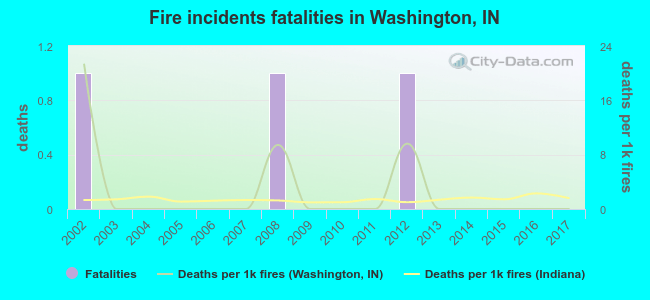 According to the reports from the years 2002 - 2017 the average number of fire-related yearly deaths is 0. The highest number of reported deaths - 1 took place in 2002, and the lowest - 0 in 2003. The data has a declining trend.
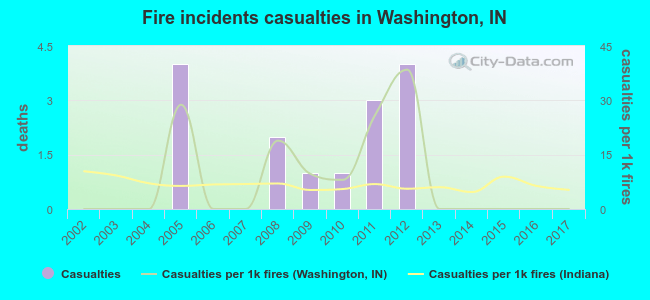 Based on the data from the years 2002 - 2017 the average number of fire-related casualties per year is 1. The highest number of injuries - 4 took place in 2005, and the lowest - 0 in 2002. The data has a constant trend.
The average number of injuries per 1,000 fires is 8. This indicator was the highest - 38 in 2012, and the lowest 0 in 2002. The trend for casualties per 1,000 incidents is constant. Compared to the state value the number of injuries per 1,000 fire incidents is higher.
Based on the data from the years 2002 - 2017 the average number of fire-related casualties per year is 1. The highest number of injuries - 4 took place in 2005, and the lowest - 0 in 2002. The data has a constant trend.
The average number of injuries per 1,000 fires is 8. This indicator was the highest - 38 in 2012, and the lowest 0 in 2002. The trend for casualties per 1,000 incidents is constant. Compared to the state value the number of injuries per 1,000 fire incidents is higher.Casualties per 1,000 incidents in Washington, IN compared to nearest cities:
(Note: Based on data for all years, including only cities with at least 500 fire incidents)
| Washington: | 10.5 |
| Petersburg: | 5.3 |
| Vincennes: | 13.1 |
| Jasper: | 0.0 |
| Oakland City: | 0.0 |
| Linton: | 10.4 |
| Lawrenceville: | 2.2 |
| Bloomfield: | 1.7 |
| Princeton: | 15.7 |
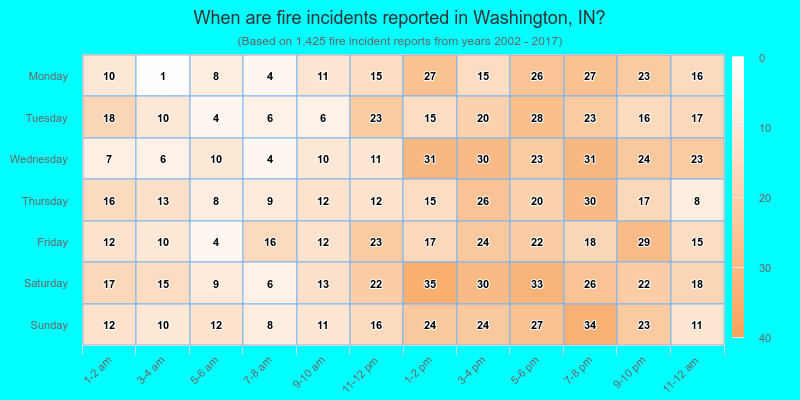
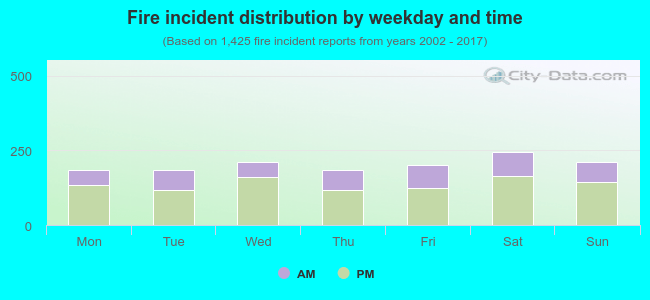 32.4% incidents where reported in the morning and 67.6% in the evening. The most fires (17.3%) took place on Saturday, and the least (12.8%) on Monday.
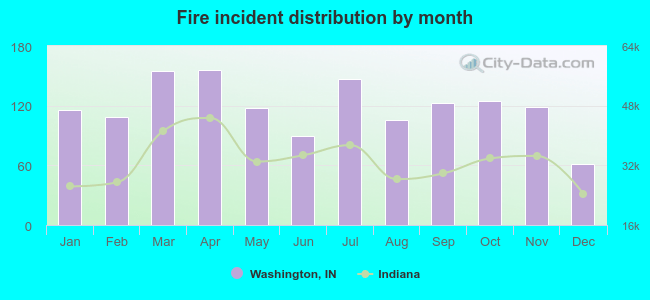 Based on the 1,425 incident reports from years 2002 - 2017 most fires (10.9%) took place during April, and the least (4.3%) in December.
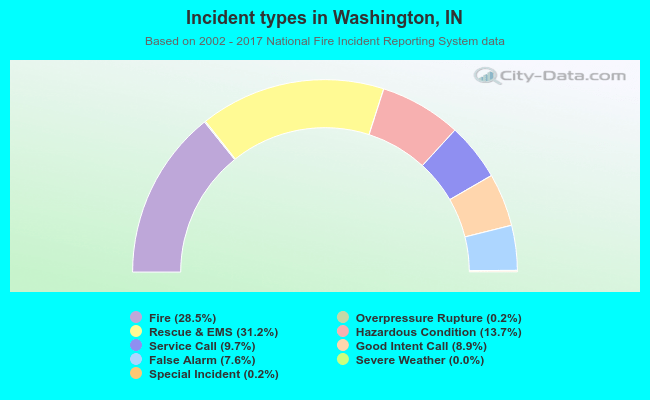 Out of all 5,005 cases reported during the years 2002 - 2017, the most belonged to the categories: Rescue & EMS (31.2%), Fire (28.5%), and Hazardous Condition (13.7%).
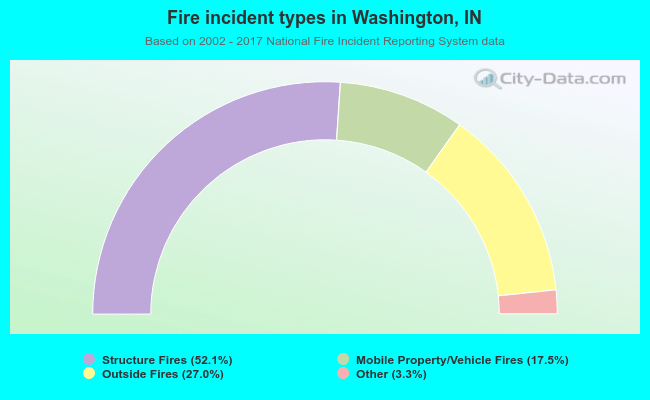 When looking into fire subcategories, the most reports belonged to: Structure Fires (52.1%), and Outside Fires (27.0%).