Watertown: Fire Incidents, Wisconsin (WI)
Where are fire incidents reported in Watertown, WI
Something went wrong! Please refresh the page.
| Fire incidents reported | |
|---|---|
| Sreet name | Count |
| MAIN ST | 70 |
| SECOND ST | 66 |
| BOUGHTON ST | 46 |
| WATER ST | 38 |
| FOURTH ST | 36 |
| DIVISION ST | 34 |
| PROVIMI RD | 34 |
| CADY ST | 32 |
| THIRD ST | 32 |
| CENTER ST | 28 |
| MAIN 100-1434 ST | 28 |
| COUNTY ROAD MM | 26 |
| CHURCH ST | 24 |
| COUNTY ROAD R | 24 |
| PROVIMI ROAD | 24 |
| COUNTY ROAD E | 22 |
| DAVIDSON RD | 20 |
| HOSPITAL DR | 20 |
| LABAREE ST | 20 |
| MAIN 100-836 ST | 20 |
| COUNTY ROAD O | 18 |
| HIGHWAY 19 HWY | 18 |
| WASHINGTON ST | 18 |
| 6TH ST | 16 |
| FREMONT ST | 16 |
| GARDEN RD | 16 |
| MONROE ST | 16 |
| RIVER DR | 16 |
| RUBIDELL RD | 16 |
| SIXTH ST | 16 |
| Other | 760 |
2002 - 2018 National Fire Incident Reporting System (NFIRS) incidents
- Incident types reported to NFIRS in Watertown, WI
- 8,61462.3%Rescue & EMS
- 1,57011.4%Fire
- 1,51611.0%Hazardous Condition
- 1,1118.0%Service Call
- 6214.5%False Alarm
- 3422.5%Good Intent Call
- 400.3%Special Incident
- Fire incident types reported to NFIRS in Watertown, WI
- 69043.9%Structure Fires
- 53233.9%Outside Fires
- 17511.1%Mobile Property/Vehicle Fires
- 17311.0%Other
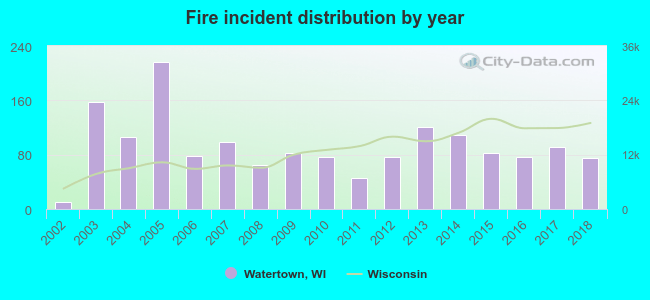 Based on the data from the years 2002 - 2018 the average number of fire incidents per year is 92. The highest number of reported fires - 217 took place in 2005, and the least - 11 in 2002. The data has a rising trend.
The average number of yearly fire incidents per 10k residents in Watertown, WI compared to nearest cities:
(Note: Based on data for the last 3 years, including only cities with population 5,000 and above)
| Watertown: | 33.9 |
| Lake Mills: | 34.6 |
| Oconomowoc: | 68.8 |
| Jefferson: | 38.1 |
| Delafield: | 49.3 |
| Beaver Dam: | 47.6 |
| Fort Atkinson: | 33.5 |
| Hartford: | 44.6 |
| Hartland: | 55.8 |
 The median response time based on all reported fire incidents is 7 minutes. This is about the same as the Wisconsin median value.
The median response time in Watertown, WI compared to nearest cities:
(Note: Based on data for all years, including only cities with at least 500 fire incidents)
| Watertown: | 7 minutes |
| Oconomowoc: | 10 minutes |
| Beaver Dam: | 8 minutes |
| Fort Atkinson: | 8 minutes |
| Hartford: | 8 minutes |
| Hartland: | 9 minutes |
| Whitewater: | 11 minutes |
| Pewaukee: | 8 minutes |
| Sun Prairie: | 8 minutes |
 Based on the data from the years 2002 - 2018 the average number of fire-related fatalities per year is 0. The highest number of reported deaths - 1 took place in 2008, and the lowest - 0 in 2002. The data has a growing trend.
 Based on the data from the years 2002 - 2018 the average number of fire-related yearly casualties is 2. The highest number of injuries - 8 took place in 2013, and the lowest - 0 in 2002. The data has a rising trend.
The average number of casualties per 1,000 fires is 16. This indicator was the highest - 66 in 2013, and the lowest 0 in 2002. The trend for casualties per 1,000 incidents is increasing. Compared to the state value the number of injuries per 1,000 incidents is higher.
Based on the data from the years 2002 - 2018 the average number of fire-related yearly casualties is 2. The highest number of injuries - 8 took place in 2013, and the lowest - 0 in 2002. The data has a rising trend.
The average number of casualties per 1,000 fires is 16. This indicator was the highest - 66 in 2013, and the lowest 0 in 2002. The trend for casualties per 1,000 incidents is increasing. Compared to the state value the number of injuries per 1,000 incidents is higher.Casualties per 1,000 incidents in Watertown, WI compared to nearest cities:
(Note: Based on data for all years, including only cities with at least 500 fire incidents)
| Watertown: | 18.5 |
| Oconomowoc: | 4.0 |
| Beaver Dam: | 40.5 |
| Fort Atkinson: | 1.8 |
| Hartford: | 15.0 |
| Hartland: | 3.8 |
| Whitewater: | 3.8 |
| Pewaukee: | 16.7 |
| Sun Prairie: | 4.0 |
 35.0% incidents where reported in the morning and 65.0% in the evening. The most fires (16.9%) took place on Saturday, and the least (13.0%) on Thursday.
 According to the 1,570 incident reports from years 2002 - 2018 most fires (16.0%) took place during April, and the least (5.1%) in February.
 Out of all 13,829 cases reported during the years 2002 - 2018, the most belonged to the categories: Rescue & EMS (62.3%), Fire (11.4%), and Hazardous Condition (11.0%).
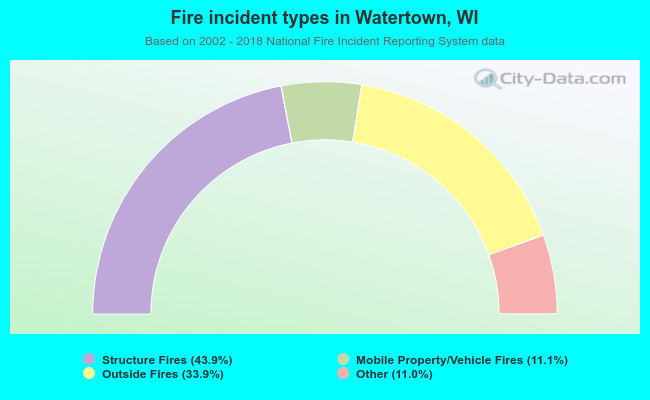 When looking into fire subcategories, the most incidents belonged to: Structure Fires (43.9%), and Outside Fires (33.9%).