Sun Prairie: Fire Incidents, Wisconsin (WI)
Where are fire incidents reported in Sun Prairie, WI
Something went wrong! Please refresh the page.
| Fire incidents reported | |
|---|---|
| Sreet name | Count |
| MAIN ST | 96 |
| BIRD ST | 66 |
| USH 151 | 62 |
| CTH N | 60 |
| SUNFIELD ST | 60 |
| BRISTOL ST | 42 |
| CTH TT | 42 |
| SCHILLER ST | 40 |
| HOEPKER RD | 34 |
| SH 19 | 34 |
| CTH V | 32 |
| PARK CIR | 32 |
| PORTAGE RD | 32 |
| BAILEY RD | 28 |
| LINNERUD DR | 26 |
| HAPPY VALLEY RD | 24 |
| ACKER RD | 22 |
| FELLAND RD | 22 |
| USH 51 | 22 |
| WINDSOR ST | 22 |
| COLUMBUS ST | 20 |
| CTH T | 20 |
| GRAND AVE | 20 |
| PACKERS AVE | 20 |
| REINER RD | 20 |
| WILBURN RD | 20 |
| WYOMING AVE | 20 |
| I-90/94 | 18 |
| CTH VV | 16 |
| EMERALD TER | 16 |
| Other | 275 |
2002 - 2018 National Fire Incident Reporting System (NFIRS) incidents
- Incident types reported to NFIRS in Sun Prairie, WI
- 2,49628.4%Rescue & EMS
- 2,27425.9%Hazardous Condition
- 1,26314.4%Fire
- 1,03911.8%Good Intent Call
- 95810.9%False Alarm
- 6547.4%Service Call
- 750.9%Overpressure Rupture
- 110.1%Special Incident
- 90.1%Severe Weather
- Fire incident types reported to NFIRS in Sun Prairie, WI
- 46036.4%Structure Fires
- 39731.4%Outside Fires
- 23718.8%Mobile Property/Vehicle Fires
- 16913.4%Other
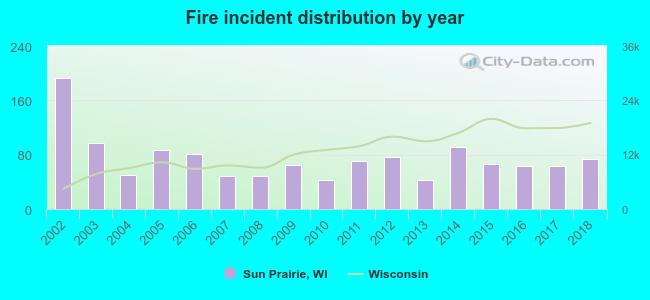 According to the data from the years 2002 - 2018 the average number of fire incidents per year is 74. The highest number of fire incidents - 193 took place in 2002, and the least - 43 in 2010. The data has a declining trend.
The average number of yearly fire incidents per 10k residents in Sun Prairie, WI compared to nearest cities:
(Note: Based on data for the last 3 years, including only cities with population 5,000 and above)
| Sun Prairie: | 21.2 |
| DeForest: | 5.3 |
| Cottage Grove: | 45.0 |
| Monona: | 25.4 |
| Waunakee: | 17.1 |
| Madison: | 8.6 |
| McFarland: | 33.0 |
| Middleton: | 24.1 |
| Fitchburg: | 33.1 |
 The median response time based on all reported fire incidents is 8 minutes. This is about the same as the Wisconsin median value.
 Based on the reports from the years 2002 - 2018 the average number of fire-related casualties per year is 0. The highest number of injuries - 2 took place in 2016, and the lowest - 0 in 2002. The data has a constant trend.
The average number of injuries per 1,000 fires is 5. This indicator was the highest - 31 in 2016, and the lowest 0 in 2002. The trend for casualties per 1,000 fires is constant. Compared to the state value the number of injuries per 1,000 fire incidents is much lower.
Based on the reports from the years 2002 - 2018 the average number of fire-related casualties per year is 0. The highest number of injuries - 2 took place in 2016, and the lowest - 0 in 2002. The data has a constant trend.
The average number of injuries per 1,000 fires is 5. This indicator was the highest - 31 in 2016, and the lowest 0 in 2002. The trend for casualties per 1,000 fires is constant. Compared to the state value the number of injuries per 1,000 fire incidents is much lower.
 31.2% incidents where reported in the morning and 68.8% in the evening. The most fires (16.2%) took place on Saturday, and the least (12.7%) on Friday.
 Based on the 1,263 incident reports from years 2002 - 2018 most fires (13.3%) took place during April, and the least (6.2%) in October.
 Out of all 8,779 cases reported during the years 2002 - 2018, the most belonged to the categories: Rescue & EMS (28.4%), Hazardous Condition (25.9%), and Fire (14.4%).
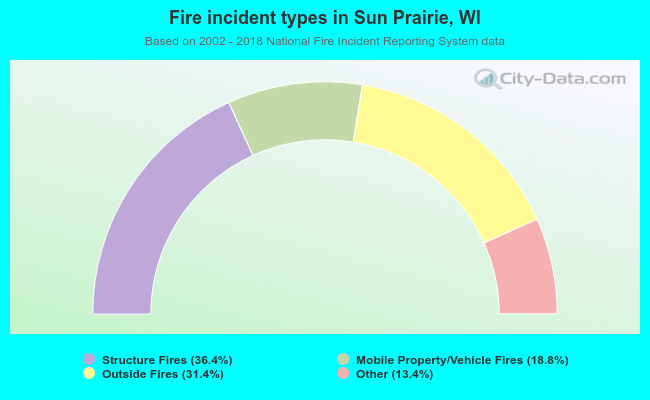 When looking into fire subcategories, the most reports belonged to: Structure Fires (36.4%), and Outside Fires (31.4%).