Waunakee: Fire Incidents, Wisconsin (WI)
Where are fire incidents reported in Waunakee, WI
Something went wrong! Please refresh the page.
|
| |||||||||||||||||||||||||||||||||||||||||||||||||||||||||||||||||||||||||||||||||||||||||||||||||||||||||||||
2002 - 2018 National Fire Incident Reporting System (NFIRS) incidents
- Incident types reported to NFIRS in Waunakee, WI
- 58434.3%Rescue & EMS
- 34220.1%Good Intent Call
- 22313.1%Fire
- 21212.4%False Alarm
- 19211.3%Hazardous Condition
- 1488.7%Service Call
- 20.1%Severe Weather
- Fire incident types reported to NFIRS in Waunakee, WI
- 14565.0%Structure Fires
- 4218.8%Outside Fires
- 2511.2%Mobile Property/Vehicle Fires
- 114.9%Other
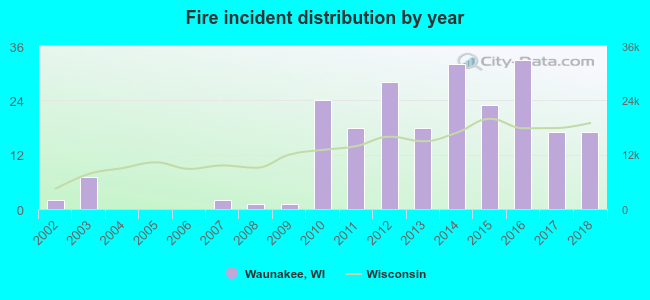 Based on the data from the years 2002 - 2018 the average number of fire incidents per year is 13. The highest number of reported fires - 33 took place in 2016, and the least - 0 in 2004. The data has a rising trend.
The average number of yearly fire incidents per 10k residents in Waunakee, WI compared to nearest cities:
(Note: Based on data for the last 3 years, including only cities with population 5,000 and above)
| Waunakee: | 17.1 |
| Middleton: | 24.1 |
| DeForest: | 5.3 |
| Madison: | 8.6 |
| Monona: | 25.4 |
| Sun Prairie: | 21.2 |
| Fitchburg: | 33.1 |
| McFarland: | 33.0 |
| Verona: | 27.8 |

 32.7% incidents where reported in the morning and 67.3% in the evening. The most fires (16.6%) took place on Monday, and the least (10.8%) on Friday.
 Based on the 223 fire incidents from years 2002 - 2018 most fires (13.0%) took place during August, and the least (4.0%) in November.
 Out of all 1,704 cases reported during the years 2002 - 2018, the most belonged to the categories: Overpressure Rupture (34.3%), Service Call (20.1%), and Fire (13.1%).
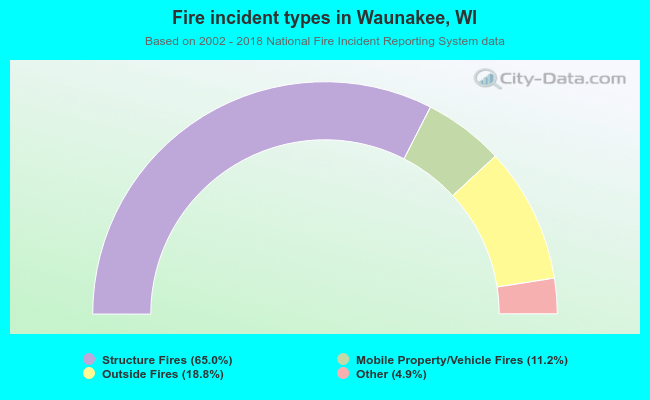 When looking into fire subcategories, the most incidents belonged to: Structure Fires (65.0%), and Outside Fires (18.8%).