Waxahachie: Fire Incidents, Texas (TX)
Where are fire incidents reported in Waxahachie, TX
Something went wrong! Please refresh the page.
| Fire incidents reported | |
|---|---|
| Sreet name | Count |
| IH 35 HWY | 636 |
| US 287 BYPASS LOOP | 412 |
| US 77 HWY | 322 |
| US 287 BUS HWY | 116 |
| MAIN ST | 94 |
| BROWN ST | 84 |
| OVILLA RD | 82 |
| 35 | 78 |
| HOWARD RD | 76 |
| FERRIS AVE | 64 |
| JEFFERSON ST | 62 |
| PARK SCHOOL HOUSE RD | 62 |
| 77 | 58 |
| SOLON RD | 58 |
| GRAND AVE | 56 |
| GETZENDANER AVE | 48 |
| MARVIN AVE | 48 |
| 287 BYP | 44 |
| BROADHEAD RD | 38 |
| WYATT ST | 36 |
| COLLEGE ST | 34 |
| ROGERS ST | 34 |
| SOLON PLACE WAY | 34 |
| HENRY ST | 32 |
| PETERS ST | 32 |
| FM 66 | 30 |
| ROSS ST | 30 |
| CANTRELL ST | 28 |
| JOHN ARDEN DR | 28 |
| SYCAMORE ST | 28 |
| Other | 373 |
2002 - 2018 National Fire Incident Reporting System (NFIRS) incidents
- Incident types reported to NFIRS in Waxahachie, TX
- 13,80152.2%Rescue & EMS
- 3,15711.9%Fire
- 3,08211.6%Service Call
- 2,5739.7%Hazardous Condition
- 2,1968.3%False Alarm
- 1,5725.9%Good Intent Call
- 320.1%Overpressure Rupture
- 310.1%Special Incident
- Fire incident types reported to NFIRS in Waxahachie, TX
- 1,61851.3%Outside Fires
- 90528.7%Structure Fires
- 49815.8%Mobile Property/Vehicle Fires
- 1364.3%Other
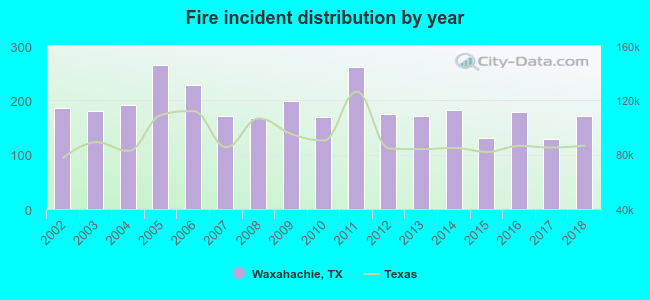 Based on the data from the years 2002 - 2018 the average number of fires per year is 186. The highest number of reported fire incidents - 265 took place in 2005, and the least - 128 in 2017. The data has a declining trend.
The average number of yearly fire incidents per 10k residents in Waxahachie, TX compared to nearest cities:
(Note: Based on data for the last 3 years, including only cities with population 5,000 and above)
| Waxahachie: | 49.2 |
| Red Oak: | 70.4 |
| Midlothian: | 68.0 |
| Glenn Heights: | 40.3 |
| DeSoto: | 30.4 |
| Ennis: | 63.0 |
| Cedar Hill: | 34.2 |
| Lancaster: | 43.2 |
| Duncanville: | 46.6 |
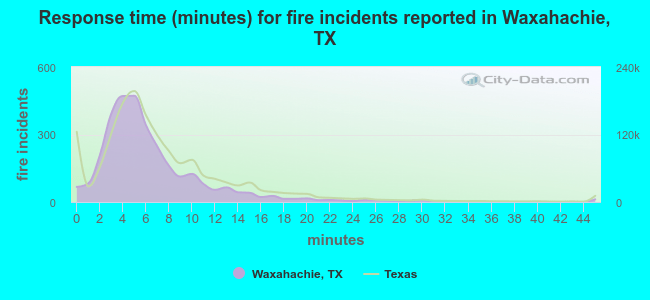 The median response time based on all reported fire incidents is 5 minutes. This is lower than the state median value.
The median response time in Waxahachie, TX compared to nearest cities:
(Note: Based on data for all years, including only cities with at least 500 fire incidents)
| Waxahachie: | 5 minutes |
| Red Oak: | 6 minutes |
| Midlothian: | 8 minutes |
| Glenn Heights: | 5 minutes |
| DeSoto: | 6 minutes |
| Ennis: | 5 minutes |
| Ferris: | 10 minutes |
| Cedar Hill: | 6 minutes |
| Lancaster: | 6 minutes |
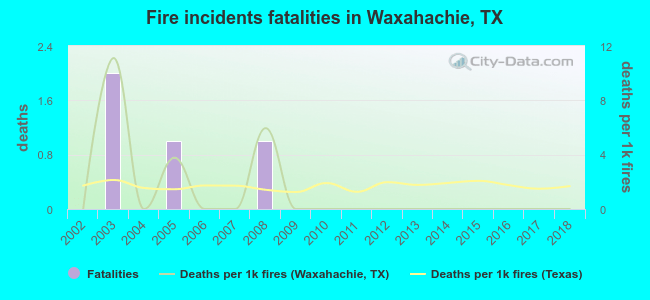 According to the reports from the years 2002 - 2018 the average number of fire-related yearly deaths is 0. The highest number of deaths - 2 took place in 2003, and the lowest - 0 in 2002. The data has a constant trend.
The average number of deaths per 1,000 fires is 1. This indicator was the highest - 11 in 2003, and the lowest 0 in 2002. The trend for deaths per 1,000 fires is constant. Compared to the Texas value the number of fatalities per 1,000 incidents is lower.
According to the reports from the years 2002 - 2018 the average number of fire-related yearly deaths is 0. The highest number of deaths - 2 took place in 2003, and the lowest - 0 in 2002. The data has a constant trend.
The average number of deaths per 1,000 fires is 1. This indicator was the highest - 11 in 2003, and the lowest 0 in 2002. The trend for deaths per 1,000 fires is constant. Compared to the Texas value the number of fatalities per 1,000 incidents is lower.Deaths per 1,000 incidents in Waxahachie, TX compared to nearest cities:
(Note: Based on data for all years, including only cities with at least 2,500 fire incidents)
| Waxahachie: | 1.3 |
| Midlothian: | 1.5 |
| DeSoto: | 0.6 |
| Ennis: | 1.1 |
| Cedar Hill: | 1.3 |
| Lancaster: | 1.9 |
| Duncanville: | 0.8 |
| Mansfield: | 0.7 |
| Alvarado: | 0.8 |
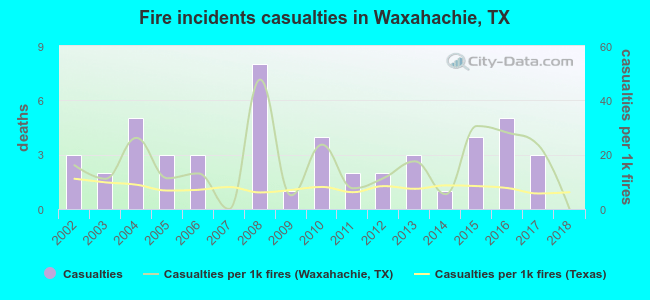 According to the data from the years 2002 - 2018 the average number of fire-related casualties per year is 3. The highest number of injuries - 8 took place in 2008, and the lowest - 0 in 2007. The data has a declining trend.
The average number of injuries per 1,000 fires is 16. This indicator was the highest - 48 in 2008, and the lowest 0 in 2007. The trend for casualties per 1,000 fires is decreasing. Compared to the state value the number of injuries per 1,000 incidents is much higher.
According to the data from the years 2002 - 2018 the average number of fire-related casualties per year is 3. The highest number of injuries - 8 took place in 2008, and the lowest - 0 in 2007. The data has a declining trend.
The average number of injuries per 1,000 fires is 16. This indicator was the highest - 48 in 2008, and the lowest 0 in 2007. The trend for casualties per 1,000 fires is decreasing. Compared to the state value the number of injuries per 1,000 incidents is much higher.Casualties per 1,000 incidents in Waxahachie, TX compared to nearest cities:
(Note: Based on data for all years, including only cities with at least 500 fire incidents)
| Waxahachie: | 15.5 |
| Red Oak: | 5.3 |
| Midlothian: | 12.3 |
| Glenn Heights: | 13.0 |
| DeSoto: | 15.3 |
| Ennis: | 7.5 |
| Ferris: | 8.9 |
| Cedar Hill: | 13.7 |
| Lancaster: | 15.5 |
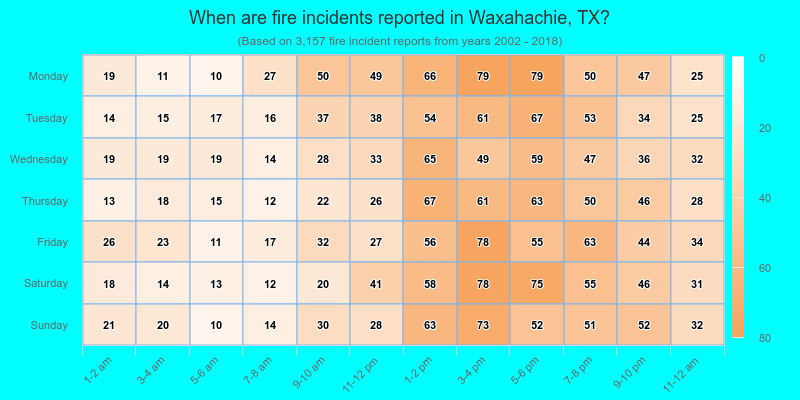
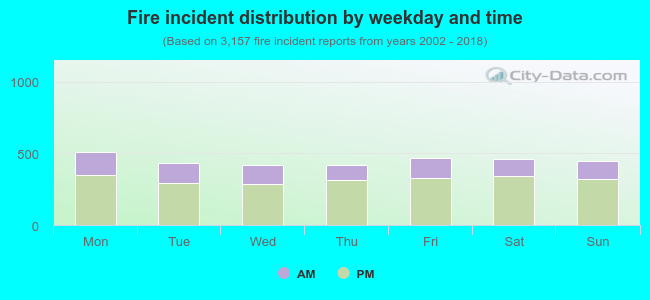 29.1% incidents where reported in the morning and 70.9% in the evening. The most fires (16.2%) took place on Monday, and the least (13.3%) on Wednesday.
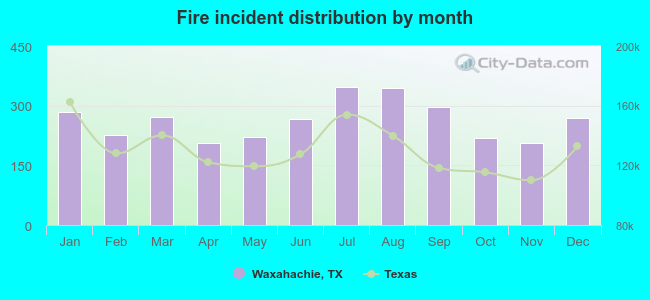 Based on the 3,157 fires from years 2002 - 2018 most fires (11.0%) took place during July, and the least (6.5%) in April.
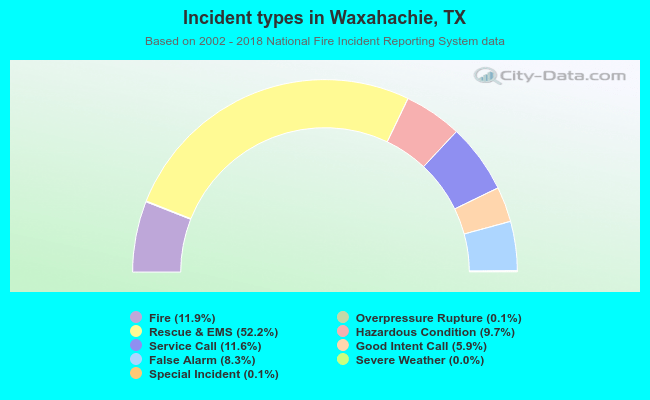 Out of all 26,455 cases reported during the years 2002 - 2018, the most belonged to the categories: Rescue & EMS (52.2%), Fire (11.9%), and Service Call (11.6%).
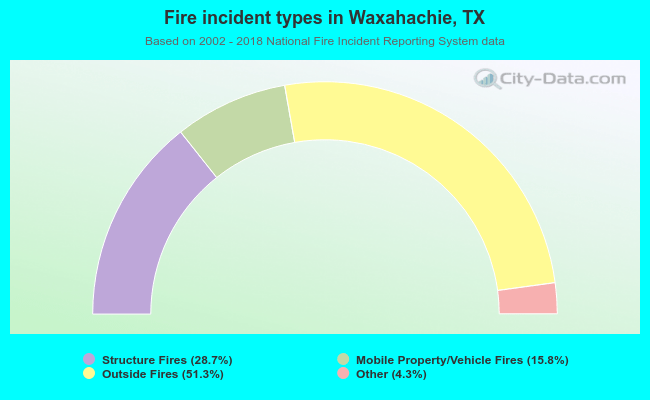 When looking into fire subcategories, the most reports belonged to: Outside Fires (51.3%), and Structure Fires (28.7%).