Ennis: Fire Incidents, Texas (TX)
Where are fire incidents reported in Ennis, TX
Something went wrong! Please refresh the page.
| Fire incidents reported | |
|---|---|
| Sreet name | Count |
| ENNIS AVE | 170 |
| IH 45 | 130 |
| KAUFMAN ST | 82 |
| FM 1181 | 72 |
| FM 660 | 70 |
| FM 879 | 66 |
| FM 85 | 58 |
| HWY 34 | 50 |
| ENSIGN RD | 48 |
| INTERSTATE 45 | 48 |
| I-45 | 46 |
| LAKE BARDWELL DR | 46 |
| KAUFMAN | 44 |
| MAIN ST | 38 |
| CHRISTIAN RD | 36 |
| LAKE BARDWELL | 36 |
| MILAM ST | 36 |
| FM 1182 | 34 |
| HWY 85 | 34 |
| SPUR 469 | 34 |
| LAMPASAS ST | 32 |
| MCKINNEY ST | 32 |
| PRESTON ST | 32 |
| SLATE ROCK RD | 32 |
| CRISP RD | 30 |
| FM 1722 | 30 |
| STACKS RD | 30 |
| GRACE CIR | 28 |
| EASON RD | 26 |
| BROWN ST | 24 |
| Other | 1,188 |
2002 - 2018 National Fire Incident Reporting System (NFIRS) incidents
- Incident types reported to NFIRS in Ennis, TX
- 6,28443.1%Rescue & EMS
- 2,66218.3%Fire
- 2,25315.5%Service Call
- 1,74512.0%Hazardous Condition
- 8325.7%Good Intent Call
- 6924.7%False Alarm
- 490.3%Overpressure Rupture
- 490.3%Special Incident
- Fire incident types reported to NFIRS in Ennis, TX
- 1,38952.2%Outside Fires
- 68425.7%Structure Fires
- 41615.6%Mobile Property/Vehicle Fires
- 1736.5%Other
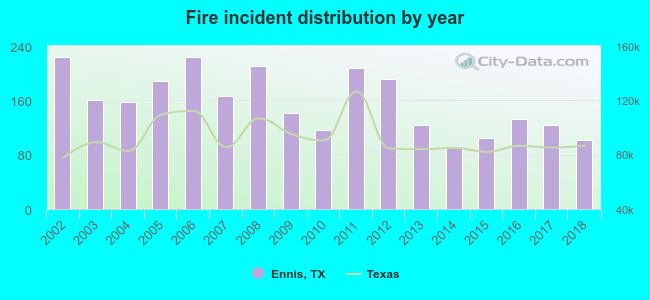 Based on the data from the years 2002 - 2018 the average number of fire incidents per year is 157. The highest number of fires - 224 took place in 2002, and the least - 90 in 2014. The data has a dropping trend.
The average number of yearly fire incidents per 10k residents in Ennis, TX compared to nearest cities:
(Note: Based on data for the last 3 years, including only cities with population 5,000 and above)
| Ennis: | 63.0 |
| Waxahachie: | 49.2 |
| Red Oak: | 70.4 |
| Corsicana: | 63.1 |
| Glenn Heights: | 40.3 |
| Lancaster: | 43.2 |
| Hutchins: | 76.1 |
| Seagoville: | 51.3 |
| DeSoto: | 30.4 |
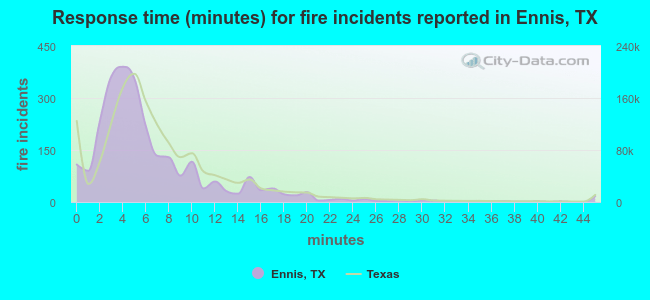 The median response time based on all reported fire incidents is 5 minutes. This is lower compared to the state median value.
The median response time in Ennis, TX compared to nearest cities:
(Note: Based on data for all years, including only cities with at least 500 fire incidents)
| Ennis: | 5 minutes |
| Waxahachie: | 5 minutes |
| Ferris: | 10 minutes |
| Red Oak: | 6 minutes |
| Wilmer: | 6 minutes |
| Corsicana: | 5 minutes |
| Scurry: | 10 minutes |
| Glenn Heights: | 5 minutes |
| Frost: | 10 minutes |
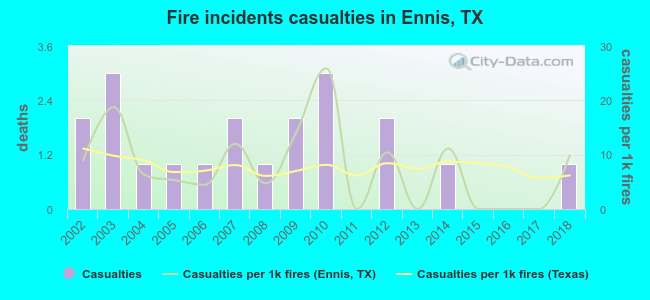 According to the reports from the years 2002 - 2018 the average number of fire-related yearly casualties is 1. The highest number of injuries - 3 took place in 2003, and the lowest - 0 in 2011. The data has a declining trend.
The average number of injuries per 1,000 fire incidents is 8. This indicator was the highest - 26 in 2010, and the lowest 0 in 2011. The trend for injuries per 1,000 fire incidents is increasing. Compared to the Texas value the number of casualties per 1,000 fires is similar.
According to the reports from the years 2002 - 2018 the average number of fire-related yearly casualties is 1. The highest number of injuries - 3 took place in 2003, and the lowest - 0 in 2011. The data has a declining trend.
The average number of injuries per 1,000 fire incidents is 8. This indicator was the highest - 26 in 2010, and the lowest 0 in 2011. The trend for injuries per 1,000 fire incidents is increasing. Compared to the Texas value the number of casualties per 1,000 fires is similar.Casualties per 1,000 incidents in Ennis, TX compared to nearest cities:
(Note: Based on data for all years, including only cities with at least 500 fire incidents)
| Ennis: | 7.5 |
| Waxahachie: | 15.5 |
| Ferris: | 8.9 |
| Red Oak: | 5.3 |
| Wilmer: | 2.1 |
| Corsicana: | 15.7 |
| Scurry: | 0.0 |
| Glenn Heights: | 13.0 |
| Frost: | 0.0 |
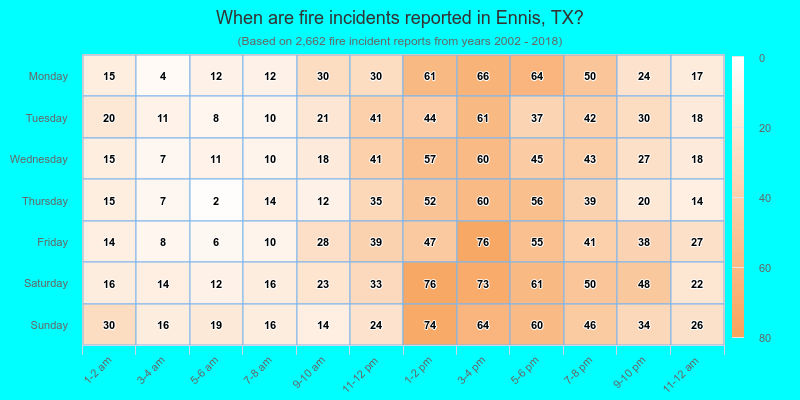
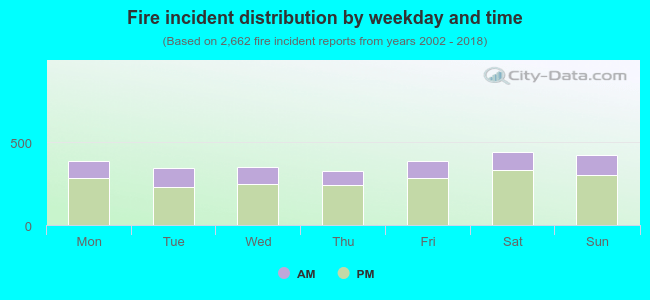 27.8% incidents where reported in the morning and 72.2% in the evening. The most fires (16.7%) took place on Saturday, and the least (12.2%) on Thursday.
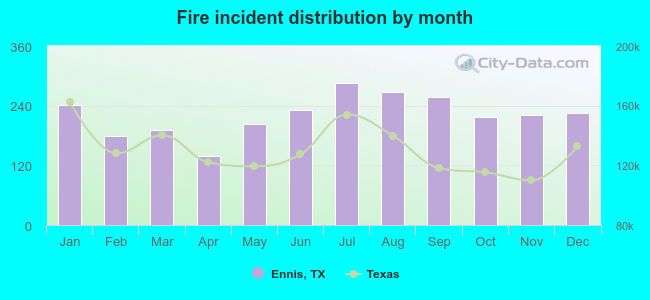 Based on the 2,662 fire incidents from years 2002 - 2018 most fires (10.7%) took place during July, and the least (5.2%) in April.
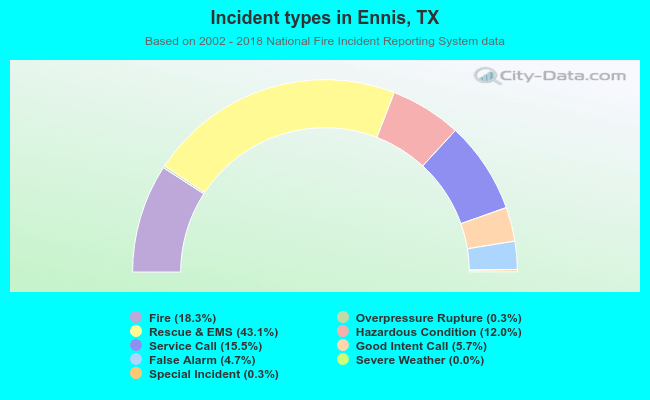 Out of all 14,573 cases reported during the years 2002 - 2018, the most belonged to the categories: Rescue & EMS (43.1%), Fire (18.3%), and Service Call (15.5%).
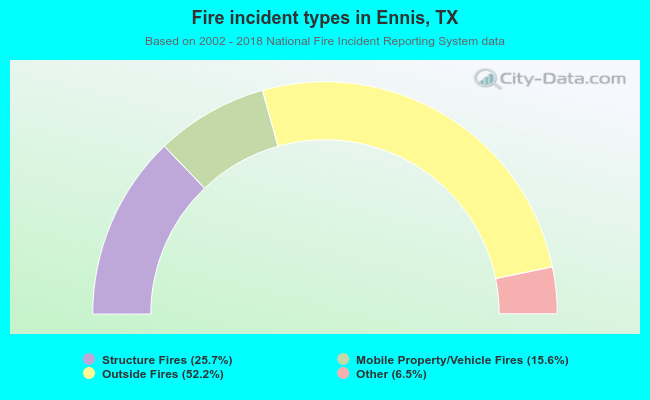 When looking into fire subcategories, the most incidents belonged to: Outside Fires (52.2%), and Structure Fires (25.7%).