Weatherford: Fire Incidents, Oklahoma (OK)
Where are fire incidents reported in Weatherford, OK
Something went wrong! Please refresh the page.
|
| |||||||||||||||||||||||||||||||||||||||||||||||||||||||||||||||||||||||||||||||||||||||||||||||||||||||||||||
| Other | 819 | |||||||||||||||||||||||||||||||||||||||||||||||||||||||||||||||||||||||||||||||||||||||||||||||||||||||||||||
2002 - 2018 National Fire Incident Reporting System (NFIRS) incidents
- Incident types reported to NFIRS in Weatherford, OK
- 2,93550.6%Rescue & EMS
- 1,65328.5%Fire
- 3636.3%False Alarm
- 3596.2%Good Intent Call
- 2965.1%Hazardous Condition
- 1733.0%Service Call
- 110.2%Special Incident
- 80.1%Severe Weather
- Fire incident types reported to NFIRS in Weatherford, OK
- 1,11067.2%Outside Fires
- 31619.1%Structure Fires
- 1509.1%Mobile Property/Vehicle Fires
- 774.7%Other
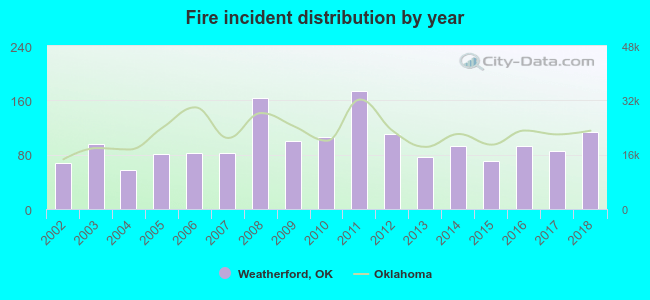 Based on the data from the years 2002 - 2018 the average number of fire incidents per year is 97. The highest number of reported fire incidents - 174 took place in 2011, and the least - 57 in 2004. The data has a growing trend.
The average number of yearly fire incidents per 10k residents in Weatherford, OK compared to nearest cities:
(Note: Based on data for the last 3 years, including only cities with population 5,000 and above)
| Weatherford: | 81.5 |
| Clinton: | 123.1 |
| Anadarko: | 138.8 |
| Elk City: | 89.6 |
| El Reno: | 59.7 |
| Yukon: | 78.8 |
| Tuttle: | 127.4 |
| Piedmont: | 58.9 |
| Chickasha: | 86.1 |
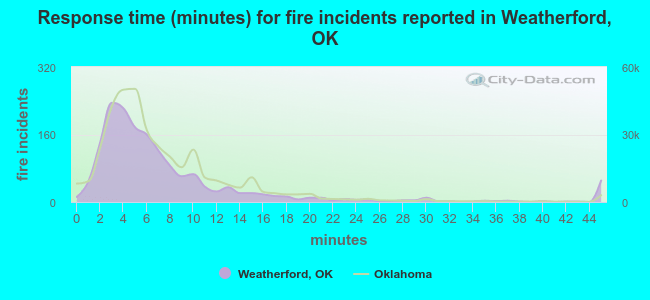 The median response time based on all reported fire incidents is 5 minutes. This is lower than the state median value.
The median response time in Weatherford, OK compared to nearest cities:
(Note: Based on data for all years, including only cities with at least 500 fire incidents)
| Weatherford: | 5 minutes |
| Hydro: | 7 minutes |
| Thomas: | 8 minutes |
| Clinton: | 5 minutes |
| Geary: | 10 minutes |
| Watonga: | 11 minutes |
| Calumet: | 10 minutes |
| Canute: | 9 minutes |
| Anadarko: | 6 minutes |
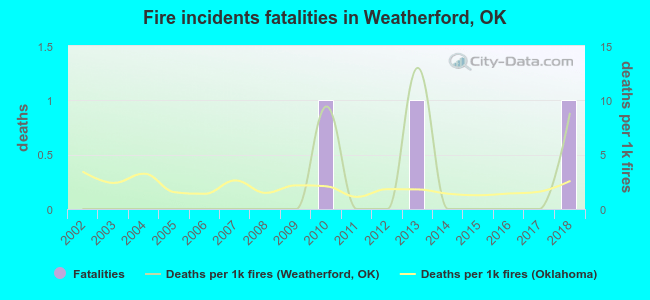 Based on the data from the years 2002 - 2018 the average number of fire-related yearly deaths is 0. The highest number of deaths - 1 took place in 2010, and the lowest - 0 in 2002. The data has an increasing trend.
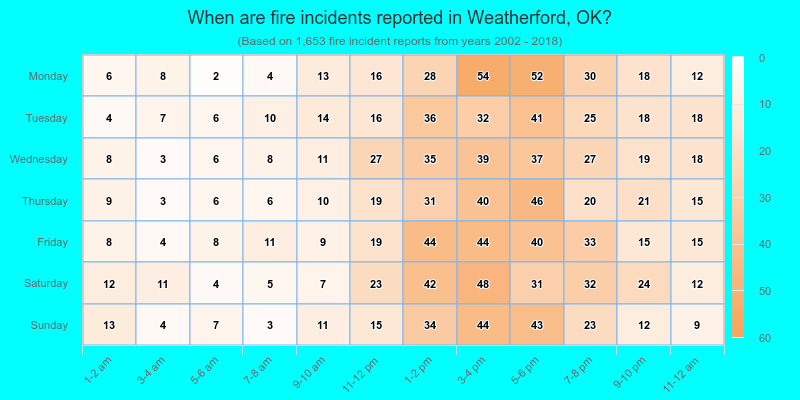
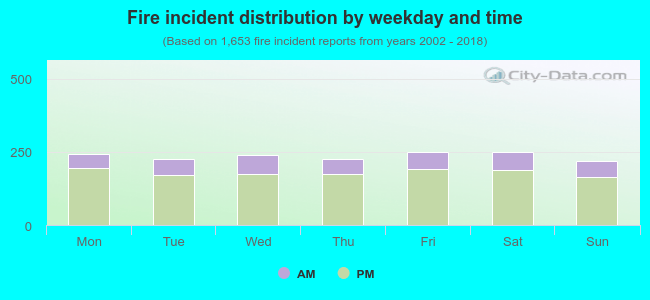 24.0% incidents where reported in the morning and 76.0% in the evening. The most fires (15.2%) took place on Saturday, and the least (13.2%) on Sunday.
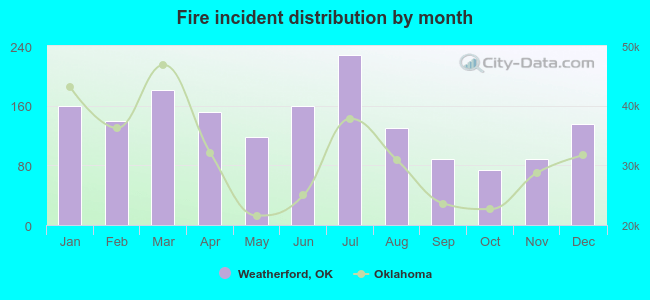 According to the 1,653 reports from years 2002 - 2018 most fires (13.8%) took place during July, and the least (4.5%) in October.
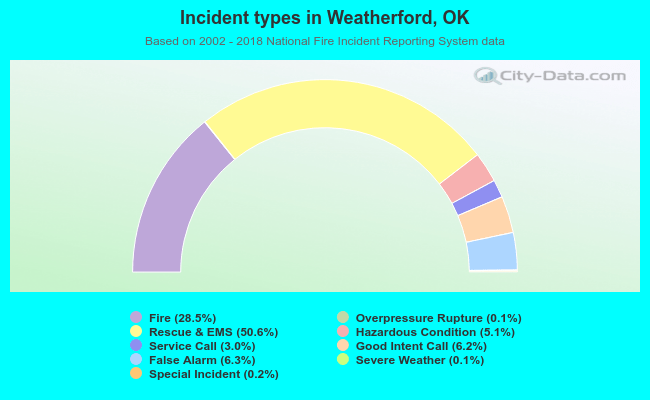 Out of all 5,802 cases reported during the years 2002 - 2018, the most belonged to the categories: Rescue & EMS (50.6%), Fire (28.5%), and False Alarm (6.3%).
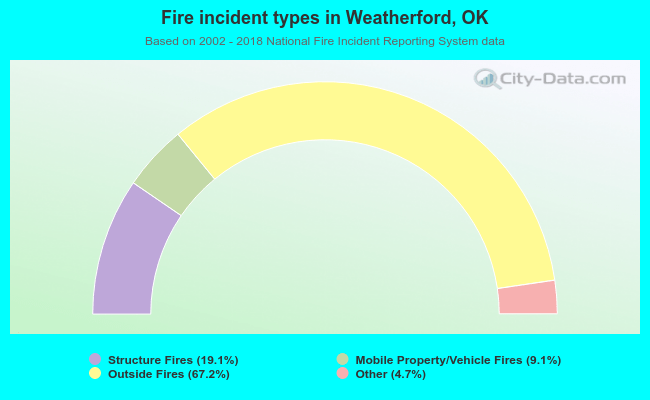 When looking into fire subcategories, the most incidents belonged to: Outside Fires (67.2%), and Structure Fires (19.1%).