Weirton: Fire Incidents, West Virginia (WV)
Where are fire incidents reported in Weirton, WV
Something went wrong! Please refresh the page.
| Fire incidents reported | |
|---|---|
| Sreet name | Count |
| MAIN ST | 250 |
| PENNSYLVANIA AVE | 126 |
| COVE RD | 100 |
| THREE SPRINGS DR | 88 |
| ORCHARD ST | 74 |
| BIRCH DR | 62 |
| COLLIERS WAY | 42 |
| US ROUTE 22 | 34 |
| WEST ST | 34 |
| ELM ST | 32 |
| PENCO RD | 28 |
| FREEDOM WAY | 24 |
| ORCHARD | 22 |
| MAIN | 16 |
| MARLAND HEIGHTS RD | 16 |
| WALL ST | 16 |
| GULLETTE LN | 14 |
| HEATHERMOOR DR | 14 |
| U.S. ROUTE 22 | 14 |
| ELMER AVE | 12 |
| NORTH 10TH ST | 12 |
| NORTH 12TH ST | 12 |
| PENNSYLVANIA AVE | 12 |
| RITCHIE AVE | 12 |
| BEECH RD | 10 |
| BYRON ST | 10 |
| CULLER RD | 10 |
| FREEDOM WAY | 10 |
| GRANT ST | 10 |
| HILLCREST RD | 10 |
| Other | 69 |
2003 - 2018 National Fire Incident Reporting System (NFIRS) incidents
- Incident types reported to NFIRS in Weirton, WV
- 4,41143.6%Rescue & EMS
- 1,83118.1%Hazardous Condition
- 1,40313.9%Good Intent Call
- 1,19511.8%Fire
- 7247.2%False Alarm
- 5035.0%Service Call
- 450.4%Overpressure Rupture
- Fire incident types reported to NFIRS in Weirton, WV
- 56046.9%Structure Fires
- 37131.0%Outside Fires
- 20417.1%Mobile Property/Vehicle Fires
- 605.0%Other
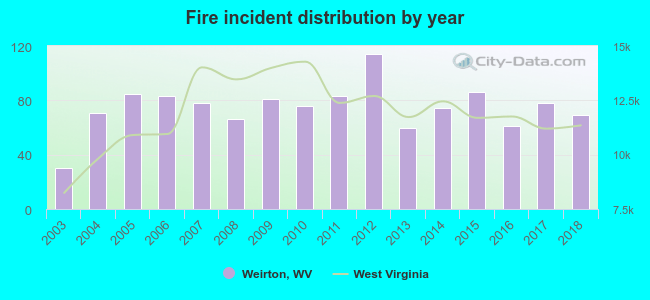 Based on the data from the years 2003 - 2018 the average number of fires per year is 75. The highest number of reported fires - 114 took place in 2012, and the least - 30 in 2003. The data has a growing trend.
The average number of yearly fire incidents per 10k residents in Weirton, WV compared to nearest cities:
(Note: Based on data for the last 3 years, including only cities with population 5,000 and above)
| Weirton: | 35.8 |
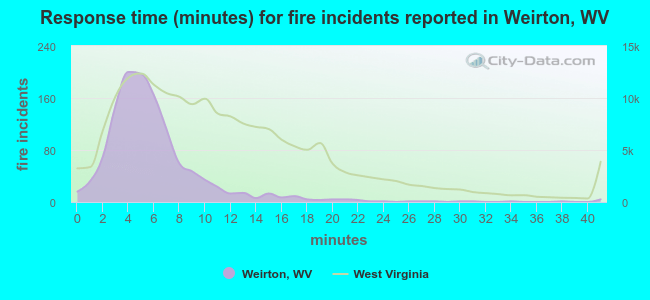 The median response time based on all reported fire incidents is 5 minutes. This is much lower than the West Virginia median value.
The median response time in Weirton, WV compared to nearest cities:
(Note: Based on data for all years, including only cities with at least 500 fire incidents)
| Weirton: | 5 minutes |
| Toronto: | 8 minutes |
| Steubenville: | 3 minutes |
| Follansbee: | 6 minutes |
| Mingo Junction: | 6 minutes |
| New Cumberland: | 12 minutes |
| Wellsburg: | 8 minutes |
| Wellsville: | 6 minutes |
| East Liverpool: | 5 minutes |
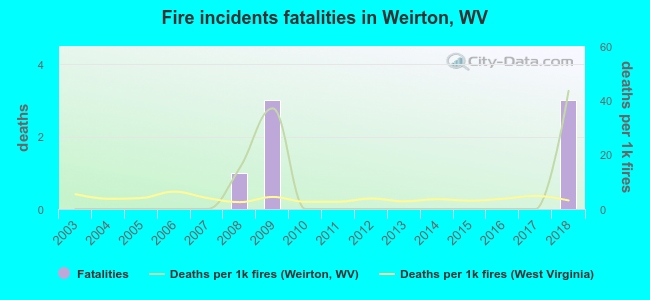 Based on the reports from the years 2003 - 2018 the average number of fire-related yearly deaths is 0. The highest number of reported deaths - 3 took place in 2009, and the lowest - 0 in 2003. The data has a growing trend.
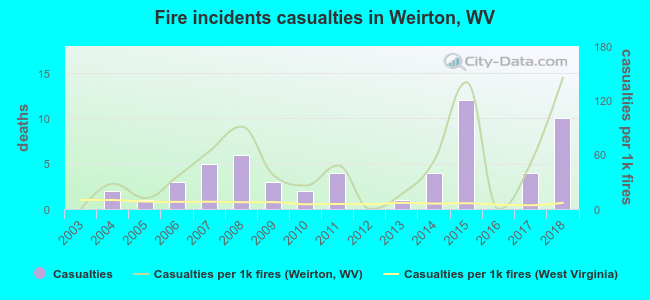 Based on the reports from the years 2003 - 2018 the average number of fire-related yearly casualties is 4. The highest number of injuries - 12 took place in 2015, and the lowest - 0 in 2003. The data has a rising trend.
The average number of casualties per 1,000 fires is 47. This indicator was the highest - 145 in 2018, and the lowest 0 in 2003. The trend for casualties per 1,000 incidents is increasing. Compared to the West Virginia value the number of injuries per 1,000 fire incidents is much higher.
Based on the reports from the years 2003 - 2018 the average number of fire-related yearly casualties is 4. The highest number of injuries - 12 took place in 2015, and the lowest - 0 in 2003. The data has a rising trend.
The average number of casualties per 1,000 fires is 47. This indicator was the highest - 145 in 2018, and the lowest 0 in 2003. The trend for casualties per 1,000 incidents is increasing. Compared to the West Virginia value the number of injuries per 1,000 fire incidents is much higher.Casualties per 1,000 incidents in Weirton, WV compared to nearest cities:
(Note: Based on data for all years, including only cities with at least 500 fire incidents)
| Weirton: | 47.7 |
| Toronto: | 11.2 |
| Steubenville: | 16.9 |
| Follansbee: | 13.8 |
| Mingo Junction: | 40.9 |
| New Cumberland: | 10.1 |
| Wellsburg: | 2.4 |
| Wellsville: | 10.0 |
| East Liverpool: | 8.2 |
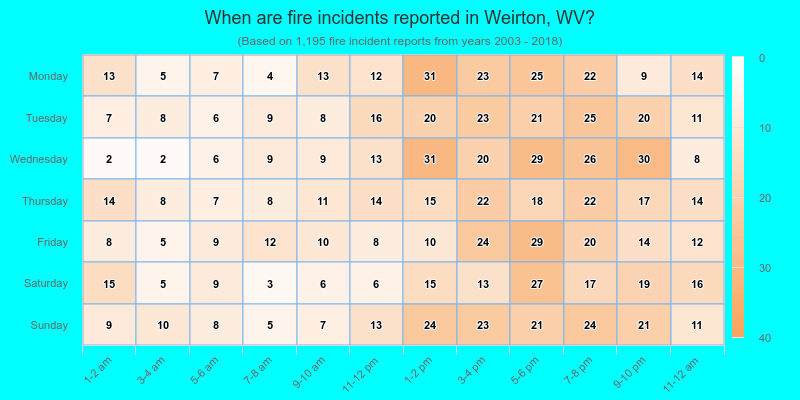
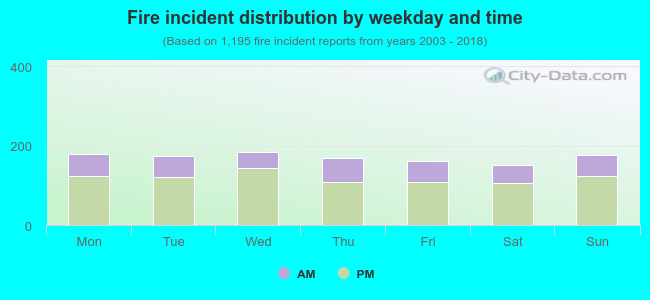 30.0% incidents where reported in the morning and 70.0% in the evening. The most fires (15.5%) took place on Wednesday, and the least (12.6%) on Saturday.
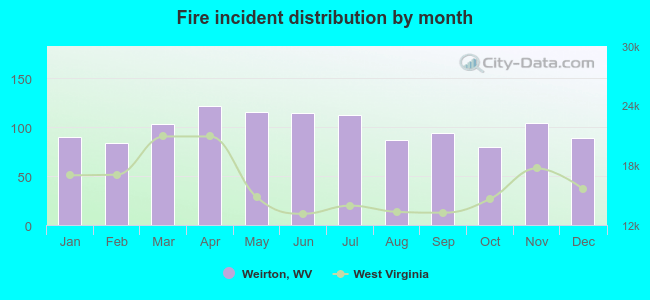 Based on the 1,195 fire incident reports from years 2003 - 2018 most fires (10.2%) took place during April, and the least (6.7%) in October.
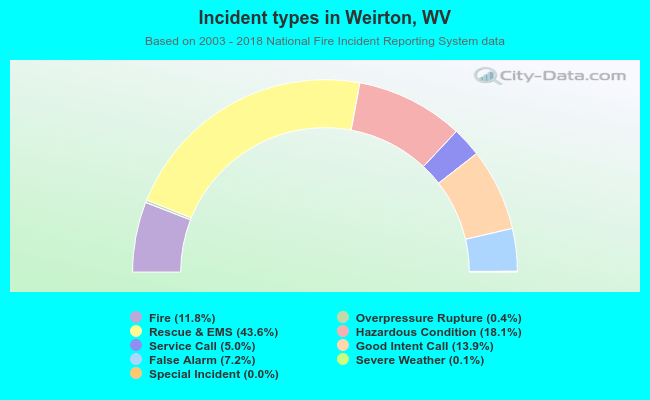 Out of all 10,121 cases reported during the years 2003 - 2018, the most belonged to the categories: Rescue & EMS (43.6%), Hazardous Condition (18.1%), and Good Intent Call (13.9%).
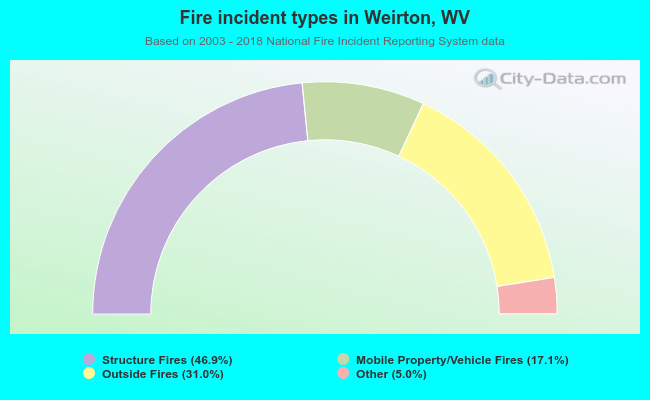 When looking into fire subcategories, the most reports belonged to: Structure Fires (46.9%), and Outside Fires (31.0%).