West Bend: Fire Incidents, Wisconsin (WI)
Where are fire incidents reported in West Bend, WI
Something went wrong! Please refresh the page.
| Fire incidents reported | |
|---|---|
| Sreet name | Count |
| MAIN ST | 118 |
| WASHINGTON ST | 114 |
| PARADISE DR | 80 |
| RIVER RD | 54 |
| DECORAH RD | 50 |
| MAIN | 32 |
| BARTON AVE | 28 |
| SYLVAN WAY | 28 |
| WASHINGTON | 26 |
| WALLACE LAKE RD | 22 |
| EASTERN AVE | 20 |
| ROOSEVELT DR | 20 |
| VOGT DR | 20 |
| BEAVER DAM RD | 18 |
| HWY 33 | 18 |
| INDIANA AVE | 18 |
| KILBOURN AVE | 18 |
| SILVERBROOK DR | 18 |
| STONEBRIDGE RD | 18 |
| 18TH AVE | 16 |
| NEWARK DR | 16 |
| PARADISE | 16 |
| PLEASANT VALLEY RD | 16 |
| STH 144 | 16 |
| USH 45 | 16 |
| 6TH AVE | 14 |
| 8TH AVE | 14 |
| HWY A | 14 |
| MEADOWBROOK DR | 14 |
| ORCHARD VALLEY RD | 14 |
| Other | 440 |
2003 - 2018 National Fire Incident Reporting System (NFIRS) incidents
- Incident types reported to NFIRS in West Bend, WI
- 14,32978.1%Rescue & EMS
- 1,3267.2%Fire
- 1,1276.1%Hazardous Condition
- 8464.6%False Alarm
- 3962.2%Good Intent Call
- 2711.5%Service Call
- 220.1%Special Incident
- 210.1%Overpressure Rupture
- Fire incident types reported to NFIRS in West Bend, WI
- 73655.5%Structure Fires
- 36227.3%Outside Fires
- 17513.2%Mobile Property/Vehicle Fires
- 534.0%Other
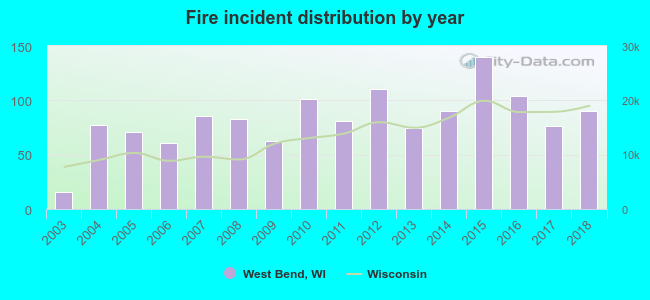 Based on the data from the years 2003 - 2018 the average number of fires per year is 83. The highest number of reported fire incidents - 140 took place in 2015, and the least - 16 in 2003. The data has an increasing trend.
The average number of yearly fire incidents per 10k residents in West Bend, WI compared to nearest cities:
(Note: Based on data for the last 3 years, including only cities with population 5,000 and above)
| West Bend: | 28.4 |
| Jackson: | 27.4 |
| Slinger: | 47.0 |
| Hartford: | 44.6 |
| Cedarburg: | 15.9 |
| Richfield: | 20.9 |
| Grafton: | 15.9 |
| Germantown: | 31.0 |
| Port Washington: | 19.9 |
 The median response time based on all reported fire incidents is 5 minutes. This is lower compared to the state median value.
The median response time in West Bend, WI compared to nearest cities:
(Note: Based on data for all years, including only cities with at least 500 fire incidents)
| West Bend: | 5 minutes |
| Hartford: | 8 minutes |
| Menomonee Falls: | 6 minutes |
| Sussex: | 9 minutes |
| Hartland: | 9 minutes |
| Plymouth: | 10 minutes |
| Pewaukee: | 8 minutes |
| Brookfield: | 7 minutes |
 Based on the data from the years 2003 - 2018 the average number of fire-related casualties per year is 3. The highest number of reported injuries - 9 took place in 2004, and the lowest - 0 in 2003. The data has a growing trend.
The average number of casualties per 1,000 fire incidents is 34. This indicator was the highest - 117 in 2004, and the lowest 0 in 2003. The trend for injuries per 1,000 fires is rising. Compared to the state value the number of casualties per 1,000 fires is much higher.
Based on the data from the years 2003 - 2018 the average number of fire-related casualties per year is 3. The highest number of reported injuries - 9 took place in 2004, and the lowest - 0 in 2003. The data has a growing trend.
The average number of casualties per 1,000 fire incidents is 34. This indicator was the highest - 117 in 2004, and the lowest 0 in 2003. The trend for injuries per 1,000 fires is rising. Compared to the state value the number of casualties per 1,000 fires is much higher.Casualties per 1,000 incidents in West Bend, WI compared to nearest cities:
(Note: Based on data for all years, including only cities with at least 500 fire incidents)
| West Bend: | 33.2 |
| Hartford: | 15.0 |
| Menomonee Falls: | 15.4 |
| Sussex: | 10.1 |
| Hartland: | 3.8 |
| Plymouth: | 9.9 |
| Pewaukee: | 16.7 |
| Brookfield: | 21.0 |
 32.4% incidents where reported in the morning and 67.6% in the evening. The most fires (16.4%) took place on Monday, and the least (12.2%) on Thursday.
 Based on the 1,326 fire incident reports from years 2003 - 2018 most fires (12.1%) took place during April, and the least (4.5%) in January.
 Out of all 18,341 cases reported during the years 2003 - 2018, the most belonged to the categories: Rescue & EMS (78.1%), Fire (7.2%), and Hazardous Condition (6.1%).
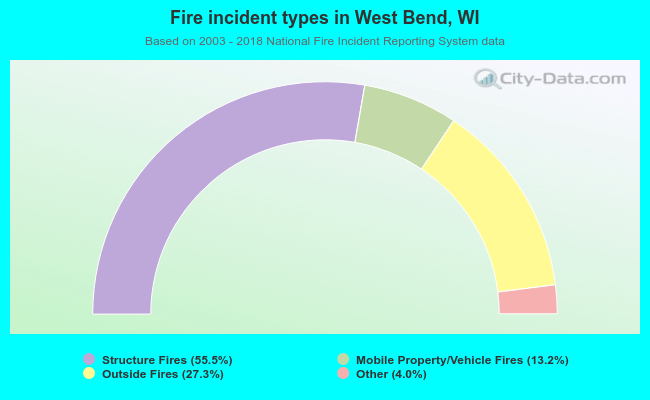 When looking into fire subcategories, the most reports belonged to: Structure Fires (55.5%), and Outside Fires (27.3%).