West Bountiful: Fire Incidents, Utah (UT)
Where are fire incidents reported in West Bountiful, UT
Something went wrong! Please refresh the page.
|
| |||||||||||||||||||||||||||||||||||||||||||||||||||||||||||||||||||||||||||||||||||||||||||||||||||||||||||||
2003 - 2018 National Fire Incident Reporting System (NFIRS) incidents
- Incident types reported to NFIRS in West Bountiful, UT
- 67452.5%Rescue & EMS
- 18314.2%Hazardous Condition
- 16312.7%Fire
- 1169.0%Good Intent Call
- 755.8%False Alarm
- 715.5%Service Call
- 20.2%Special Incident
- Fire incident types reported to NFIRS in West Bountiful, UT
- 8250.3%Outside Fires
- 4024.5%Structure Fires
- 3722.7%Mobile Property/Vehicle Fires
- 42.5%Other
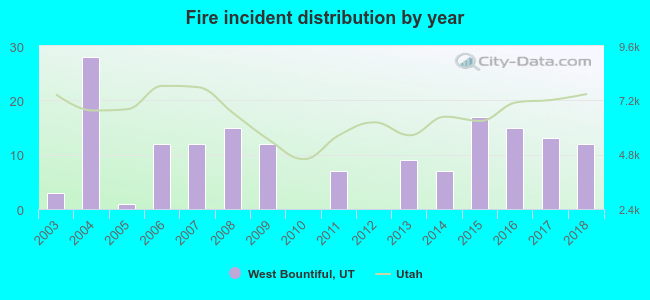 According to the data from the years 2003 - 2018 the average number of fire incidents per year is 10. The highest number of reported fire incidents - 28 took place in 2004, and the least - 0 in 2010. The data has a rising trend.
The average number of yearly fire incidents per 10k residents in West Bountiful, UT compared to nearest cities:
(Note: Based on data for the last 3 years, including only cities with population 5,000 and above)
| West Bountiful: | 24.5 |
| Woods Cross: | 20.4 |
| Bountiful: | 12.3 |
| Centerville: | 17.0 |
| North Salt Lake: | 22.8 |
| Farmington: | 22.6 |
| Fruit Heights: | 25.6 |
| Kaysville: | 17.5 |
| Salt Lake City: | 27.4 |

 According to the data from the years 2003 - 2018 the average number of fire-related yearly casualties is 0. The highest number of injuries - 3 took place in 2008, and the lowest - 0 in 2003. The data has a constant trend.
 28.2% incidents where reported in the morning and 71.8% in the evening. The most fires (18.4%) took place on Wednesday, and the least (10.4%) on Friday.
 According to the 163 reports from years 2003 - 2018 most fires (13.5%) took place during June, and the least (3.7%) in February.
 Out of all 1,285 cases reported during the years 2003 - 2018, the most belonged to the categories: Rescue & EMS (52.5%), Hazardous Condition (14.2%), and Fire (12.7%).
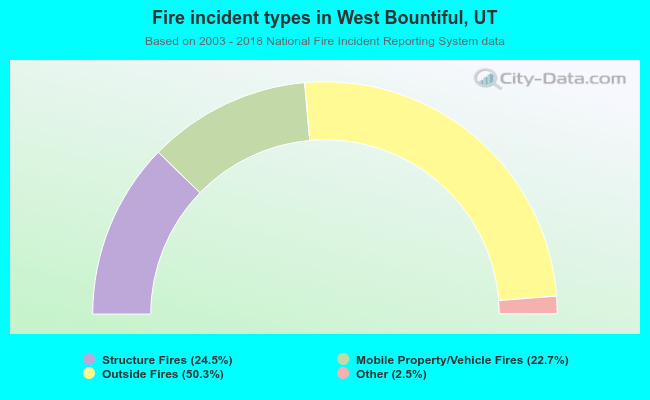 When looking into fire subcategories, the most reports belonged to: Outside Fires (50.3%), and Structure Fires (24.5%).