North Salt Lake: Fire Incidents, Utah (UT)
Where are fire incidents reported in North Salt Lake, UT
Something went wrong! Please refresh the page.
|
| |||||||||||||||||||||||||||||||||||||||||||||||||||||||||||||||||||||||||||||||||||||||||||||||||||||||||||||
2003 - 2018 National Fire Incident Reporting System (NFIRS) incidents
- Incident types reported to NFIRS in North Salt Lake, UT
- 2,77956.5%Rescue & EMS
- 54111.0%Hazardous Condition
- 4679.5%Good Intent Call
- 4669.5%Fire
- 4148.4%False Alarm
- 2364.8%Service Call
- 110.2%Overpressure Rupture
- Fire incident types reported to NFIRS in North Salt Lake, UT
- 21947.0%Outside Fires
- 13829.6%Structure Fires
- 9921.2%Mobile Property/Vehicle Fires
- 102.1%Other
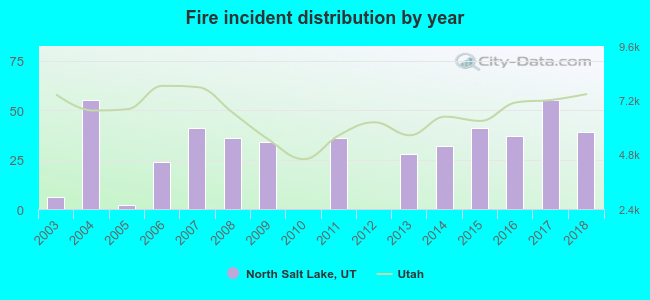 According to the data from the years 2003 - 2018 the average number of fires per year is 29. The highest number of fire incidents - 55 took place in 2004, and the least - 0 in 2010. The data has a rising trend.
The average number of yearly fire incidents per 10k residents in North Salt Lake, UT compared to nearest cities:
(Note: Based on data for the last 3 years, including only cities with population 5,000 and above)
| North Salt Lake: | 22.8 |
| Woods Cross: | 20.4 |
| Bountiful: | 12.3 |
| West Bountiful: | 24.5 |
| Centerville: | 17.0 |
| Salt Lake City: | 27.4 |
| South Salt Lake: | 44.9 |
| Farmington: | 22.6 |
| Millcreek: | 11.9 |
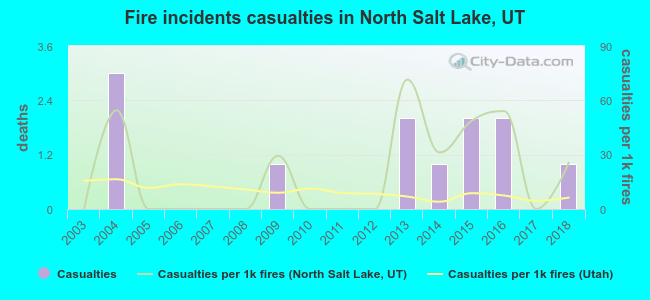 According to the data from the years 2003 - 2018 the average number of fire-related yearly casualties is 1. The highest number of casualties - 3 took place in 2004, and the lowest - 0 in 2003. The data has an increasing trend.
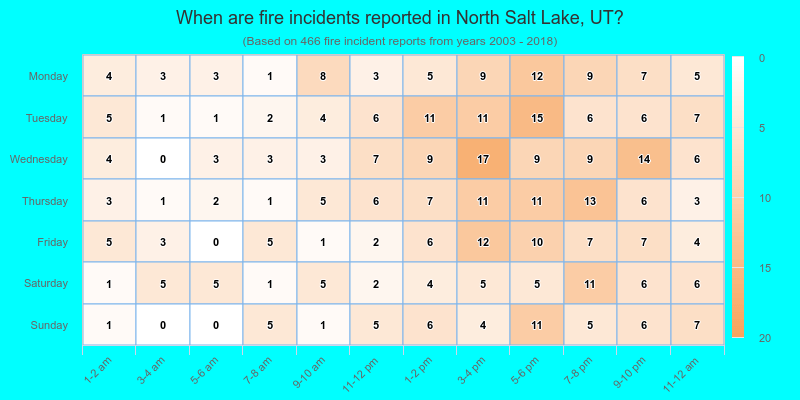
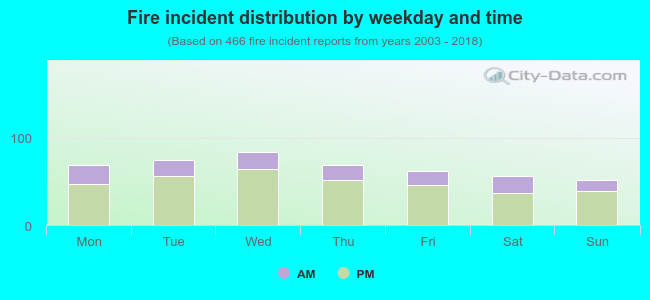 27.0% incidents where reported in the morning and 73.0% in the evening. The most fires (18.0%) took place on Wednesday, and the least (10.9%) on Sunday.
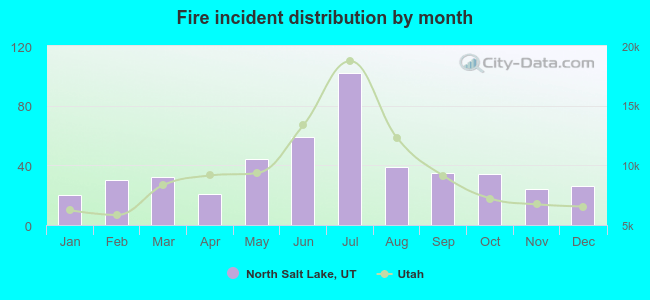 According to the 466 fire incident reports from years 2003 - 2018 most fires (21.9%) took place during July, and the least (4.3%) in January.
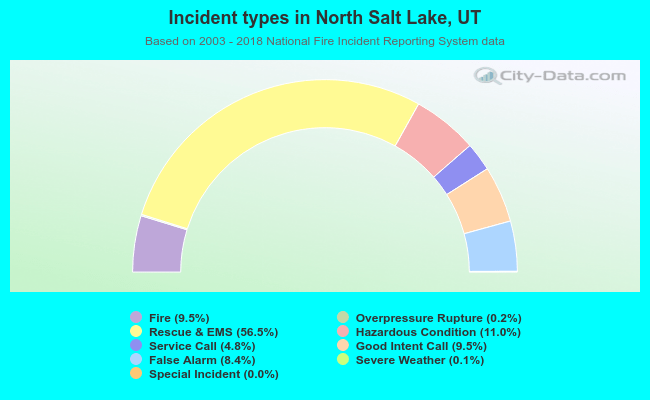 Out of all 4,919 cases reported during the years 2003 - 2018, the most belonged to the categories: Rescue & EMS (56.5%), Hazardous Condition (11.0%), and Good Intent Call (9.5%).
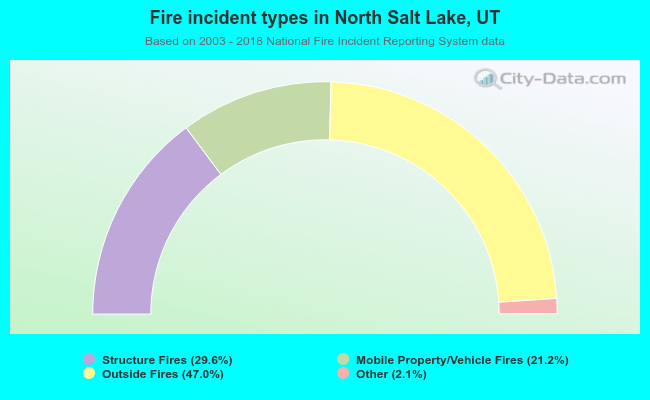 When looking into fire subcategories, the most reports belonged to: Outside Fires (47.0%), and Structure Fires (29.6%).