Woods Cross: Fire Incidents, Utah (UT)
Where are fire incidents reported in Woods Cross, UT
Something went wrong! Please refresh the page.
|
| |||||||||||||||||||||||||||||||||||||||||||||||||||||||||||||||||||||||||||||||||||||||||||||||||||||||||||||
2003 - 2018 National Fire Incident Reporting System (NFIRS) incidents
- Incident types reported to NFIRS in Woods Cross, UT
- 1,58356.3%Rescue & EMS
- 30510.8%Hazardous Condition
- 2669.5%Fire
- 2639.3%Good Intent Call
- 2037.2%False Alarm
- 1856.6%Service Call
- 70.2%Overpressure Rupture
- Fire incident types reported to NFIRS in Woods Cross, UT
- 12045.1%Outside Fires
- 8130.5%Structure Fires
- 5821.8%Mobile Property/Vehicle Fires
- 72.6%Other
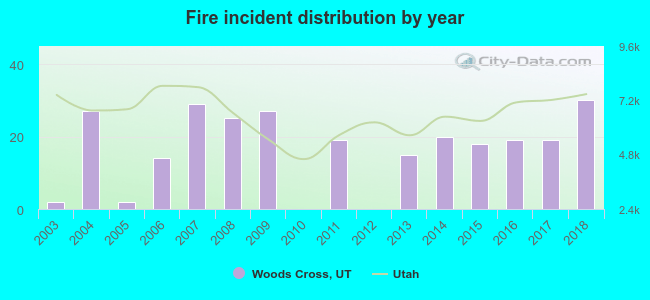 Based on the data from the years 2003 - 2018 the average number of fires per year is 17. The highest number of fires - 30 took place in 2018, and the least - 0 in 2010. The data has a rising trend.
The average number of yearly fire incidents per 10k residents in Woods Cross, UT compared to nearest cities:
(Note: Based on data for the last 3 years, including only cities with population 5,000 and above)
| Woods Cross: | 20.4 |
| West Bountiful: | 24.5 |
| Bountiful: | 12.3 |
| North Salt Lake: | 22.8 |
| Centerville: | 17.0 |
| Farmington: | 22.6 |
| Salt Lake City: | 27.4 |
| Fruit Heights: | 25.6 |
| Kaysville: | 17.5 |
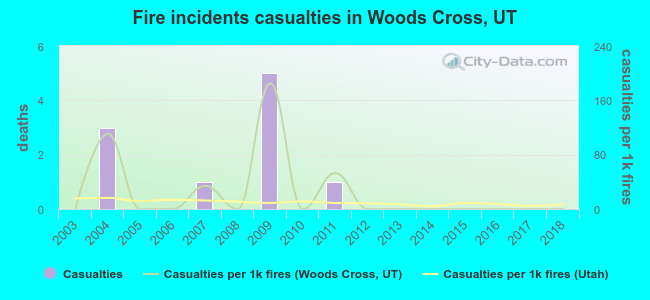 Based on the reports from the years 2003 - 2018 the average number of fire-related casualties per year is 1. The highest number of reported injuries - 5 took place in 2009, and the lowest - 0 in 2003. The data has a constant trend.
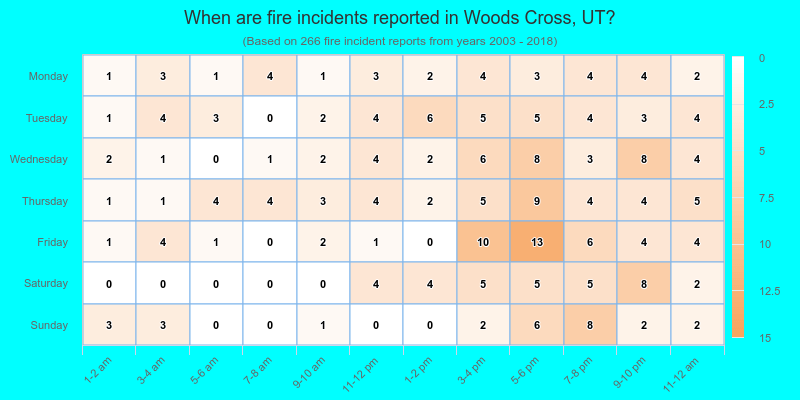
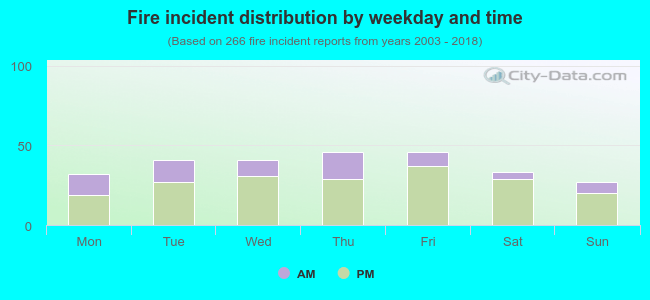 27.8% incidents where reported in the morning and 72.2% in the evening. The most fires (17.3%) took place on Thursday, and the least (10.2%) on Sunday.
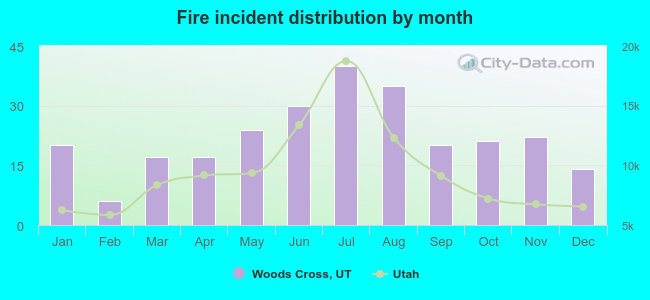 Based on the 266 fire incident reports from years 2003 - 2018 most fires (15.0%) took place during July, and the least (2.3%) in February.
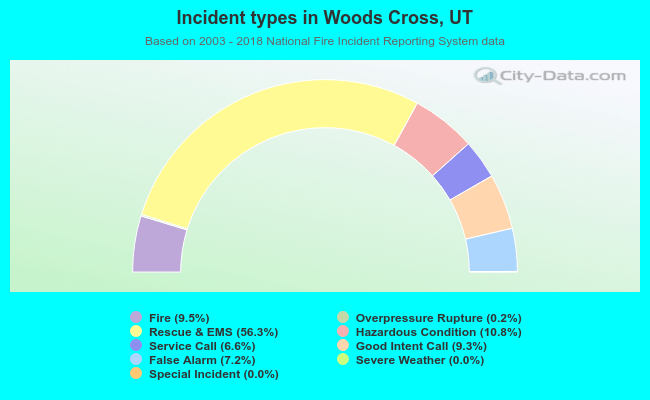 Out of all 2,814 cases reported during the years 2003 - 2018, the most belonged to the categories: Rescue & EMS (56.3%), Hazardous Condition (10.8%), and Fire (9.5%).
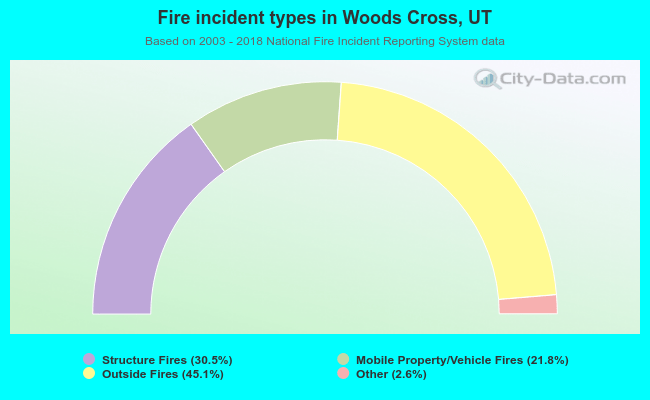 When looking into fire subcategories, the most incidents belonged to: Outside Fires (45.1%), and Structure Fires (30.5%).