Winston-Salem: Fire Incidents, North Carolina (NC)
Where are fire incidents reported in Winston-Salem, NC
Something went wrong! Please refresh the page.
| Fire incidents reported | |
|---|---|
| Sreet name | Count |
| WAUGHTOWN ST | 92 |
| REYNOLDA RD | 82 |
| HANES MALL BLVD | 78 |
| MAIN ST | 74 |
| STRATFORD RD | 66 |
| MARTIN LUTHER KING JR DR | 64 |
| PATTERSON AVE | 64 |
| PETERS CREEK PW | 64 |
| NORTHWEST BLVD | 62 |
| UNIVERSITY PW | 62 |
| COUNTRY CLUB RD | 58 |
| OLD HOLLOW RD | 58 |
| OLD VINEYARD RD | 54 |
| SILAS CREEK PW | 50 |
| BAUX MOUNTAIN RD | 48 |
| CLEMMONSVILLE RD | 48 |
| EB 40 | 48 |
| FOURTH ST | 48 |
| JONESTOWN RD | 48 |
| SHATTALON DR | 48 |
| HANES MILL RD | 46 |
| OLD GREENSBORO RD | 46 |
| NEW WALKERTOWN RD | 44 |
| OLD LEXINGTON RD | 44 |
| SPRAGUE ST | 44 |
| FISHEL RD | 42 |
| WB 40 | 42 |
| LIBERTY ST | 40 |
| ROBINHOOD RD | 38 |
| FIFTH ST | 36 |
| Other | 2,599 |
2002 - 2011 National Fire Incident Reporting System (NFIRS) incidents
- Incident types reported to NFIRS in Winston-Salem, NC
- 5,47531.3%Rescue & EMS
- 4,85727.8%Hazardous Condition
- 4,23724.2%Fire
- 1,1326.5%Good Intent Call
- 9075.2%False Alarm
- 8524.9%Service Call
- 240.1%Severe Weather
- Fire incident types reported to NFIRS in Winston-Salem, NC
- 1,54536.5%Outside Fires
- 1,35231.9%Structure Fires
- 77318.2%Mobile Property/Vehicle Fires
- 56713.4%Other
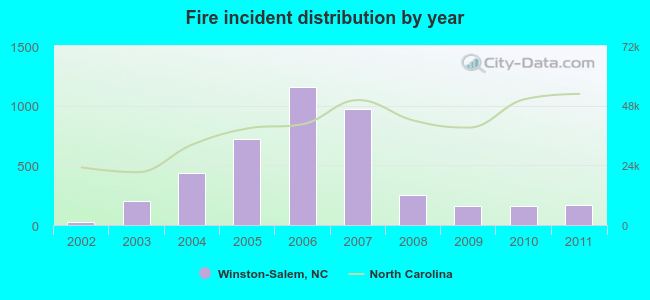 According to the data from the years 2002 - 2011 the average number of fires per year is 424. The highest number of fires - 1,153 took place in 2006, and the least - 21 in 2002. The data has an increasing trend.
 The median response time based on all reported fire incidents is 4 minutes. This is lower compared to the state median value.
The median response time in Winston-Salem, NC compared to nearest cities:
(Note: Based on data for all years, including only cities with at least 500 fire incidents)
| Winston-Salem: | 4 minutes |
| Walkertown: | 7 minutes |
| Hampstead: | 8 minutes |
| Lewisville: | 7 minutes |
| Clemmons: | 7 minutes |
| Rural Hall: | 8 minutes |
| Kernersville: | 5 minutes |
| King: | 8 minutes |
| Advance: | 7 minutes |
 According to the reports from the years 2002 - 2011 the average number of fire-related fatalities per year is 1. The highest number of reported deaths - 4 took place in 2007, and the lowest - 0 in 2002. The data has a constant trend.
The average number of fatalities per 1,000 fires is 2. This indicator was the highest - 10 in 2003, and the lowest 0 in 2002. The trend for deaths per 1,000 fire incidents is constant. Compared to the North Carolina value the number of fatalities per 1,000 fire incidents is higher.
According to the reports from the years 2002 - 2011 the average number of fire-related fatalities per year is 1. The highest number of reported deaths - 4 took place in 2007, and the lowest - 0 in 2002. The data has a constant trend.
The average number of fatalities per 1,000 fires is 2. This indicator was the highest - 10 in 2003, and the lowest 0 in 2002. The trend for deaths per 1,000 fire incidents is constant. Compared to the North Carolina value the number of fatalities per 1,000 fire incidents is higher.Deaths per 1,000 incidents in Winston-Salem, NC compared to nearest cities:
(Note: Based on data for all years, including only cities with at least 2,500 fire incidents)
| Winston-Salem: | 2.1 |
| Kernersville: | 1.1 |
| High Point: | 1.2 |
| Thomasville: | 2.5 |
| Lexington: | 0.0 |
| Mocksville: | 1.7 |
| Greensboro: | 1.9 |
| Salisbury: | 1.8 |
| Asheboro: | 0.3 |
 Based on the data from the years 2002 - 2011 the average number of fire-related yearly casualties is 6. The highest number of reported injuries - 21 took place in 2007, and the lowest - 0 in 2002. The data has a constant trend.
The average number of injuries per 1,000 fire incidents is 11. This indicator was the highest - 36 in 2003, and the lowest 0 in 2002. The trend for injuries per 1,000 fires is rising. Compared to the state value the number of casualties per 1,000 fires is much higher.
Based on the data from the years 2002 - 2011 the average number of fire-related yearly casualties is 6. The highest number of reported injuries - 21 took place in 2007, and the lowest - 0 in 2002. The data has a constant trend.
The average number of injuries per 1,000 fire incidents is 11. This indicator was the highest - 36 in 2003, and the lowest 0 in 2002. The trend for injuries per 1,000 fires is rising. Compared to the state value the number of casualties per 1,000 fires is much higher.Casualties per 1,000 incidents in Winston-Salem, NC compared to nearest cities:
(Note: Based on data for all years, including only cities with at least 500 fire incidents)
| Winston-Salem: | 14.9 |
| Walkertown: | 5.9 |
| Hampstead: | 6.4 |
| Lewisville: | 5.6 |
| Clemmons: | 19.2 |
| Rural Hall: | 7.0 |
| Kernersville: | 13.6 |
| King: | 9.7 |
| Advance: | 8.9 |
 29.9% incidents where reported in the morning and 70.1% in the evening. The most fires (15.8%) took place on Saturday, and the least (13.5%) on Wednesday.
 Based on the 4,237 fire incident reports from years 2002 - 2011 most fires (11.7%) took place during March, and the least (5.2%) in October.
 Out of all 17,493 cases reported during the years 2002 - 2011, the most belonged to the categories: Rescue & EMS (31.3%), Hazardous Condition (27.8%), and Fire (24.2%).
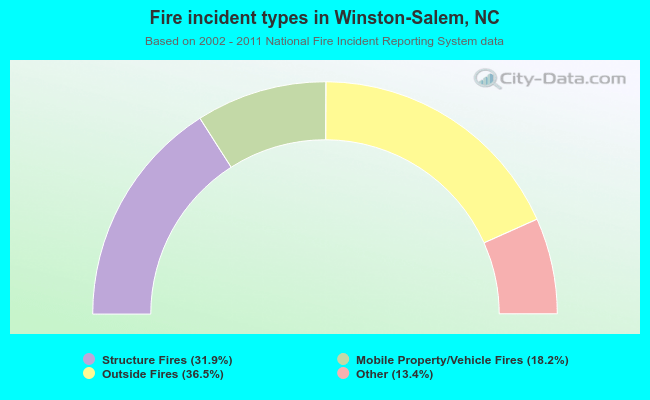 When looking into fire subcategories, the most incidents belonged to: Outside Fires (36.5%), and Structure Fires (31.9%).