De Witt, IA (Iowa) Houses and Residents
| De Witt: | $208,959 |
| Iowa: | $194,600 |
Mean price in 2022:
Detached houses: $228,087
Here: $228,087 State: $245,224 Townhouses or other attached units: $361,457
Here: $361,457 State: $238,767
Total population: 5,253 (Urban population: 4,852 (all inside urban clusters), Rural population: 198 (all nonfarm))
Houses: 2,214 (2,049 occupied: 1,641 owner occupied, 441 renter occupied)
| % of renters here: | 21% |
| State: | 28% |
Housing density: 455 houses/condos per square mile
Median price asked for vacant for-sale houses and condos in 2022 in this county: $66,559.
Median contract rent in 2022: $716 (lower quartile is $621, upper quartile is $811)
Median rent asked for vacant for-rent units in 2022: $497
Median gross rent in De Witt, IA in 2022: $871
Housing units in De Witt with a mortgage: 974 (112 second mortgage, 0 home equity loan, 81 both second mortgage and home equity loan)
Houses without a mortgage: 43
Median household income for houses/condos with a mortgage: $89,146
Median household income for apartments without a mortgage: $80,137
Median monthly housing costs: $974


Median year apartment built: 1979
Household type by relationship:
Households: 5,528- Male householders: 1,122 (280 living alone), Female householders: 904 (281 living alone)
1,122 spouses (1,112 opposite-sex spouses), 127 unmarried partners, (127 opposite-sex unmarried partners), 1,801 children (1,541 natural, 38 adopted, 221 stepchildren), 23 grandchildren, 14 brothers or sisters, 59 parents, 0 foster children, 176 other relatives, 60 non-relatives
- In group quarters: 117
Size of family households: 791 2-persons, 241 3-persons, 129 4-persons, 201 5-persons, 9 6-persons, 96 7-or-more-persons.
Size of nonfamily households: 583 1-person, 23 2-persons, 15 3-persons.
1,000 married couples with children.
423 single-parent households (329 men, 94 women).
94.5% of residents of De Witt speak English at home.
0.3% of residents speak Spanish at home (100% speak English very well).
0.6% of residents speak other Indo-European language at home (100% speak English very well).
4.3% of residents speak Asian or Pacific Island language at home (69% speak English very well, 31% don't speak English at all).
Foreign born population: 267 (4.8%)
(40.1% of them are naturalized citizens)
| Here: | 7.0 |
| State: | 6.8 |
| Here: | 4.1 |
| State: | 4.2 |

- Bedrooms in owner-occupied houses and condos in De Witt, Iowa
- 17no bedroom
- 191 bedroom
- 4662 bedrooms
- 5203 bedrooms
- 4784 bedrooms
- 1425+ bedrooms

- Bedrooms in renter-occupied apartments in De Witt, Iowa
- 34no bedroom
- 1241 bedroom
- 1962 bedrooms
- 663 bedrooms
- 224 bedrooms
- 05+ bedrooms

- Cars and other vehicles available in De Witt in owner-occupied houses/condos
- 53no vehicle
- 3881 vehicle
- 7562 vehicles
- 3263 vehicles
- 1044 vehicles
- 145+ vehicles

- Cars and other vehicles available in De Witt in renter-occupied apartments
- 35no vehicle
- 2841 vehicle
- 1012 vehicles
- 223 vehicles
- 04 vehicles
- 05+ vehicles

- Rooms in owner-occupied houses in De Witt, Iowa
- 171 room
- 192 rooms
- 03 rooms
- 2504 rooms
- 1885 rooms
- 2176 rooms
- 3367 rooms
- 2118 rooms
- 4049+ rooms

- Rooms in renter-occupied apartments in De Witt, Iowa
- 341 room
- 442 rooms
- 923 rooms
- 834 rooms
- 925 rooms
- 586 rooms
- 397 rooms
- 08 rooms
- 09+ rooms


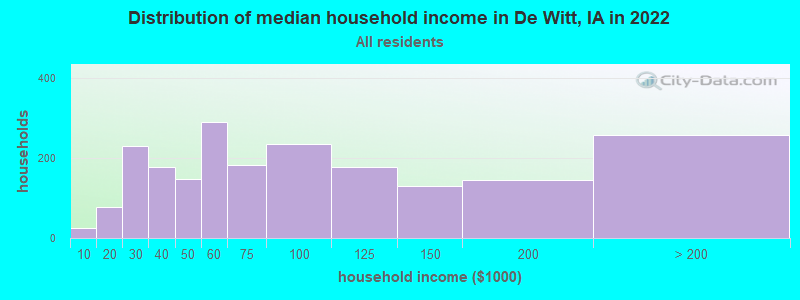
De Witt, IA household income distribution

- 25Less than $10,000
- 78$10,000 to $19,999
- 230$20,000 to $29,999
- 178$30,000 to $39,999
- 148$40,000 to $49,999
- 290$50,000 to $59,999
- 183$60,000 to $74,999
- 234$75,000 to $99,999
- 177$100,000 to $124,999
- 131$125,000 to $149,999
- 145$150,000 to $199,999
- 258$200,000 or more
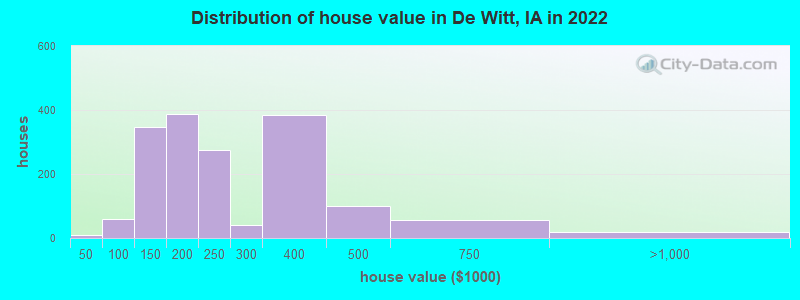
Home value of owner - occupied houses in 2022 in De Witt, IA
-
- 10Less than $10,000
- 13$70,000 to $79,999
- 9$80,000 to $89,999
- 35$90,000 to $99,999
- 259$100,000 to $124,999
- 88$125,000 to $149,999
- 268$150,000 to $174,999
- 118$175,000 to $199,999
- 275$200,000 to $249,999
- 42$250,000 to $299,999
- 384$300,000 to $399,999
- 100$400,000 to $499,999
- 56$500,000 to $749,999
- 18$750,000 to $999,999
Rent paid by renters in 2022 in De Witt, IA
-
- 6Less than $100
- 11$350 to $399
- 8$450 to $499
- 28$500 to $549
- 37$550 to $599
- 15$600 to $649
- 71$650 to $699
- 101$700 to $749
- 39$750 to $799
- 79$800 to $899
- 22$1,000 to $1,249
- 21$1,250 to $1,499


Percentage of workers working in this county: 55.8%
Number of people working at home: 161 (6.2% of all workers)
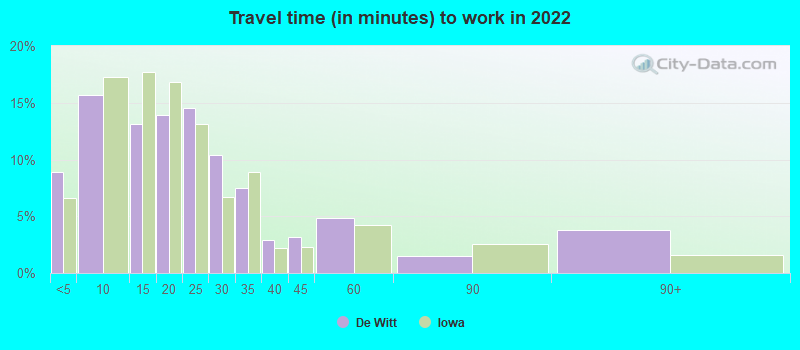
Travel time to work (commute)
- Less than 5 minutes: 221
- 5 to 9 minutes: 425
- 10 to 14 minutes: 173
- 15 to 19 minutes: 179
- 20 to 24 minutes: 329
- 25 to 29 minutes: 368
- 30 to 34 minutes: 286
- 35 to 39 minutes: 113
- 40 to 44 minutes: 193
- 45 to 59 minutes: 106
- 60 to 89 minutes: 23
- 90 or more minutes: 0
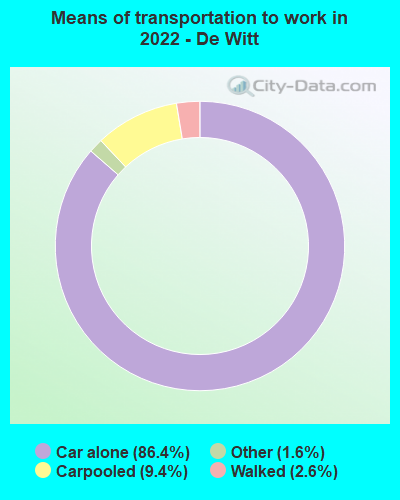
Means of transportation to work:
- Drove a car alone: 2,522 (80.6%)
- Carpooled: 289 (9.2%)
- Taxi: 45 (1.4%)
- Walked: 74 (2.4%)
- Worked at home: 161 (5.1%)

- Unemployment by race in 2022
- Unemployment rate for White non-Hispanic residents
- 2.7%Males
- 1.4%Females
- Unemployment rate for Black residents
- 100.0%Males
- Unemployment rate for two or more race residents
- 26.5%Males

- Year of entry for the foreign-born population in De Witt, Iowa
- 1842010 or later
- 642000 to 2009
- 151990 to 1999
- 61980 to 1989
- 251970 to 1979
- 35Before 1970
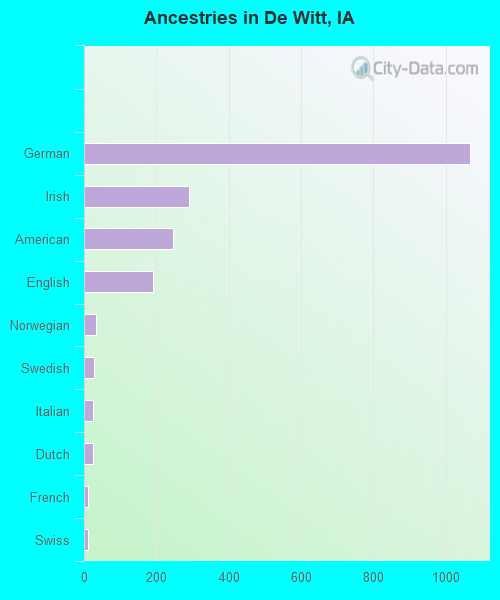
First ancestries reported:
- German: 1,066 (47.8%)
- Irish: 289 (13.0%)
- American: 245 (11.0%)
- English: 191 (8.6%)
- Norwegian: 34 (1.5%)
- Swedish: 29 (1.3%)
- Italian: 25 (1.1%)
- Dutch: 24 (1.1%)
- French: 11 (0.5%)
- Swiss: 10 (0.4%)
Most common places of birth for foreign-born residents (%):
| De Witt: | 82.3% (209) |
| Iowa: | 2.1% (3,682) |
| De Witt: | 6.3% (16) |
| Iowa: | 23.3% (41,625) |
| De Witt: | 5.9% (15) |
| Iowa: | 0.1% (147) |
Place of birth for U.S.-born residents:
- This state: 4,009
- Other state: 1,134
- Northeast: 9
- Midwest: 922
- South: 176
- West: 19
88.2% of De Witt residents lived in the same house 1 years ago.
Out of people who lived in different houses, 38.3% lived in this county.
Out of people who lived in different counties, 58.8% lived in Iowa.
| De Witt: | 88.2% |
| State average: | 87.2% |
Education attainment for males 25 years and older:
- No schooling: 21
- Nursery to 4th grade: 0
- 5th and 6th grade: 16
- 7th and 8th grade: 25
- 9th grade: 10
- 10th grade: 0
- 11th grade: 0
- 12th grade, no diploma: 8
- High school graduate (or equivalency): 400
- Less than 1 year of college: 66
- Some college more than 1 year, no degree: 180
- Associate degree: 194
- Bachelor's degree: 426
- Master's degree: 110
- Professional school degree: 66
- Doctorate degree: 105

Education attainment for females 25 years and older:
- No schooling: 0
- Nursery to 4th grade: 18
- 5th and 6th grade: 0
- 7th and 8th grade: 6
- 9th grade: 0
- 10th grade: 0
- 11th grade: 18
- 12th grade, no diploma: 20
- High school graduate (or equivalency): 545
- Less than 1 year of college: 111
- Some college more than 1 year, no degree: 181
- Associate degree: 265
- Bachelor's degree: 581
- Master's degree: 168
- Professional school degree: 13
- Doctorate degree: 52


Housing units in structures:
- One, detached: 1,540
- One, attached: 171
- Two: 60
- 3 or 4: 136
- 5 to 9: 84
- 10 to 19: 94
- 20 to 49: 109
- 50 or more: 17
Housing units lacking complete kitchen facilities in 2022: 1.7%
House/condo owner moved in on average 9 years ago
Renter moved in on average 4 years ago

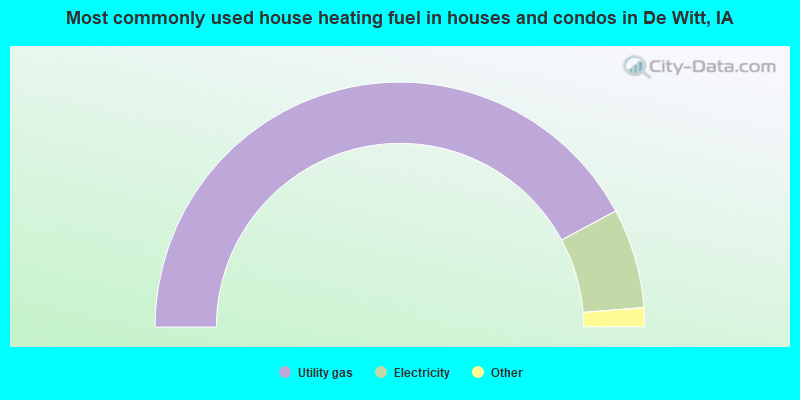
- 84.3%Utility gas
- 13.2%Electricity
- 1.8%Bottled, tank, or LP gas
- 0.6%Wood
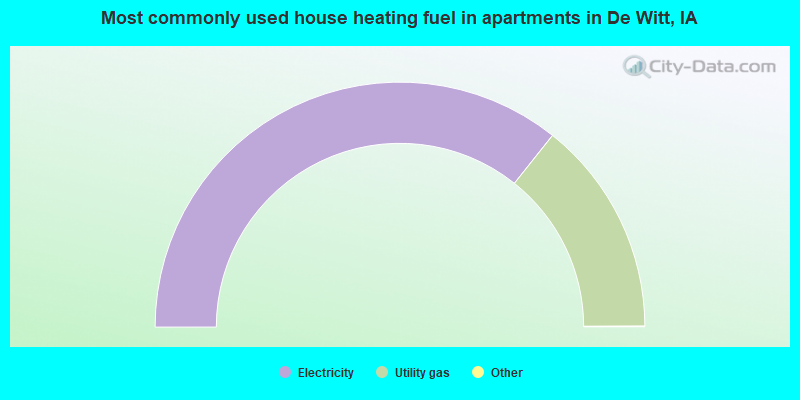
- 71.5%Electricity
- 28.5%Utility gas
Private vs. public school enrollment:
| Here: | 12.3% |
| Iowa: | 10.6% |
| Here: | 0.0% |
| Iowa: | 7.9% |
| Here: | 0.0% |
| Iowa: | 23.9% |


