Helmville, MT (Montana) Houses and Residents
| Helmville: | $488,869 |
| Montana: | $366,400 |
Total population: 510 (Urban population: 0, Rural population: 517 (124 farm, 393 nonfarm))
Houses: 381 (210 occupied: 148 owner occupied, 62 renter occupied)
| % of renters here: | 30% |
| State: | 31% |
Housing density: 0 houses/condos per square mile
Median price asked for vacant for-sale houses and condos in 2022 in this county: $206,100.
Median contract rent in 2022: $536 (lower quartile is $499, upper quartile is $716)
Median rent asked for vacant for-rent units in 2022: $491
Median gross rent in Helmville, MT in 2022: $755
Housing units in Helmville with a mortgage: 21 (4 second mortgage, 5 home equity loan, 0 both second mortgage and home equity loan)
Houses without a mortgage: 28


Household type by relationship:
Households: 5,504- In family households: 4,519 (1,213 male householders, 369 female householders)
1,252 spouses, 1,404 children (1,265 natural, 49 adopted, 90 stepchildren), 85 grandchildren, 21 brothers or sisters, 19 parents, foster children, 28 other relatives, 104 non-relatives
- In nonfamily households: 985 (491 male householders (437 living alone)), 393 female householders (357 living alone)), 101 nonrelatives
- In group quarters: 1,523 (all institutionalized)
1,077 married couples with children.
324 single-parent households (107 men, 217 women).
98.0% of residents of Helmville speak English at home.
0.6% of residents speak Spanish at home (100% speak English very well).
1.4% of residents speak other Indo-European language at home (100% speak English very well).
Foreign born population: 3 (0.4%)
(100.0% of them are naturalized citizens)
| Here: | 6.3 |
| State: | 6.4 |
| Here: | 6.0 |
| State: | 4.2 |

- Bedrooms in owner-occupied houses and condos in Helmville, Montana
- 2no bedroom
- 51 bedroom
- 432 bedrooms
- 663 bedrooms
- 244 bedrooms
- 85+ bedrooms

- Bedrooms in renter-occupied apartments in Helmville, Montana
- 2no bedroom
- 31 bedroom
- 242 bedrooms
- 253 bedrooms
- 64 bedrooms
- 25+ bedrooms

- Cars and other vehicles available in Helmville in owner-occupied houses/condos
- 6no vehicle
- 301 vehicle
- 722 vehicles
- 283 vehicles
- 124 vehicles
- 05+ vehicles

- Cars and other vehicles available in Helmville in renter-occupied apartments
- 4no vehicle
- 231 vehicle
- 292 vehicles
- 23 vehicles
- 24 vehicles
- 25+ vehicles

- Rooms in owner-occupied houses in Helmville, Montana
- 21 room
- 12 rooms
- 63 rooms
- 134 rooms
- 465 rooms
- 226 rooms
- 297 rooms
- 118 rooms
- 189+ rooms

- Rooms in renter-occupied apartments in Helmville, Montana
- 21 room
- 32 rooms
- 43 rooms
- 114 rooms
- 175 rooms
- 66 rooms
- 117 rooms
- 28 rooms
- 69+ rooms


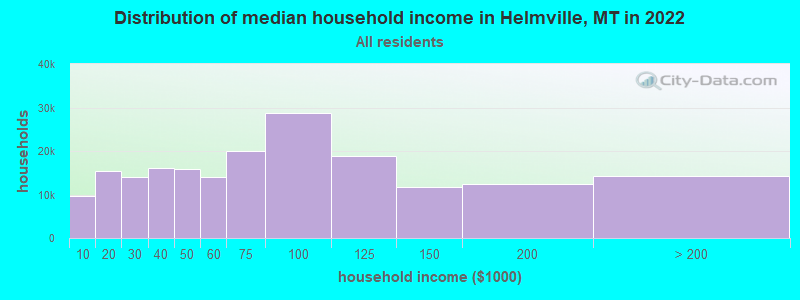
Helmville, MT household income distribution

- 8,266Less than $10,000
- 12,376$10,000 to $19,999
- 10,062$20,000 to $29,999
- 13,861$30,000 to $39,999
- 12,538$40,000 to $49,999
- 12,272$50,000 to $59,999
- 16,771$60,000 to $74,999
- 23,330$75,000 to $99,999
- 15,413$100,000 to $124,999
- 10,554$125,000 to $149,999
- 12,589$150,000 to $199,999
- 13,090$200,000 or more
Percentage of workers working in this county: 76.6%
Number of people working at home: 38 (14.6% of all workers)
Travel time to work (commute)
- Less than 5 minutes: 23
- 5 to 9 minutes: 25
- 10 to 14 minutes: 15
- 15 to 19 minutes: 9
- 20 to 24 minutes: 10
- 25 to 29 minutes: 5
- 30 to 34 minutes: 30
- 35 to 39 minutes: 6
- 40 to 44 minutes: 2
- 45 to 59 minutes: 15
- 60 to 89 minutes: 11
- 90 or more minutes: 3
Means of transportation to work:
- Drove a car alone: 97 (46.2%)
- Carpooled: 17 (8.1%)
- Walked: 39 (18.6%)
- Other means: 1 (0.5%)
- Worked at home: 56 (26.7%)


- Year of entry for the foreign-born population in Helmville, Montana
- 01995 to March 2000
- 01990 to 1994
- 01985 to 1989
- 01980 to 1984
- 01975 to 1979
- 01970 to 1974
- 01965 to 1969
- 2Before 1965
Most common places of birth for foreign-born residents (%):
| Helmville: | 100.0% (2) |
| Montana: | 27.8% (4,550) |
Place of birth for U.S.-born residents:
- This state: 311
- Other state: 204
- Northeast: 24
- Midwest: 56
- South: 23
- West: 101
68% of Helmville residents lived in the same house 5 years ago.
Out of people who lived in different houses, 31% lived in this county.
Out of people who lived in different counties, 55% lived in Montana.
Education attainment for males 25 years and older:
- No schooling: 2
- Nursery to 4th grade: 0
- 5th and 6th grade: 2
- 7th and 8th grade: 14
- 9th grade: 3
- 10th grade: 2
- 11th grade: 3
- 12th grade, no diploma: 2
- High school graduate (or equivalency): 74
- Less than 1 year of college: 13
- Some college more than 1 year, no degree: 35
- Associate degree: 9
- Bachelor's degree: 25
- Master's degree: 11
- Professional school degree: 0
- Doctorate degree: 2

Education attainment for females 25 years and older:
- No schooling: 0
- Nursery to 4th grade: 0
- 5th and 6th grade: 0
- 7th and 8th grade: 6
- 9th grade: 0
- 10th grade: 2
- 11th grade: 2
- 12th grade, no diploma: 4
- High school graduate (or equivalency): 65
- Less than 1 year of college: 12
- Some college more than 1 year, no degree: 32
- Associate degree: 4
- Bachelor's degree: 46
- Master's degree: 10
- Professional school degree: 0
- Doctorate degree: 0


Housing units in structures:
- One, detached: 329
- One, attached: 4
- Mobile homes: 46
- Boats, RVs, vans, etc.: 2
Median worth of mobile homes: $779,383
Housing units lacking complete kitchen facilities: 16.5%

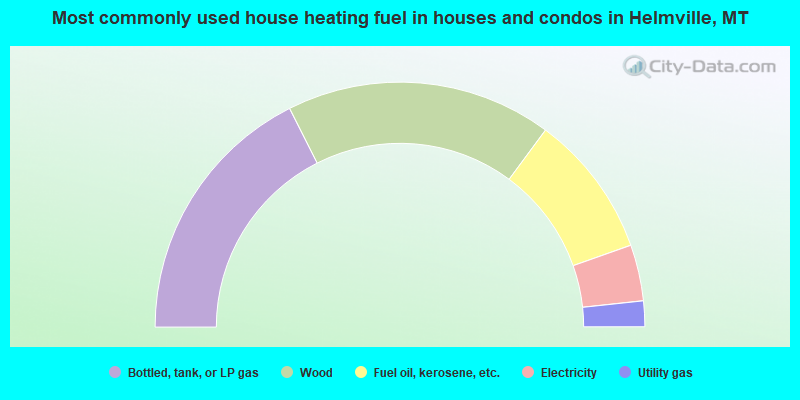
- 35.1%Bottled, tank, or LP gas
- 35.1%Wood
- 18.9%Fuel oil, kerosene, etc.
- 7.4%Electricity
- 3.4%Utility gas
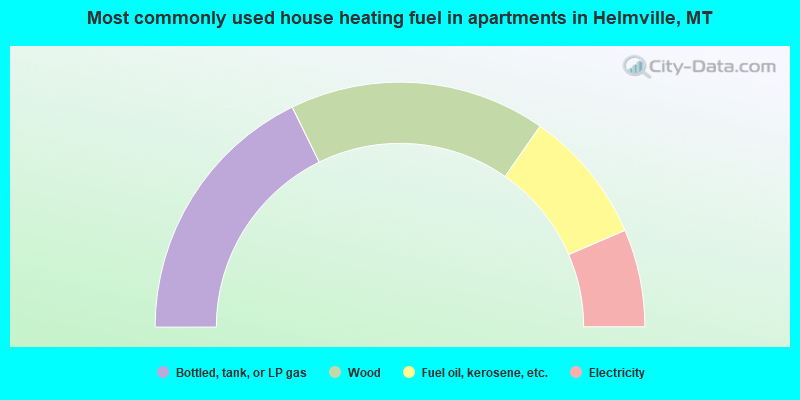
- 35.5%Bottled, tank, or LP gas
- 33.9%Wood
- 17.7%Fuel oil, kerosene, etc.
- 12.9%Electricity
Private vs. public school enrollment:
| Here: | 12.5% |
| Montana: | 7.4% |
| Here: | 14.3% |
| Montana: | 6.1% |
| Here: | 0.0% |
| Montana: | 11.5% |


