Maple Valley, WA (Washington) Houses and Residents
Estimated median house or condo value in 2022: $704,366 (it was $196,700 in 2000 )
Maple Valley:
$704,366Washington:
$569,500
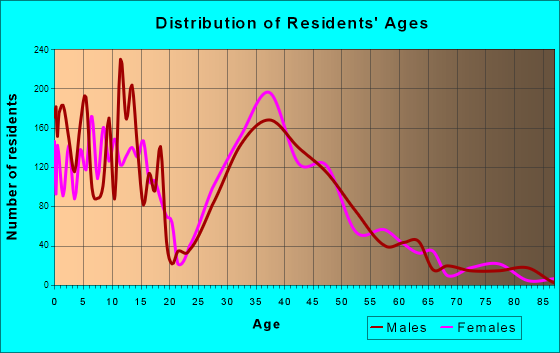
Lower value quartile - upper value quartile: $562,799 - $872,275Total population: 25,125 (Urban population: 14,318, Rural population: 23 (all nonfarm) )
Houses: 9,711 (9,494 occupied: 8,059 owner occupied, 1,422 renter occupied )
% of renters here:
15%State:
36%
Housing density: 1,789 houses/condos per square mile
Median price asked for vacant for-sale houses and condos in 2022: $5,591,719.
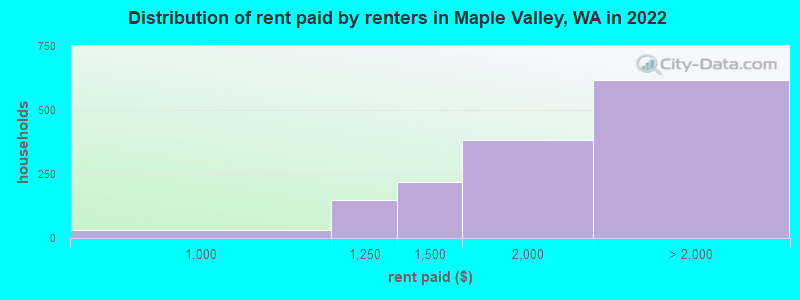
Median contract rent in 2022: $1,911 (lower quartile is $1,451, upper quartile is over $2,000)
Median rent asked for vacant for-rent units in 2022: $1,547
Median gross rent in Maple Valley, WA in 2022: over $2,000
Housing units in Maple Valley with a mortgage: 6,448 (672 second mortgage, 30 home equity loan, 652 both second mortgage and home equity loan )Houses without a mortgage: 88
Median household income for houses/condos with a mortgage: $166,683
Median household income for apartments without a mortgage: $87,518
Median monthly housing costs: $2,400
Data:
Median house or condo value ($)
Median house or condo value ($ change since 2000)
Median house or condo value ($) - White
Median house or condo value ($) - Black or African American
Median house or condo value ($) - Asian
Median house or condo value ($) - Hispanic or Latino
Median house or condo value ($) - American Indian and Alaska Native
Median house or condo value ($) - Multirace
Median house or condo value ($) - Other Race
Median price asked for mobile homes ($)
Household density (households per square mile)
Mean house or condo value by units in structure - 1, detached ($)
Mean house or condo value by units in structure - 1, attached ($)
Mean house or condo value by units in structure - 2 ($)
Mean house or condo value by units in structure by units in structure - 3 or 4 ($)
Mean house or condo value by units in structure - 5 or more ($)
Mean house or condo value by units in structure - Boat, RV, van, etc. ($)
Mean house or condo value by units in structure - Mobile home ($)
Median contract rent ($)
Median contract rent - Lower quartile ($)
Median contract rent - Upper quartile ($)
Median gross rent ($)
Urban houses (%)
Rural houses (%)
Houses occupied (%)
Houses occupied (% change since 2000)
Houses owner occupied (%)
Houses owner occupied (% change since 2000)
Houses renter occupied (%)
Houses renter occupied (% change since 2000)
Vacant housing units - For rent (%)
Vacant housing units - For rent (% change since 2000)
Vacant housing units - For sale only (%)
Vacant housing units - For sale only (% change since 2000)
Vacant housing units - Rented or sold, not occupied (%)
Vacant housing units - Rented or sold, not occupied (% change since 2000)
Vacant housing units - For seasonal, recreational, or occasional use (%)
Vacant housing units - For seasonal, recreational, or occasional use (% change since 2000)
Vacant housing units - For migrant workers (%)
Vacant housing units - For migrant workers (% change since 2000)
Vacant housing units - Other vacant (%)
Vacant housing units - Other vacant (% change since 2000)
Median monthly housing costs ($)
Median household income for houses/condos with a mortgage ($)
Median household income for houses/condos without a mortgage ($)
Median household income ($)
Median household income ($) - White
Median household income ($) - Black or African American
Median household income ($) - Asian
Median household income ($) - Hispanic or Latino
Median household income ($) - American Indian and Alaska Native
Median household income ($) - Multirace
Median household income ($) - Other Race
Mortgage status - with mortgage (%)
Mortgage status - with second mortgage (%)
Mortgage status - with home equity loan (%)
Mortgage status - with both second mortgage and home equity loan (%)
Mortgage status - without a mortgage (%)
Median year house/condo built
Median year apartment built
Household type by relationship - Male householder living alone (%)
Household type by relationship - Male householder not living alone (%)
Household type by relationship - Female householder living alone (%)
Household type by relationship - Female householder not living alone (%)
Household type by relationship - Opposite-Sex spouse (%)
Household type by relationship - Same-Sex spouse (%)
Household type by relationship - Opposite-Sex unmarried partner (%)
Household type by relationship - Same-Sex unmarried partner (%)
Household type by relationship - In group quarters (%)
Size of family households - 2-person household (%)
Size of family households - 3-person household (%)
Size of family households - 4-person household (%)
Size of family households - 5-person household (%)
Size of family households - 6-person household (%)
Size of family households - 7-or-more-person household (%)
Size of nonfamily households - 1-person household (%)
Size of nonfamily households - 2-person household (%)
Size of nonfamily households - 3-person household (%)
Size of nonfamily households - 4-person household (%)
Size of nonfamily households - 5-person household (%)
Size of nonfamily households - 6-person household (%)
Size of nonfamily households - 7-or-moreperson household (%)
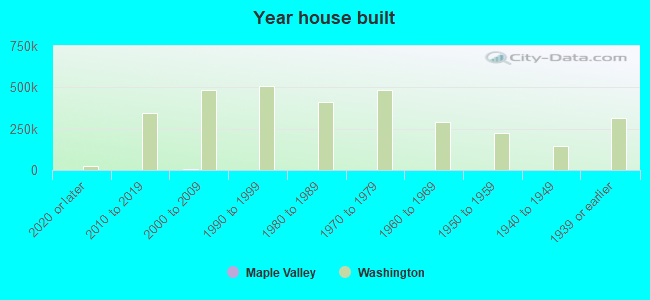
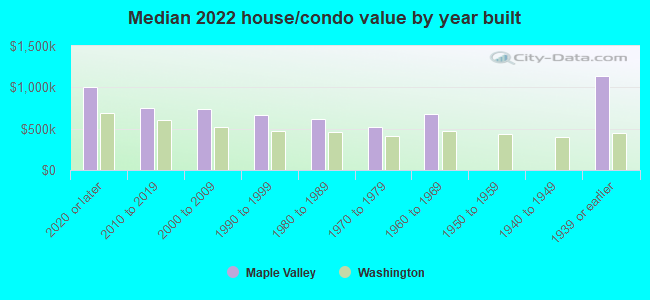
Year house built - Built 2010 or later (%)
Year house built - Built 2000 to 2009 (%)
Year house built - Built 1990 to 1999 (%)
Year house built - Built 1980 to 1989 (%)
Year house built - Built 1970 to 1979 (%)
Year house built - Built 1960 to 1969 (%)
Year house built - Built 1950 to 1959 (%)
Year house built - Built 1940 to 1949 (%)
Year house built - Built 1939 or earlier (%)
Median number of rooms in houses and condos
Median number of rooms in apartments
Median number of bedrooms in owner occupied houses
Mean number of bedrooms in owner occupied houses
Median number of bedrooms in renter occupied houses
Mean number of bedrooms in renter occupied houses
Median number of vehichles in owner occupied houses
Mean number of vehichles in owner occupied houses
Median number of vehichles in renter occupied houses
Mean number of vehichles in renter occupied houses
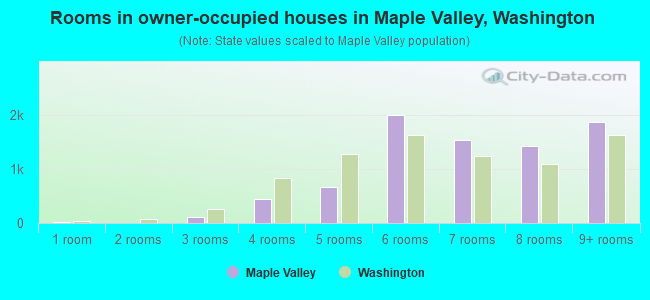
Rooms in owner-occupied houses - 1 room (%)
Rooms in owner-occupied houses - 2 rooms (%)
Rooms in owner-occupied houses - 3 rooms (%)
Rooms in owner-occupied houses - 4 rooms (%)
Rooms in owner-occupied houses - 5 rooms (%)
Rooms in owner-occupied houses - 6 rooms (%)
Rooms in owner-occupied houses - 7 rooms (%)
Rooms in owner-occupied houses - 8 rooms (%)
Rooms in owner-occupied houses - 9+ rooms (%)
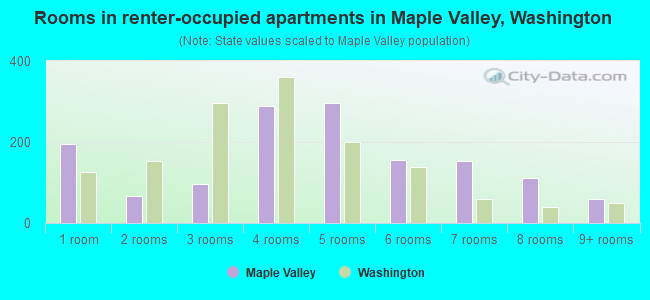
Rooms in renter-occupied houses - 1 room (%)
Rooms in renter-occupied houses - 2 rooms (%)
Rooms in renter-occupied houses - 3 rooms (%)
Rooms in renter-occupied houses - 4 rooms (%)
Rooms in renter-occupied houses - 5 rooms (%)
Rooms in renter-occupied houses - 6 rooms (%)
Rooms in renter-occupied houses - 7 rooms (%)
Rooms in renter-occupied houses - 8 rooms (%)
Rooms in renter-occupied houses - 9+ rooms (%)
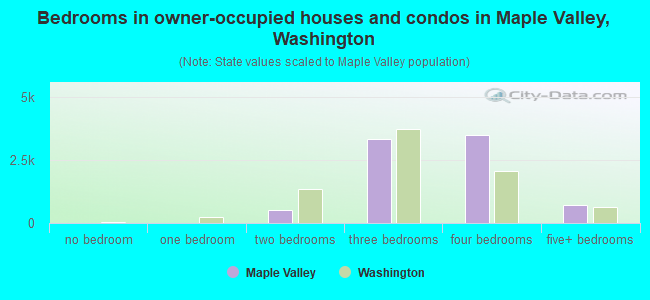
Bedrooms in owner-occupied houses - no bedrooms (%)
Bedrooms in owner-occupied houses - 1 bedroom (%)
Bedrooms in owner-occupied houses - 2 bedrooms (%)
Bedrooms in owner-occupied houses - 3 bedrooms (%)
Bedrooms in owner-occupied houses - 4 bedrooms (%)
Bedrooms in owner-occupied houses - 5+ bedrooms (%)
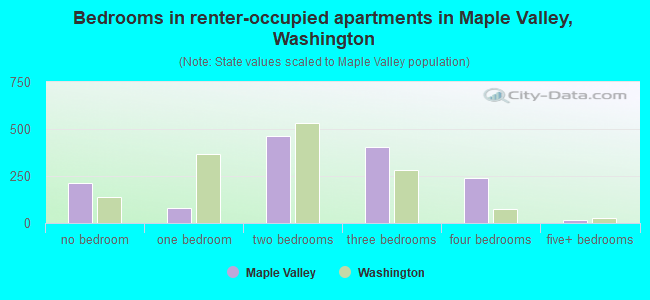
Bedrooms in renter-occupied houses - no bedrooms (%)
Bedrooms in renter-occupied houses - 1 bedroom (%)
Bedrooms in renter-occupied houses - 2 bedrooms (%)
Bedrooms in renter-occupied houses - 3 bedrooms (%)
Bedrooms in renter-occupied houses - 4 bedrooms (%)
Bedrooms in renter-occupied houses - 5+ bedrooms (%)
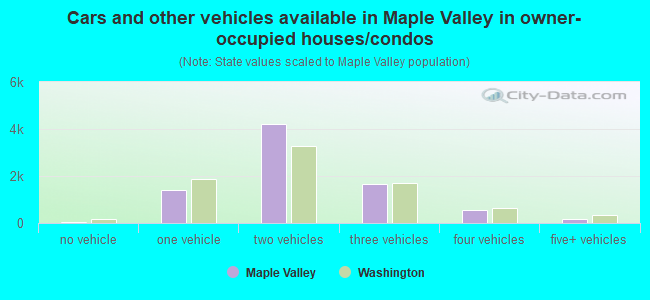
Vehicles available in owner-occupied houses - no vehicle available (%)
Vehicles available in owner-occupied houses - 1 vehicle available(%)
Vehicles available in owner-occupied houses - 2 Vehicles available (%)
Vehicles available in owner-occupied houses - 3 Vehicles available (%)
Vehicles available in owner-occupied houses - 4 Vehicles available (%)
Vehicles available in owner-occupied houses - 5+ Vehicles available (%)
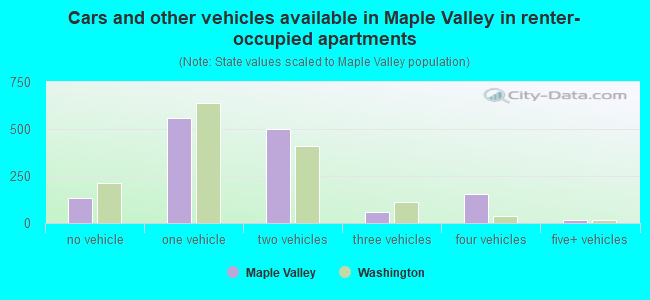
Vehicles available in renter-occupied houses - no vehicle available (%)
Vehicles available in renter-occupied houses - 1 vehicle available (%)
Vehicles available in renter-occupied houses - 2 Vehicles available (%)
Vehicles available in renter-occupied houses - 3 Vehicles available (%)
Vehicles available in renter-occupied houses - 4 Vehicles available (%)
Vehicles available in renter-occupied houses - 5+ Vehicles available (%)
Housing units in structures - 1, detached (%)
Housing units in structures - 1, attached (%)
Housing units in structures - 2 (%)
Housing units in structures - 3 or 4 (%)
Housing units in structures - 5 to 9 (%)
Housing units in structures - 10 to 19 (%)
Housing units in structures - 20 to 49 (%)
Housing units in structures - 50 or more (%)
Housing units in structures - Mobile home (%)
Housing units in structures - Boat, RV, van, etc. (%)
Housing units in structures - Owners - 1, detached (%)
Housing units in structures - Owners - 1, attached (%)
Housing units in structures - Owners - 2 (%)
Housing units in structures - Owners - 3 or 4 (%)
Housing units in structures - Owners - 5 to 9 (%)
Housing units in structures - Owners - 10 to 19 (%)
Housing units in structures - Owners - 20 to 49 (%)
Housing units in structures - Owners - 50 or more (%)
Housing units in structures - Owners - Mobile home (%)
Housing units in structures - Owners - Boat, RV, van, etc. (%)
Housing units in structures - Renters - 1, detached (%)
Housing units in structures - Renters - 1, attached (%)
Housing units in structures - Renters - 2 (%)
Housing units in structures - Renters - 3 or 4 (%)
Housing units in structures - Renters - 5 to 9 (%)
Housing units in structures - Renters - 10 to 19 (%)
Housing units in structures - Renters - 20 to 49 (%)
Housing units in structures - Renters - 50 or more (%)
Housing units in structures - Renters - Mobile home (%)
Housing units in structures - Renters - Boat, RV, van, etc. (%)
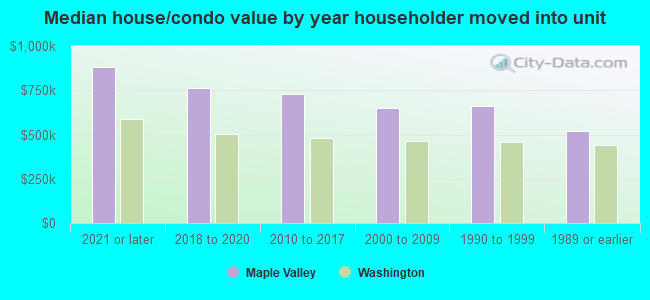
House/condo owner moved in on average (years ago)
Renter moved in on average (years ago)
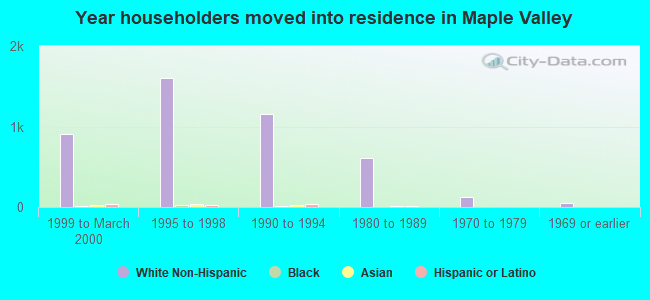
Year householder moved into unit - Moved in 1999 to March 2000 (%)
Year householder moved into unit - Moved in 1999 to March 2000 (%) - White
Year householder moved into unit - Moved in 1999 to March 2000 (%) - Black or African American
Year householder moved into unit - Moved in 1999 to March 2000 (%) - Asian
Year householder moved into unit - Moved in 1999 to March 2000 (%) - Hispanic or Latino
Year householder moved into unit - Moved in 1999 to March 2000 (%) - American Indian and Alaska Native
Year householder moved into unit - Moved in 1999 to March 2000 (%) - Multirace
Year householder moved into unit - Moved in 1999 to March 2000 (%) - Other Race
Year householder moved into unit - Moved in 1995 to 1998 (%)
Year householder moved into unit - Moved in 1995 to 1998 (%) - White
Year householder moved into unit - Moved in 1995 to 1998 (%) - Black or African American
Year householder moved into unit - Moved in 1995 to 1998 (%) - Asian
Year householder moved into unit - Moved in 1995 to 1998 (%) - Hispanic or Latino
Year householder moved into unit - Moved in 1995 to 1998 (%) - American Indian and Alaska Native
Year householder moved into unit - Moved in 1995 to 1998 (%) - Multirace
Year householder moved into unit - Moved in 1995 to 1998 (%) - Other Race
Year householder moved into unit - Moved in 1990 to 1994 (%)
Year householder moved into unit - Moved in 1990 to 1994 (%) - White
Year householder moved into unit - Moved in 1990 to 1994 (%) - Black or African American
Year householder moved into unit - Moved in 1990 to 1994 (%) - Asian
Year householder moved into unit - Moved in 1990 to 1994 (%) - Hispanic or Latino
Year householder moved into unit - Moved in 1990 to 1994 (%) - American Indian and Alaska Native
Year householder moved into unit - Moved in 1990 to 1994 (%) - Multirace
Year householder moved into unit - Moved in 1990 to 1994 (%) - Other Race
Year householder moved into unit - Moved in 1980 to 1989 (%)
Year householder moved into unit - Moved in 1980 to 1989 (%) - White
Year householder moved into unit - Moved in 1980 to 1989 (%) - Black or African American
Year householder moved into unit - Moved in 1980 to 1989 (%) - Asian
Year householder moved into unit - Moved in 1980 to 1989 (%) - Hispanic or Latino
Year householder moved into unit - Moved in 1980 to 1989 (%) - American Indian and Alaska Native
Year householder moved into unit - Moved in 1980 to 1989 (%) - Multirace
Year householder moved into unit - Moved in 1980 to 1989 (%) - Other Race
Year householder moved into unit - Moved in 1970 to 1979 (%)
Year householder moved into unit - Moved in 1970 to 1979 (%) - White
Year householder moved into unit - Moved in 1970 to 1979 (%) - Black or African American
Year householder moved into unit - Moved in 1970 to 1979 (%) - Asian
Year householder moved into unit - Moved in 1970 to 1979 (%) - Hispanic or Latino
Year householder moved into unit - Moved in 1970 to 1979 (%) - American Indian and Alaska Native
Year householder moved into unit - Moved in 1970 to 1979 (%) - Multirace
Year householder moved into unit - Moved in 1970 to 1979 (%) - Other Race
Year householder moved into unit - Moved in 1969 or earlier (%)
Year householder moved into unit - Moved in 1969 or earlier (%) - White
Year householder moved into unit - Moved in 1969 or earlier (%) - Black or African American
Year householder moved into unit - Moved in 1969 or earlier (%) - Asian
Year householder moved into unit - Moved in 1969 or earlier (%) - Hispanic or Latino
Year householder moved into unit - Moved in 1969 or earlier (%) - American Indian and Alaska Native
Year householder moved into unit - Moved in 1969 or earlier (%) - Multirace
Year householder moved into unit - Moved in 1969 or earlier (%) - Other Race
Housing units lacking complete plumbing facilities (%)
Housing units lacking complete kitchen facilities (%)
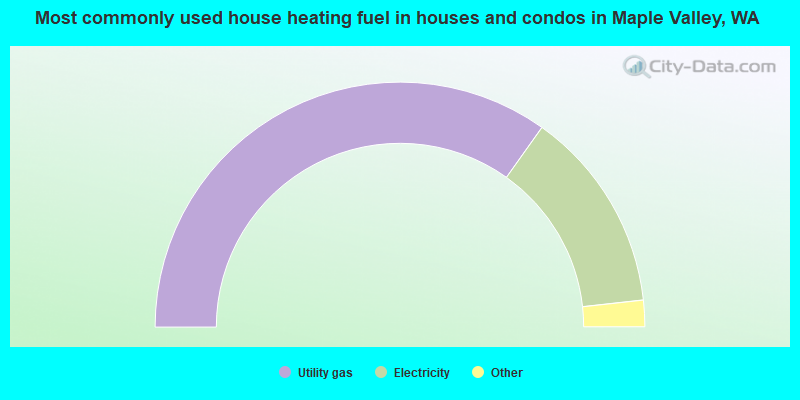
House heating fuel used in houses and condos - Utility gas (%)
House heating fuel used in houses and condos - Bottled, tank, or LP gas (%)
House heating fuel used in houses and condos - Electricity (%)
House heating fuel used in houses and condos - Fuel oil, kerosene, etc. (%)
House heating fuel used in houses and condos - Coal or coke (%)
House heating fuel used in houses and condos - Wood (%)
House heating fuel used in houses and condos - Solar energy (%)
House heating fuel used in houses and condos - Other fuel (%)
House heating fuel used in houses and condos - No fuel used (%)
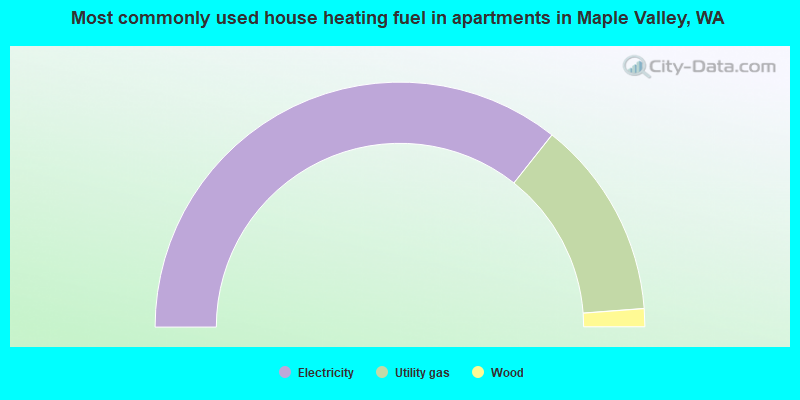
House heating fuel used in apartments - Utility gas (%)
House heating fuel used in apartments - Bottled, tank, or LP gas (%)
House heating fuel used in apartments - Electricity (%)
House heating fuel used in apartments - Fuel oil, kerosene, etc. (%)
House heating fuel used in apartments - Coal or coke (%)
House heating fuel used in apartments - Wood (%)
House heating fuel used in apartments - Solar energy (%)
House heating fuel used in apartments - Other fuel (%)
House heating fuel used in apartments - No fuel used (%)
Median year house/condo built: 2001Median year apartment built: 1998Household type by relationship:
Households: 28,042
Male householders: 5,188 (553 living alone ), Female householders: 4,055 (639 living alone )6,297 spouses (6,244 opposite-sex spouses ), 377 unmarried partners , (377 opposite-sex unmarried partners ), 10,380 children (10,090 natural , 151 adopted , 138 stepchildren ), 508 grandchildren , 122 brothers or sisters , 374 parents , 0 foster children , 394 other relatives , 335 non-relatives In group quarters: 8
Size of family households: 2,459 2-persons , 1,747 3-persons , 2,085 4-persons , 888 5-persons , 213 6-persons , 157 7-or-more-persons .
Size of nonfamily households: 1,282 1-person , 347 2-persons , 26 3-persons .
6,517 married couples with children. single-parent households (297 men , 1,527 women ).
83.4% of residents of Maple Valley speak English at home. of residents speak Spanish at home (91% speak English very well , 9% speak English not well ).of residents speak other Indo-European language at home (81% speak English very well , 14% speak English well , 4% speak English not well , 1% don't speak English at all ).of residents speak Asian or Pacific Island language at home (79% speak English very well , 17% speak English well , 4% speak English not well ).of residents speak other language at home (97% speak English very well , 3% speak English well ).
Foreign born population: 3,663 (13.1%)of them are naturalized citizens )
Median number of rooms in houses and condos:
Median number of rooms in apartments
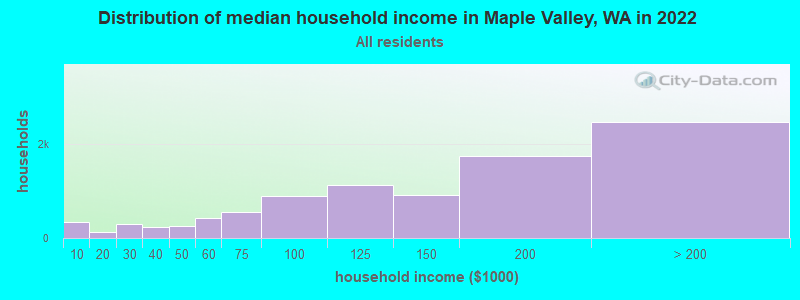
Maple Valley, WA household income distribution 340 Less than $10,000130 $10,000 to $19,999302 $20,000 to $29,999234 $30,000 to $39,999263 $40,000 to $49,999419 $50,000 to $59,999546 $60,000 to $74,999898 $75,000 to $99,9991,137 $100,000 to $124,999917 $125,000 to $149,9991,742 $150,000 to $199,9992,478 $200,000 or more
Home value of owner - occupied houses in 2022 in Maple Valley, WA 55 Less than $10,0006 $40,000 to $49,99927 $50,000 to $59,99919 $70,000 to $79,99910 $200,000 to $249,99919 $250,000 to $299,999315 $300,000 to $399,999974 $400,000 to $499,9993,563 $500,000 to $749,9991,657 $750,000 to $999,999414 $1,000,000 to $1,499,9997 $1,500,000 to $1,999,99911 $2,000,000 or moreRent paid by renters in 2022 in Maple Valley, WA 32 $900 to $999147 $1,000 to $1,249217 $1,250 to $1,499383 $1,500 to $1,999380 $2,000 to $2,499183 $2,500 to $2,99930 $3,000 to $3,49921 $3,500 or more
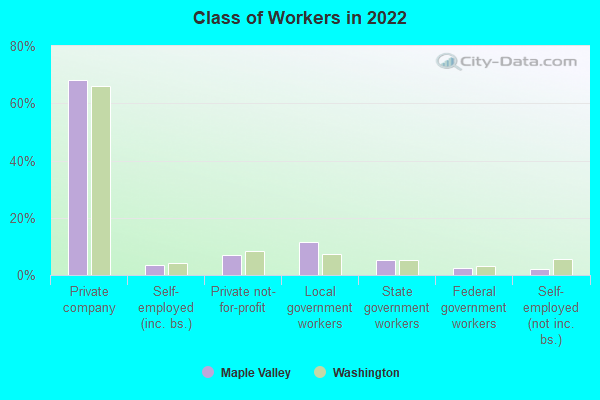
Percentage of workers working in this county: 94.1%Number of people working at home: 3,238 (24.2% of all workers )
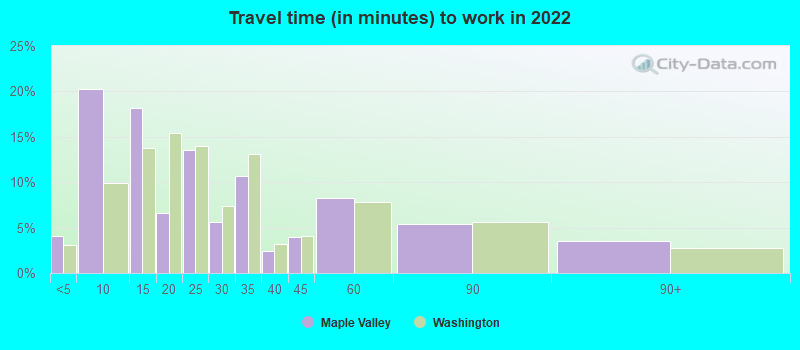
Travel time to work (commute)
Less than 5 minutes: 2425 to 9 minutes: 91910 to 14 minutes: 71815 to 19 minutes: 37220 to 24 minutes: 33925 to 29 minutes: 49630 to 34 minutes: 1,77235 to 39 minutes: 71140 to 44 minutes: 61245 to 59 minutes: 1,72560 to 89 minutes: 1,07190 or more minutes: 430
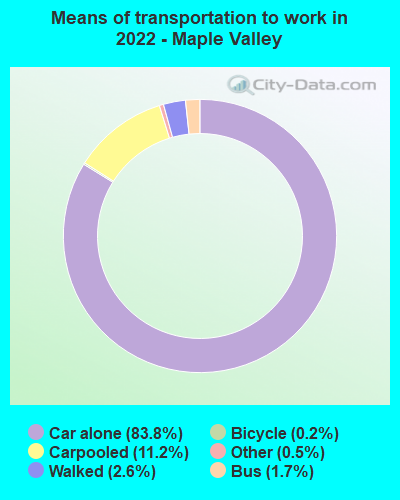
Means of transportation to work:
Drove a car alone: 4,120 (54.9%)Carpooled: 529 (7.1%)Bus : 52 (0.7%)Taxi: 22 (0.3%)Bicycle: 7 (0.1%)Walked: 115 (1.5%)Worked at home: 3,238 (43.2%)
Unemployment by race in 2022
Unemployment rate for White non-Hispanic residents 4.4% Males4.7% FemalesUnemployment rate for Asian residents 2.3% Males3.6% FemalesUnemployment rate for other race residents 5.5% FemalesUnemployment rate for two or more race residents 2.6% Males1.1% FemalesUnemployment rate for Hispanic or Latino residents 1.4% Females
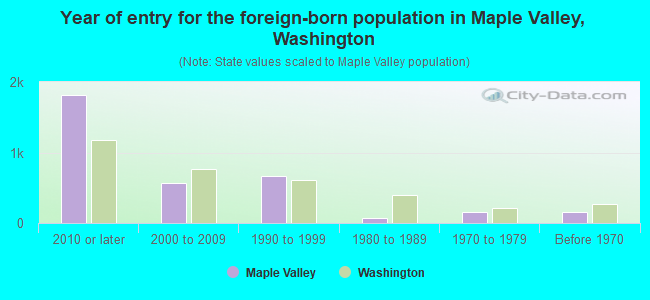
Year of entry for the foreign-born population in Maple Valley, Washington
1,819 2010 or later 562 2000 to 2009 673 1990 to 1999 71 1980 to 1989 152 1970 to 1979 151 Before 1970
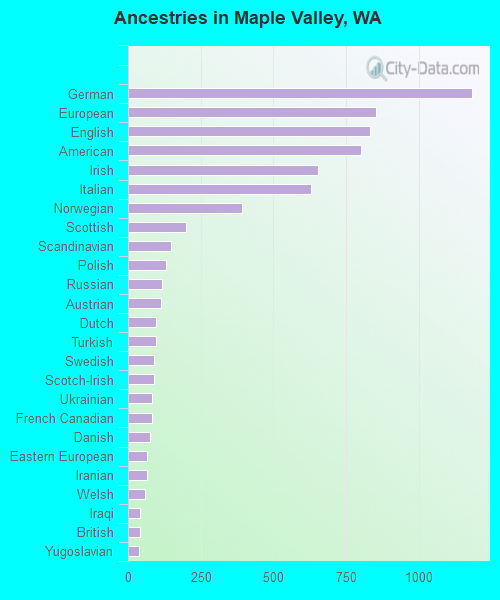
First ancestries reported:
German: 1,183 (9.6%)
European: 855 (6.9%)
English: 831 (6.7%)
American: 801 (6.5%)
Irish: 655 (5.3%)
Italian: 630 (5.1%)
Norwegian: 393 (3.2%)
Scottish: 200 (1.6%)
Scandinavian: 147 (1.2%)
Polish: 132 (1.1%)
Russian: 117 (0.9%)
Austrian: 113 (0.9%)
Dutch: 98 (0.8%)
Turkish: 97 (0.8%)
Swedish: 88 (0.7%)
Scotch-Irish: 88 (0.7%)
Ukrainian: 84 (0.7%)
French Canadian: 81 (0.7%)
Danish: 75 (0.6%)
Eastern European: 65 (0.5%)
Iranian: 64 (0.5%)
Welsh: 59 (0.5%)
Iraqi: 43 (0.3%)
British: 40 (0.3%)
Yugoslavian: 37 (0.3%)
Czechoslovakian: 35 (0.3%)
French: 30 (0.2%)
Jamaican: 29 (0.2%)
Swiss: 23 (0.2%)
Syrian: 20 (0.2%)
Croatian: 18 (0.1%)
Finnish: 17 (0.1%)
Ethiopian: 16 (0.1%)
Northern European: 14 (0.1%)
Brazilian: 12 (0.10%)
Lebanese: 7 (0.06%)
Trinidadian and Tobagonian: 6 (0.05%)
Greek: 5 (0.04%) Most common places of birth for foreign-born residents (%): India Maple Valley:
32.6% (1,195)Washington:
8.9% (101,353)
Philippines Maple Valley:
8.5% (313)Washington:
6.3% (71,661)
Korea Maple Valley:
7.1% (259)Washington:
4.3% (48,886)
Uzbekistan Maple Valley:
4.4% (160)Washington:
0.2% (2,695)
Russia Maple Valley:
4.0% (146)Washington:
1.9% (21,540)
Ukraine Maple Valley:
3.8% (141)Washington:
3.1% (35,872)
China, excluding Hong Kong and Taiwan Maple Valley:
3.7% (134)Washington:
7.4% (84,470)
Canada Maple Valley:
3.4% (124)Washington:
4.1% (47,238)
Mexico Maple Valley:
2.9% (107)Washington:
21.1% (241,655)
Germany Maple Valley:
2.8% (102)Washington:
1.6% (17,761)
Vietnam Maple Valley:
2.0% (74)Washington:
5.4% (62,003)
Poland Maple Valley:
1.7% (64)Washington:
0.4% (4,963)
Taiwan Maple Valley:
1.6% (59)Washington:
1.5% (16,607)
Brazil Maple Valley:
1.6% (58)Washington:
0.8% (9,359)
Place of birth for U.S.-born residents:
This state: 12,906Other state: 10,758Northeast: 955Midwest: 2,425South: 1,558West: 5,812 86.3% of Maple Valley residents lived in the same house 1 years ago.
Out of people who lived in different houses, 44.9% lived in this county.
Out of people who lived in different counties, 19.3% lived in Washington.
Maple Valley:
86.3%State average:
85.2%
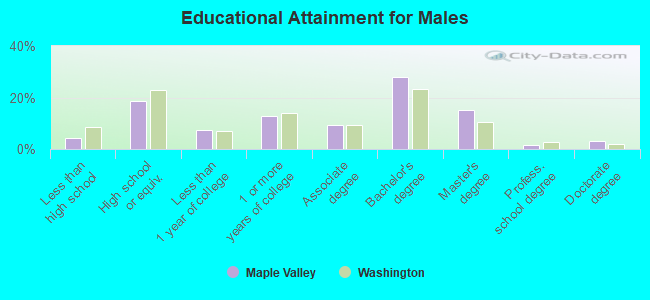
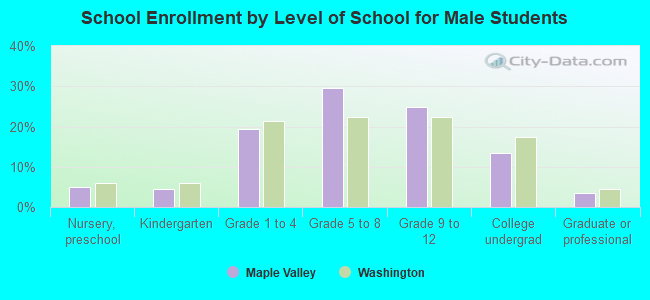
Education attainment for males 25 years and older:
No schooling: 57Nursery to 4th grade: 05th and 6th grade: 07th and 8th grade: 109th grade: 010th grade: 011th grade: 6712th grade, no diploma: 234High school graduate (or equivalency): 1,583Less than 1 year of college: 631Some college more than 1 year, no degree: 1,081Associate degree: 783Bachelor's degree: 2,397Master's degree: 1,296Professional school degree: 127Doctorate degree: 263
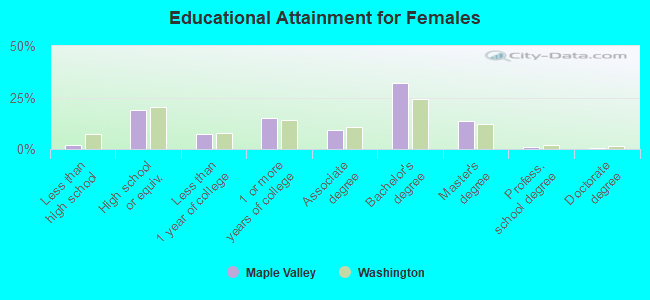
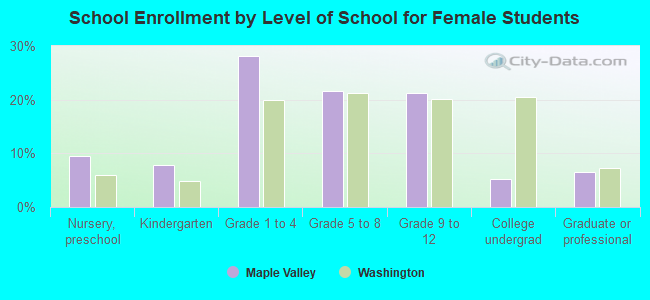
Education attainment for females 25 years and older:
No schooling: 66Nursery to 4th grade: 05th and 6th grade: 177th and 8th grade: 09th grade: 010th grade: 011th grade: 1812th grade, no diploma: 66High school graduate (or equivalency): 1,661Less than 1 year of college: 654Some college more than 1 year, no degree: 1,347Associate degree: 800Bachelor's degree: 2,860Master's degree: 1,215Professional school degree: 98Doctorate degree: 57
Housing units in structures:
One, detached: 8,392One, attached: 480Two: 243 or 4: 2065 to 9: 9710 to 19: 26620 to 49: 1950 or more: 153Mobile homes: 70Median worth of mobile homes: $494,704
Housing units lacking complete kitchen facilities in 2022: 2.5%House/condo owner moved in on average 8 years ago
Renter moved in on average 3 years ago
Private vs. public school enrollment:
Students in private schools in grades 1 to 8 (elementary and middle school): 286 Here:
6.5%Washington:
12.4%
Students in private schools in grades 9 to 12 (high school): 79 Students in private undergraduate colleges: 222 Here:
27.4%Washington:
16.5%