Mill Creek, WA (Washington) Houses and Residents
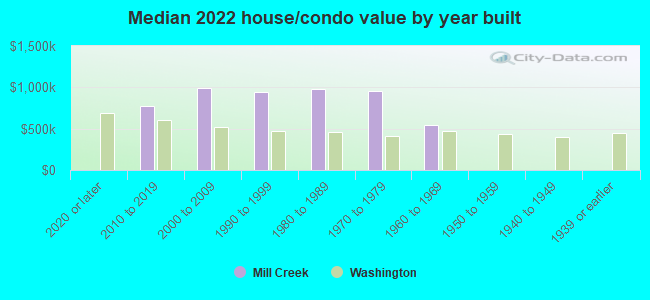
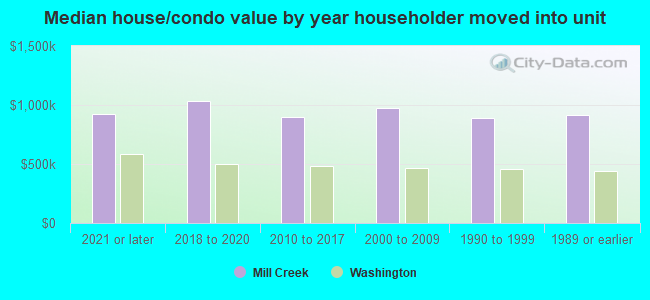
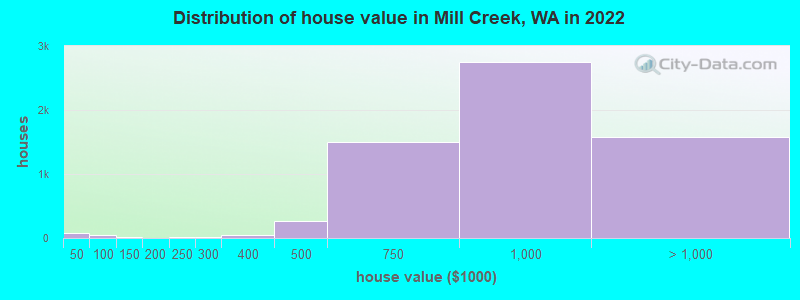
Estimated median house or condo value in 2022: $935,413 (it was $296,300 in 2000 )
Mill Creek:
$935,413Washington:
$569,500
Lower value quartile - upper value quartile: $706,539 - $1,119,582Total population: 19,200 (Urban population: 11,444, Rural population: 0)
Houses: 9,296 (8,646 occupied: 5,210 owner occupied, 3,364 renter occupied )
% of renters here:
39%State:
36%
Housing density: 2,606 houses/condos per square mile
Median price asked for vacant for-sale houses and condos in 2022: $498,134.
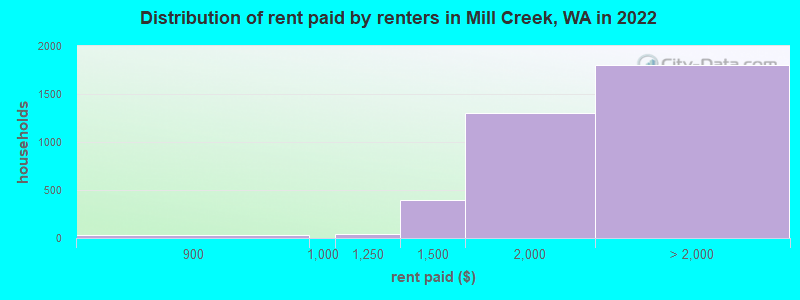
Median contract rent in 2022: over $2,000 (lower quartile is $1,703, upper quartile is over $2,000)
Median rent asked for vacant for-rent units in 2022: $2,226
Median gross rent in Mill Creek, WA in 2022: over $2,000
Housing units in Mill Creek with a mortgage: 3,721 (438 second mortgage, 16 home equity loan, 302 both second mortgage and home equity loan )Houses without a mortgage: 177
Median household income for houses/condos with a mortgage: $167,408
Median household income for apartments without a mortgage: $100,498
Median monthly housing costs: $2,166
Data:
Median house or condo value ($)
Median house or condo value ($ change since 2000)
Median house or condo value ($) - White
Median house or condo value ($) - Black or African American
Median house or condo value ($) - Asian
Median house or condo value ($) - Hispanic or Latino
Median house or condo value ($) - American Indian and Alaska Native
Median house or condo value ($) - Multirace
Median house or condo value ($) - Other Race
Median price asked for mobile homes ($)
Household density (households per square mile)
Mean house or condo value by units in structure - 1, detached ($)
Mean house or condo value by units in structure - 1, attached ($)
Mean house or condo value by units in structure - 2 ($)
Mean house or condo value by units in structure by units in structure - 3 or 4 ($)
Mean house or condo value by units in structure - 5 or more ($)
Mean house or condo value by units in structure - Boat, RV, van, etc. ($)
Mean house or condo value by units in structure - Mobile home ($)
Median contract rent ($)
Median contract rent - Lower quartile ($)
Median contract rent - Upper quartile ($)
Median gross rent ($)
Urban houses (%)
Rural houses (%)
Houses occupied (%)
Houses occupied (% change since 2000)
Houses owner occupied (%)
Houses owner occupied (% change since 2000)
Houses renter occupied (%)
Houses renter occupied (% change since 2000)
Vacant housing units - For rent (%)
Vacant housing units - For rent (% change since 2000)
Vacant housing units - For sale only (%)
Vacant housing units - For sale only (% change since 2000)
Vacant housing units - Rented or sold, not occupied (%)
Vacant housing units - Rented or sold, not occupied (% change since 2000)
Vacant housing units - For seasonal, recreational, or occasional use (%)
Vacant housing units - For seasonal, recreational, or occasional use (% change since 2000)
Vacant housing units - For migrant workers (%)
Vacant housing units - For migrant workers (% change since 2000)
Vacant housing units - Other vacant (%)
Vacant housing units - Other vacant (% change since 2000)
Median monthly housing costs ($)
Median household income for houses/condos with a mortgage ($)
Median household income for houses/condos without a mortgage ($)
Median household income ($)
Median household income ($) - White
Median household income ($) - Black or African American
Median household income ($) - Asian
Median household income ($) - Hispanic or Latino
Median household income ($) - American Indian and Alaska Native
Median household income ($) - Multirace
Median household income ($) - Other Race
Mortgage status - with mortgage (%)
Mortgage status - with second mortgage (%)
Mortgage status - with home equity loan (%)
Mortgage status - with both second mortgage and home equity loan (%)
Mortgage status - without a mortgage (%)
Median year house/condo built
Median year apartment built
Household type by relationship - Male householder living alone (%)
Household type by relationship - Male householder not living alone (%)
Household type by relationship - Female householder living alone (%)
Household type by relationship - Female householder not living alone (%)
Household type by relationship - Opposite-Sex spouse (%)
Household type by relationship - Same-Sex spouse (%)
Household type by relationship - Opposite-Sex unmarried partner (%)
Household type by relationship - Same-Sex unmarried partner (%)
Household type by relationship - In group quarters (%)
Size of family households - 2-person household (%)
Size of family households - 3-person household (%)
Size of family households - 4-person household (%)
Size of family households - 5-person household (%)
Size of family households - 6-person household (%)
Size of family households - 7-or-more-person household (%)
Size of nonfamily households - 1-person household (%)
Size of nonfamily households - 2-person household (%)
Size of nonfamily households - 3-person household (%)
Size of nonfamily households - 4-person household (%)
Size of nonfamily households - 5-person household (%)
Size of nonfamily households - 6-person household (%)
Size of nonfamily households - 7-or-moreperson household (%)
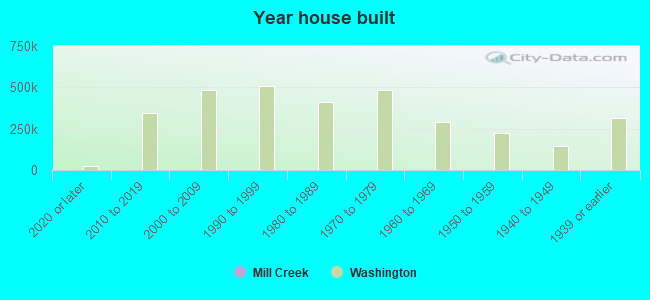
Year house built - Built 2010 or later (%)
Year house built - Built 2000 to 2009 (%)
Year house built - Built 1990 to 1999 (%)
Year house built - Built 1980 to 1989 (%)
Year house built - Built 1970 to 1979 (%)
Year house built - Built 1960 to 1969 (%)
Year house built - Built 1950 to 1959 (%)
Year house built - Built 1940 to 1949 (%)
Year house built - Built 1939 or earlier (%)
Median number of rooms in houses and condos
Median number of rooms in apartments
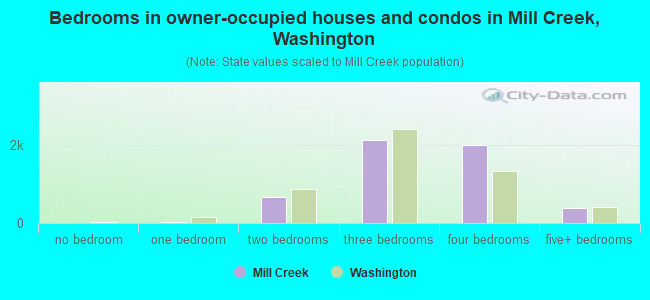
Median number of bedrooms in owner occupied houses
Mean number of bedrooms in owner occupied houses
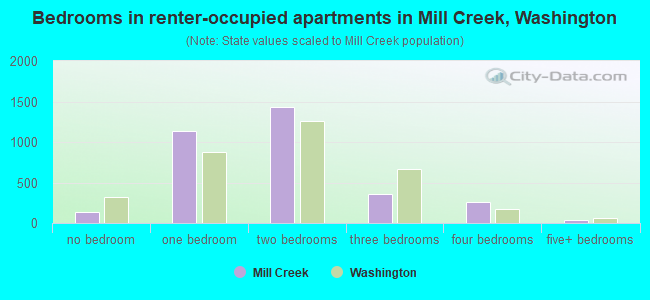
Median number of bedrooms in renter occupied houses
Mean number of bedrooms in renter occupied houses
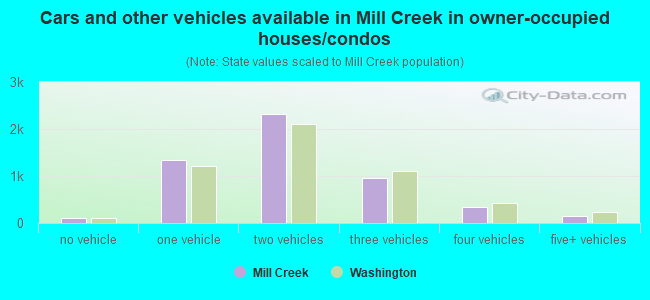
Median number of vehichles in owner occupied houses
Mean number of vehichles in owner occupied houses
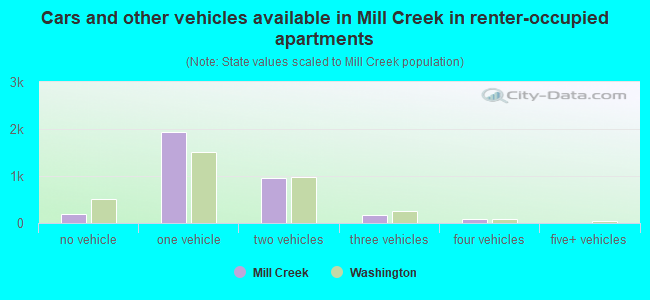
Median number of vehichles in renter occupied houses
Mean number of vehichles in renter occupied houses
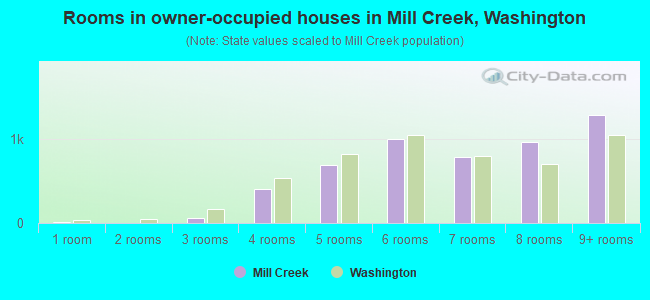
Rooms in owner-occupied houses - 1 room (%)
Rooms in owner-occupied houses - 2 rooms (%)
Rooms in owner-occupied houses - 3 rooms (%)
Rooms in owner-occupied houses - 4 rooms (%)
Rooms in owner-occupied houses - 5 rooms (%)
Rooms in owner-occupied houses - 6 rooms (%)
Rooms in owner-occupied houses - 7 rooms (%)
Rooms in owner-occupied houses - 8 rooms (%)
Rooms in owner-occupied houses - 9+ rooms (%)
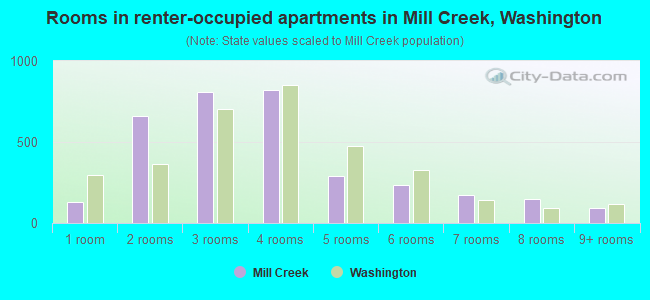
Rooms in renter-occupied houses - 1 room (%)
Rooms in renter-occupied houses - 2 rooms (%)
Rooms in renter-occupied houses - 3 rooms (%)
Rooms in renter-occupied houses - 4 rooms (%)
Rooms in renter-occupied houses - 5 rooms (%)
Rooms in renter-occupied houses - 6 rooms (%)
Rooms in renter-occupied houses - 7 rooms (%)
Rooms in renter-occupied houses - 8 rooms (%)
Rooms in renter-occupied houses - 9+ rooms (%)
Bedrooms in owner-occupied houses - no bedrooms (%)
Bedrooms in owner-occupied houses - 1 bedroom (%)
Bedrooms in owner-occupied houses - 2 bedrooms (%)
Bedrooms in owner-occupied houses - 3 bedrooms (%)
Bedrooms in owner-occupied houses - 4 bedrooms (%)
Bedrooms in owner-occupied houses - 5+ bedrooms (%)
Bedrooms in renter-occupied houses - no bedrooms (%)
Bedrooms in renter-occupied houses - 1 bedroom (%)
Bedrooms in renter-occupied houses - 2 bedrooms (%)
Bedrooms in renter-occupied houses - 3 bedrooms (%)
Bedrooms in renter-occupied houses - 4 bedrooms (%)
Bedrooms in renter-occupied houses - 5+ bedrooms (%)
Vehicles available in owner-occupied houses - no vehicle available (%)
Vehicles available in owner-occupied houses - 1 vehicle available(%)
Vehicles available in owner-occupied houses - 2 Vehicles available (%)
Vehicles available in owner-occupied houses - 3 Vehicles available (%)
Vehicles available in owner-occupied houses - 4 Vehicles available (%)
Vehicles available in owner-occupied houses - 5+ Vehicles available (%)
Vehicles available in renter-occupied houses - no vehicle available (%)
Vehicles available in renter-occupied houses - 1 vehicle available (%)
Vehicles available in renter-occupied houses - 2 Vehicles available (%)
Vehicles available in renter-occupied houses - 3 Vehicles available (%)
Vehicles available in renter-occupied houses - 4 Vehicles available (%)
Vehicles available in renter-occupied houses - 5+ Vehicles available (%)
Housing units in structures - 1, detached (%)
Housing units in structures - 1, attached (%)
Housing units in structures - 2 (%)
Housing units in structures - 3 or 4 (%)
Housing units in structures - 5 to 9 (%)
Housing units in structures - 10 to 19 (%)
Housing units in structures - 20 to 49 (%)
Housing units in structures - 50 or more (%)
Housing units in structures - Mobile home (%)
Housing units in structures - Boat, RV, van, etc. (%)
Housing units in structures - Owners - 1, detached (%)
Housing units in structures - Owners - 1, attached (%)
Housing units in structures - Owners - 2 (%)
Housing units in structures - Owners - 3 or 4 (%)
Housing units in structures - Owners - 5 to 9 (%)
Housing units in structures - Owners - 10 to 19 (%)
Housing units in structures - Owners - 20 to 49 (%)
Housing units in structures - Owners - 50 or more (%)
Housing units in structures - Owners - Mobile home (%)
Housing units in structures - Owners - Boat, RV, van, etc. (%)
Housing units in structures - Renters - 1, detached (%)
Housing units in structures - Renters - 1, attached (%)
Housing units in structures - Renters - 2 (%)
Housing units in structures - Renters - 3 or 4 (%)
Housing units in structures - Renters - 5 to 9 (%)
Housing units in structures - Renters - 10 to 19 (%)
Housing units in structures - Renters - 20 to 49 (%)
Housing units in structures - Renters - 50 or more (%)
Housing units in structures - Renters - Mobile home (%)
Housing units in structures - Renters - Boat, RV, van, etc. (%)
House/condo owner moved in on average (years ago)
Renter moved in on average (years ago)
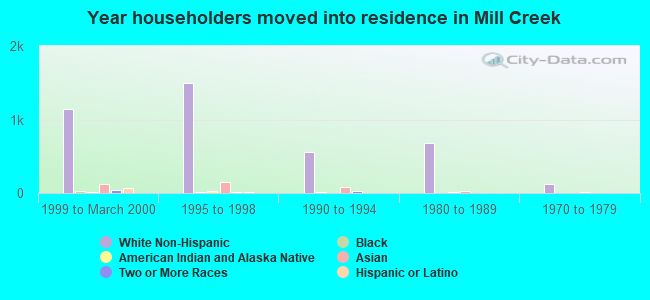
Year householder moved into unit - Moved in 1999 to March 2000 (%)
Year householder moved into unit - Moved in 1999 to March 2000 (%) - White
Year householder moved into unit - Moved in 1999 to March 2000 (%) - Black or African American
Year householder moved into unit - Moved in 1999 to March 2000 (%) - Asian
Year householder moved into unit - Moved in 1999 to March 2000 (%) - Hispanic or Latino
Year householder moved into unit - Moved in 1999 to March 2000 (%) - American Indian and Alaska Native
Year householder moved into unit - Moved in 1999 to March 2000 (%) - Multirace
Year householder moved into unit - Moved in 1999 to March 2000 (%) - Other Race
Year householder moved into unit - Moved in 1995 to 1998 (%)
Year householder moved into unit - Moved in 1995 to 1998 (%) - White
Year householder moved into unit - Moved in 1995 to 1998 (%) - Black or African American
Year householder moved into unit - Moved in 1995 to 1998 (%) - Asian
Year householder moved into unit - Moved in 1995 to 1998 (%) - Hispanic or Latino
Year householder moved into unit - Moved in 1995 to 1998 (%) - American Indian and Alaska Native
Year householder moved into unit - Moved in 1995 to 1998 (%) - Multirace
Year householder moved into unit - Moved in 1995 to 1998 (%) - Other Race
Year householder moved into unit - Moved in 1990 to 1994 (%)
Year householder moved into unit - Moved in 1990 to 1994 (%) - White
Year householder moved into unit - Moved in 1990 to 1994 (%) - Black or African American
Year householder moved into unit - Moved in 1990 to 1994 (%) - Asian
Year householder moved into unit - Moved in 1990 to 1994 (%) - Hispanic or Latino
Year householder moved into unit - Moved in 1990 to 1994 (%) - American Indian and Alaska Native
Year householder moved into unit - Moved in 1990 to 1994 (%) - Multirace
Year householder moved into unit - Moved in 1990 to 1994 (%) - Other Race
Year householder moved into unit - Moved in 1980 to 1989 (%)
Year householder moved into unit - Moved in 1980 to 1989 (%) - White
Year householder moved into unit - Moved in 1980 to 1989 (%) - Black or African American
Year householder moved into unit - Moved in 1980 to 1989 (%) - Asian
Year householder moved into unit - Moved in 1980 to 1989 (%) - Hispanic or Latino
Year householder moved into unit - Moved in 1980 to 1989 (%) - American Indian and Alaska Native
Year householder moved into unit - Moved in 1980 to 1989 (%) - Multirace
Year householder moved into unit - Moved in 1980 to 1989 (%) - Other Race
Year householder moved into unit - Moved in 1970 to 1979 (%)
Year householder moved into unit - Moved in 1970 to 1979 (%) - White
Year householder moved into unit - Moved in 1970 to 1979 (%) - Black or African American
Year householder moved into unit - Moved in 1970 to 1979 (%) - Asian
Year householder moved into unit - Moved in 1970 to 1979 (%) - Hispanic or Latino
Year householder moved into unit - Moved in 1970 to 1979 (%) - American Indian and Alaska Native
Year householder moved into unit - Moved in 1970 to 1979 (%) - Multirace
Year householder moved into unit - Moved in 1970 to 1979 (%) - Other Race
Year householder moved into unit - Moved in 1969 or earlier (%)
Year householder moved into unit - Moved in 1969 or earlier (%) - White
Year householder moved into unit - Moved in 1969 or earlier (%) - Black or African American
Year householder moved into unit - Moved in 1969 or earlier (%) - Asian
Year householder moved into unit - Moved in 1969 or earlier (%) - Hispanic or Latino
Year householder moved into unit - Moved in 1969 or earlier (%) - American Indian and Alaska Native
Year householder moved into unit - Moved in 1969 or earlier (%) - Multirace
Year householder moved into unit - Moved in 1969 or earlier (%) - Other Race
Housing units lacking complete plumbing facilities (%)
Housing units lacking complete kitchen facilities (%)
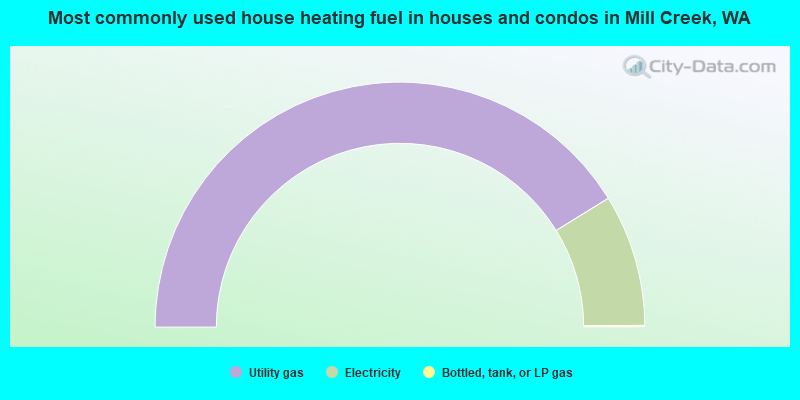
House heating fuel used in houses and condos - Utility gas (%)
House heating fuel used in houses and condos - Bottled, tank, or LP gas (%)
House heating fuel used in houses and condos - Electricity (%)
House heating fuel used in houses and condos - Fuel oil, kerosene, etc. (%)
House heating fuel used in houses and condos - Coal or coke (%)
House heating fuel used in houses and condos - Wood (%)
House heating fuel used in houses and condos - Solar energy (%)
House heating fuel used in houses and condos - Other fuel (%)
House heating fuel used in houses and condos - No fuel used (%)
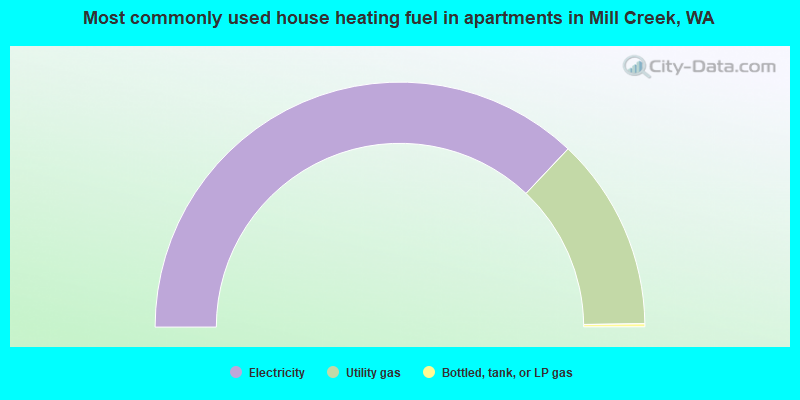
House heating fuel used in apartments - Utility gas (%)
House heating fuel used in apartments - Bottled, tank, or LP gas (%)
House heating fuel used in apartments - Electricity (%)
House heating fuel used in apartments - Fuel oil, kerosene, etc. (%)
House heating fuel used in apartments - Coal or coke (%)
House heating fuel used in apartments - Wood (%)
House heating fuel used in apartments - Solar energy (%)
House heating fuel used in apartments - Other fuel (%)
House heating fuel used in apartments - No fuel used (%)
Median year house/condo built: 1991Median year apartment built: 2002Household type by relationship:
Households: 21,091
Male householders: 4,301 (679 living alone ), Female householders: 4,195 (1,596 living alone )4,707 spouses (4,707 opposite-sex spouses ), 494 unmarried partners , (463 opposite-sex unmarried partners ), 6,084 children (5,391 natural , 532 adopted , 160 stepchildren ), 137 grandchildren , 239 brothers or sisters , 292 parents , 0 foster children , 232 other relatives , 323 non-relatives In group quarters: 83
Size of family households: 2,289 2-persons , 1,186 3-persons , 1,307 4-persons , 591 5-persons , 19 6-persons , 217 7-or-more-persons .
Size of nonfamily households: 2,424 1-person , 498 2-persons , 60 3-persons .
3,943 married couples with children. single-parent households (145 men , 369 women ).
74.8% of residents of Mill Creek speak English at home. of residents speak Spanish at home (72% speak English very well , 20% speak English well , 8% speak English not well ).of residents speak other Indo-European language at home (78% speak English very well , 17% speak English well , 5% speak English not well ).of residents speak Asian or Pacific Island language at home (70% speak English very well , 18% speak English well , 10% speak English not well , 1% don't speak English at all ).of residents speak other language at home (71% speak English very well , 29% speak English well ).
Foreign born population: 5,029 (23.8%)of them are naturalized citizens )
Median number of rooms in houses and condos:
Median number of rooms in apartments
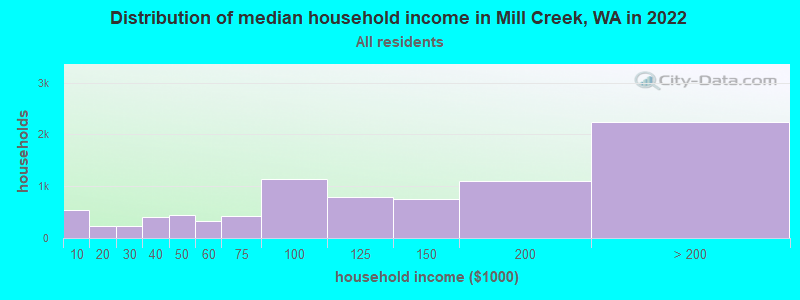
Mill Creek, WA household income distribution 550 Less than $10,000236 $10,000 to $19,999241 $20,000 to $29,999410 $30,000 to $39,999451 $40,000 to $49,999327 $50,000 to $59,999432 $60,000 to $74,9991,149 $75,000 to $99,999794 $100,000 to $124,999762 $125,000 to $149,9991,105 $150,000 to $199,9992,241 $200,000 or more
Home value of owner - occupied houses in 2022 in Mill Creek, WA 72 Less than $10,0006 $30,000 to $34,99943 $70,000 to $79,99921 $100,000 to $124,99913 $200,000 to $249,99914 $250,000 to $299,99945 $300,000 to $399,999261 $400,000 to $499,9991,492 $500,000 to $749,9992,756 $750,000 to $999,9991,236 $1,000,000 to $1,499,999251 $1,500,000 to $1,999,99991 $2,000,000 or moreRent paid by renters in 2022 in Mill Creek, WA 15 $200 to $24933 $800 to $89942 $1,000 to $1,249395 $1,250 to $1,4991,302 $1,500 to $1,999948 $2,000 to $2,499672 $2,500 to $2,99994 $3,000 to $3,49945 $3,500 or more43 No cash rent
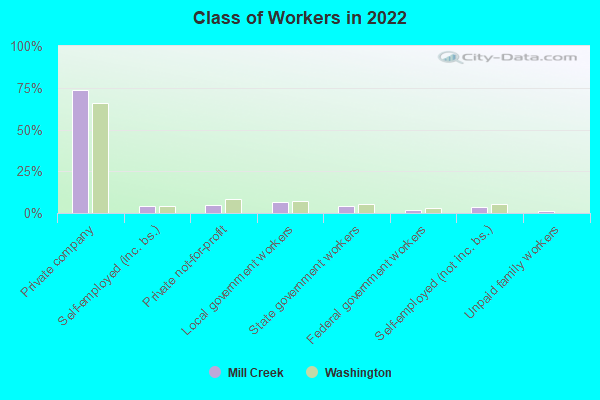
Percentage of workers working in this county: 64.9%Number of people working at home: 3,773 (33.9% of all workers )
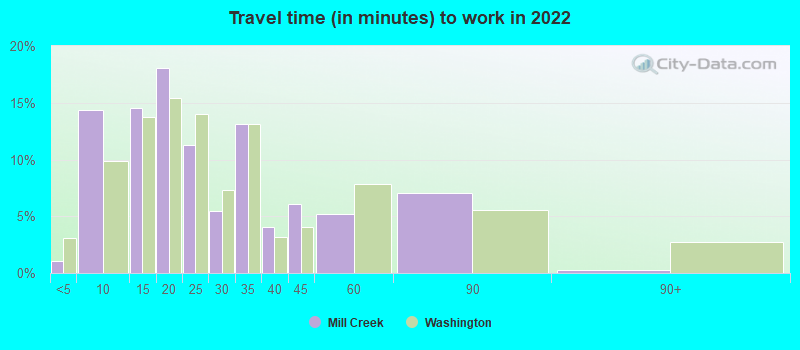
Travel time to work (commute)
Less than 5 minutes: 185 to 9 minutes: 34010 to 14 minutes: 54815 to 19 minutes: 70520 to 24 minutes: 1,04925 to 29 minutes: 75530 to 34 minutes: 1,14435 to 39 minutes: 38940 to 44 minutes: 64545 to 59 minutes: 1,13560 to 89 minutes: 76190 or more minutes: 218
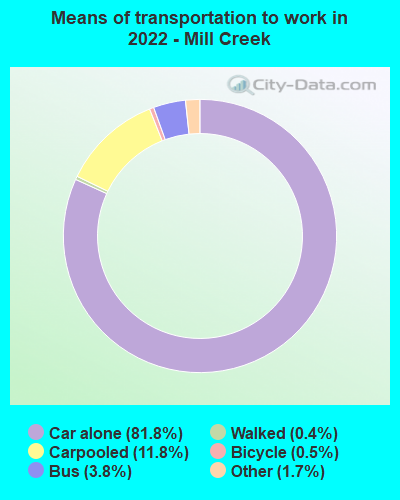
Means of transportation to work:
Drove a car alone: 3,844 (47.8%)Carpooled: 594 (7.4%)Bus : 242 (3.0%)Ferryboat: 2 (0.0%)Taxi: 93 (1.2%)Bicycle: 12 (0.1%)Walked: 22 (0.3%)Worked at home: 3,773 (46.9%)
Unemployment by race in 2022
Unemployment rate for White non-Hispanic residents 5.8% Males1.0% FemalesUnemployment rate for Black residents 7.6% Males21.6% FemalesUnemployment rate for Asian residents 2.0% Males3.2% FemalesUnemployment rate for two or more race residents 21.0% Females
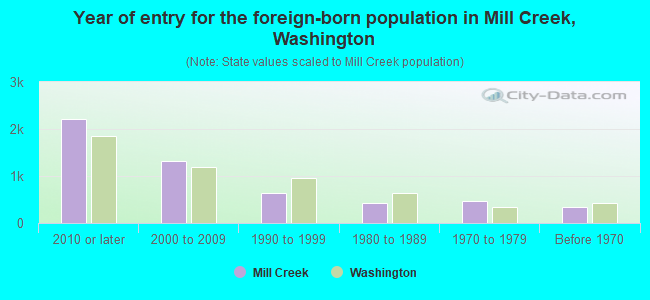
Year of entry for the foreign-born population in Mill Creek, Washington
2,210 2010 or later 1,317 2000 to 2009 630 1990 to 1999 426 1980 to 1989 466 1970 to 1979 330 Before 1970
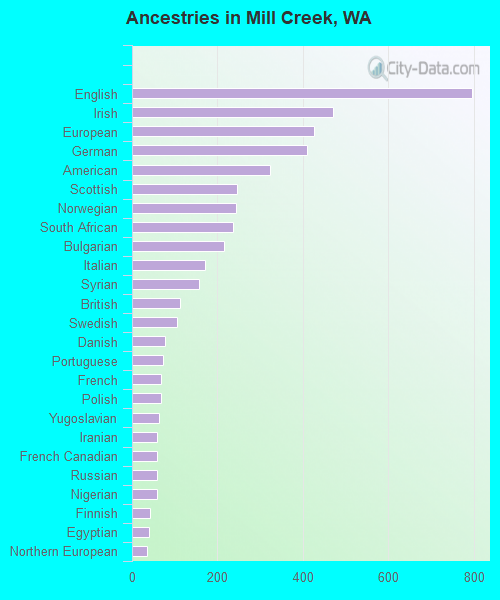
First ancestries reported:
English: 796 (7.6%)
Irish: 470 (4.5%)
European: 427 (4.1%)
German: 409 (3.9%)
American: 322 (3.1%)
Scottish: 245 (2.3%)
Norwegian: 243 (2.3%)
South African: 237 (2.3%)
Bulgarian: 216 (2.1%)
Italian: 172 (1.6%)
Syrian: 157 (1.5%)
British: 113 (1.1%)
Swedish: 105 (1.0%)
Danish: 78 (0.7%)
Portuguese: 73 (0.7%)
French: 68 (0.6%)
Polish: 67 (0.6%)
Yugoslavian: 63 (0.6%)
Iranian: 59 (0.6%)
French Canadian: 59 (0.6%)
Russian: 58 (0.6%)
Nigerian: 58 (0.6%)
Finnish: 42 (0.4%)
Egyptian: 39 (0.4%)
Northern European: 35 (0.3%)
Scandinavian: 33 (0.3%)
Dutch: 31 (0.3%)
Czechoslovakian: 31 (0.3%)
Austrian: 30 (0.3%)
Hungarian: 24 (0.2%)
Canadian: 23 (0.2%)
Icelander: 21 (0.2%)
Scotch-Irish: 21 (0.2%)
Belgian: 21 (0.2%)
Australian: 20 (0.2%)
Greek: 15 (0.1%)
Serbian: 14 (0.1%)
Arab: 12 (0.1%)
Slovak: 10 (0.10%)
Welsh: 9 (0.09%)
Romanian: 7 (0.07%)
Ukrainian: 4 (0.04%) Most common places of birth for foreign-born residents (%): India Mill Creek:
13.6% (681)Washington:
8.9% (101,353)
Korea Mill Creek:
12.3% (615)Washington:
4.3% (48,886)
China, excluding Hong Kong and Taiwan Mill Creek:
11.2% (558)Washington:
7.4% (84,470)
Mexico Mill Creek:
6.3% (313)Washington:
21.1% (241,655)
Bulgaria Mill Creek:
6.1% (307)Washington:
0.2% (2,858)
Venezuela Mill Creek:
6.1% (306)Washington:
0.3% (3,180)
Philippines Mill Creek:
4.7% (236)Washington:
6.3% (71,661)
Taiwan Mill Creek:
3.7% (184)Washington:
1.5% (16,607)
South Africa Mill Creek:
3.2% (159)Washington:
0.3% (3,373)
Japan Mill Creek:
2.7% (133)Washington:
1.5% (17,453)
Canada Mill Creek:
2.5% (123)Washington:
4.1% (47,238)
Laos Mill Creek:
1.9% (97)Washington:
0.5% (5,926)
Guatemala Mill Creek:
1.9% (94)Washington:
1.2% (13,855)
Cambodia Mill Creek:
1.8% (88)Washington:
1.0% (10,993)
Brazil Mill Creek:
1.7% (84)Washington:
0.8% (9,359)
Hong Kong Mill Creek:
1.7% (83)Washington:
0.8% (8,785)
Place of birth for U.S.-born residents:
This state: 9,557Other state: 6,179Northeast: 694Midwest: 1,795South: 1,171West: 2,527 84.0% of Mill Creek residents lived in the same house 1 years ago.
Out of people who lived in different houses, 33.9% lived in this county.
Out of people who lived in different counties, 40.3% lived in Washington.
Mill Creek:
84.0%State average:
85.2%
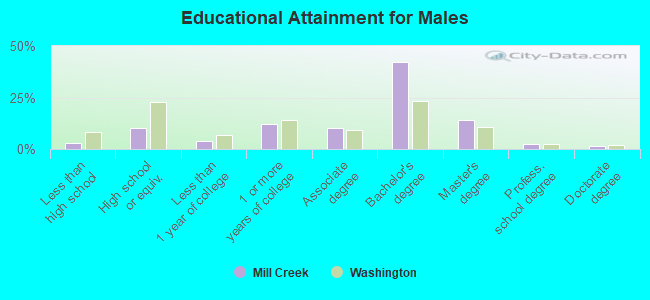
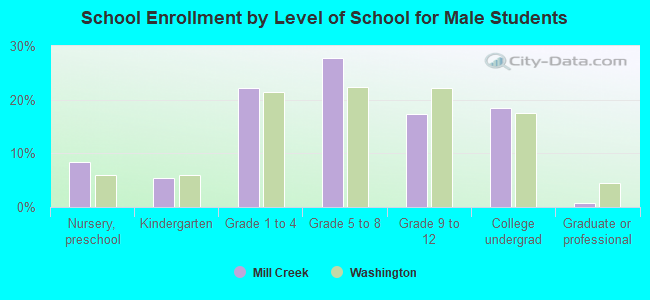
Education attainment for males 25 years and older:
No schooling: 15Nursery to 4th grade: 85th and 6th grade: 07th and 8th grade: 09th grade: 010th grade: 011th grade: 012th grade, no diploma: 208High school graduate (or equivalency): 761Less than 1 year of college: 291Some college more than 1 year, no degree: 906Associate degree: 765Bachelor's degree: 3,155Master's degree: 1,049Professional school degree: 195Doctorate degree: 108
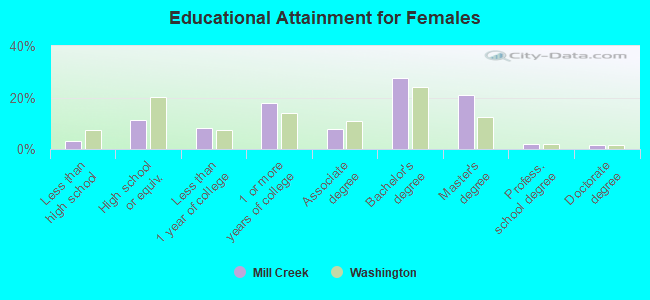
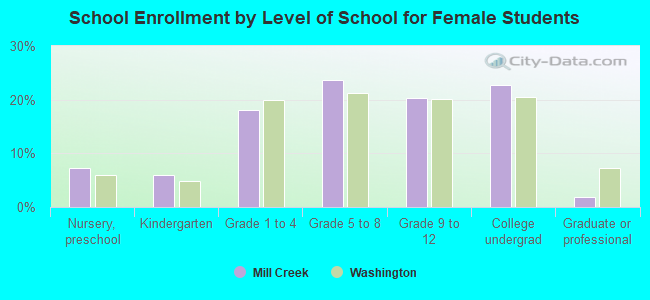
Education attainment for females 25 years and older:
No schooling: 24Nursery to 4th grade: 05th and 6th grade: 257th and 8th grade: 09th grade: 1110th grade: 1011th grade: 012th grade, no diploma: 179High school graduate (or equivalency): 891Less than 1 year of college: 635Some college more than 1 year, no degree: 1,381Associate degree: 607Bachelor's degree: 2,152Master's degree: 1,644Professional school degree: 139Doctorate degree: 115
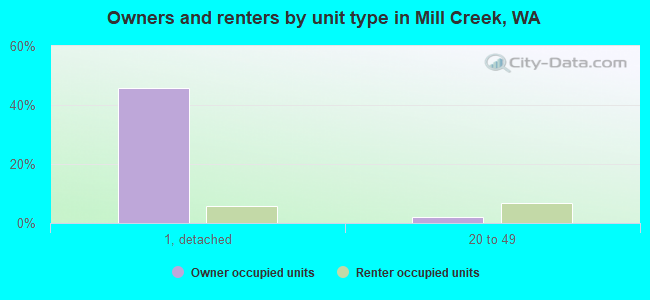
Housing units in structures:
One, detached: 4,658One, attached: 865Two: 513 or 4: 1765 to 9: 56910 to 19: 1,13120 to 49: 82250 or more: 993Mobile homes: 25Housing units lacking complete kitchen facilities in 2022: 0.2%House/condo owner moved in on average 9 years ago
Renter moved in on average 1 years ago
Private vs. public school enrollment:
Students in private schools in grades 1 to 8 (elementary and middle school): 205 Here:
10.0%Washington:
12.4%
Students in private schools in grades 9 to 12 (high school): 37 Students in private undergraduate colleges: 68 Here:
7.2%Washington:
16.5%