Housing density: 421 houses/condos per square mile
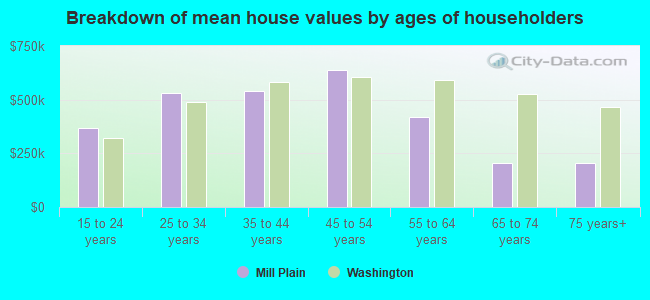
Median price asked for vacant for-sale houses and condos in 2022 in this county: $858,483.
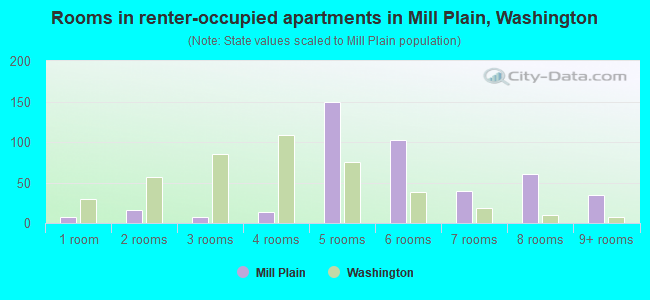
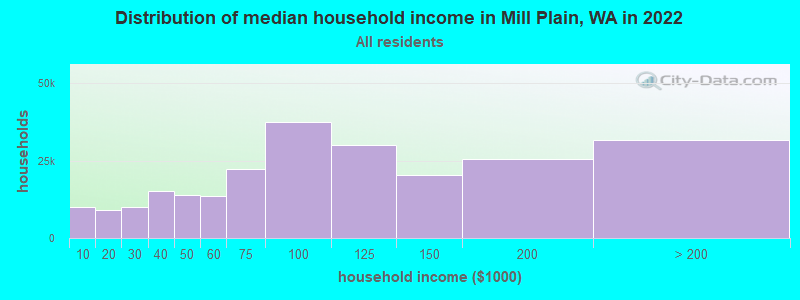
Median contract rent in 2022: over $2,000 (lower quartile is $1,844, upper quartile is over $2,000)
Median rent asked for vacant for-rent units in 2022: $2,063
Median gross rent in Mill Plain, WA in 2022: over $2,000
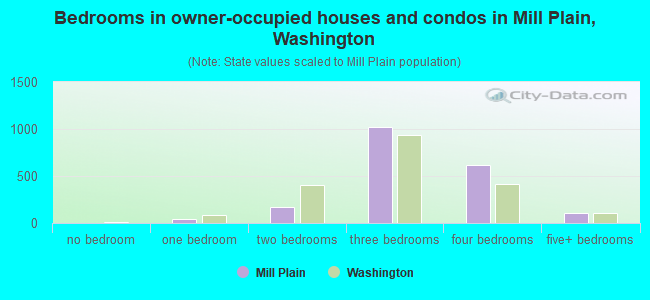
Housing units in Mill Plain with a mortgage: 1,418 (143 second mortgage, 131 home equity loan, 0 both second mortgage and home equity loan) Houses without a mortgage: 120
In family households: 360,563 (79,262 male householders, 31,410 female householders)
84,752 spouses, 131,505 children (121,185 natural, 3,296 adopted, 7,024 stepchildren), 7,226 grandchildren, 3,444 brothers or sisters, 3,549 parents, foster children, 4,498 other relatives, 12,056 non-relatives
In nonfamily households: 61,590 (22,699 male householders (16,393 living alone)), 24,728 female householders (20,133 living alone)), 14,163 nonrelatives
In group quarters: 3,210 (1,691 institutionalized population)
71,295 married couples with children.
20,273 single-parent households (5,325 men, 14,948 women).
82.2% of residents of Mill Plain speak English at home.
3.8% of residents speak Spanish at home (72% speak English very well, 20% speak English well, 8% speak English not well).
10.2% of residents speak other Indo-European language at home (50% speak English very well, 21% speak English well, 22% speak English not well, 7% don't speak English at all).
2.8% of residents speak Asian or Pacific Island language at home (54% speak English very well, 17% speak English well, 29% speak English not well).
1.0% of residents speak other language at home (100% speak English very well).
Foreign born population: 1,883 (16.8%)
(41.3% of them are naturalized citizens)
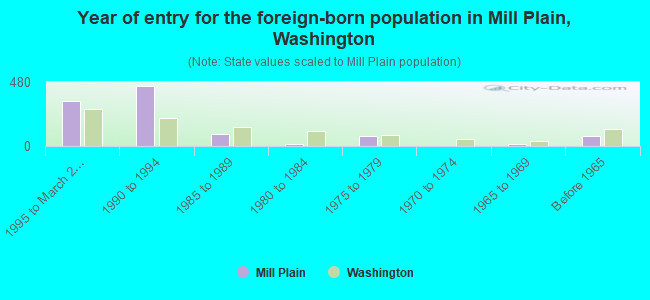
Year of entry for the foreign-born population in Mill Plain, Washington
3391995 to March 2000
4531990 to 1994
881985 to 1989
161980 to 1984
721975 to 1979
01970 to 1974
121965 to 1969
74Before 1965
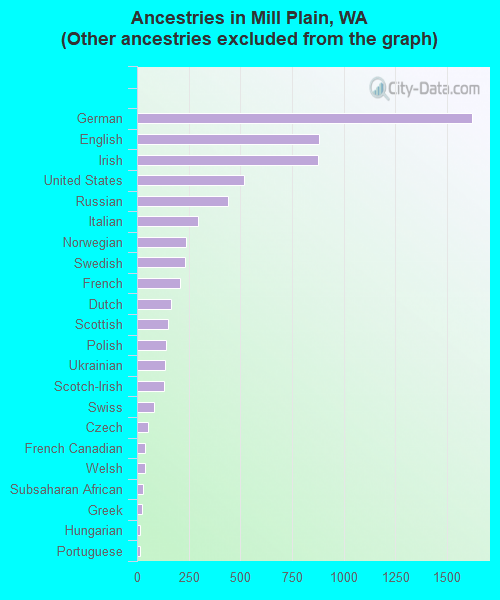
First ancestries reported:
Other: 1,778 (21.9%)
German: 1,623 (20.0%)
English: 879 (10.8%)
Irish: 877 (10.8%)
United States: 517 (6.4%)
Russian: 439 (5.4%)
Italian: 297 (3.7%)
Norwegian: 238 (2.9%)
Swedish: 232 (2.9%)
French: 208 (2.6%)
Dutch: 165 (2.0%)
Scottish: 149 (1.8%)
Polish: 139 (1.7%)
Ukrainian: 137 (1.7%)
Scotch-Irish: 129 (1.6%)
Swiss: 82 (1.0%)
Czech: 52 (0.6%)
French Canadian: 40 (0.5%)
Welsh: 37 (0.5%)
Subsaharan African: 28 (0.3%)
Greek: 25 (0.3%)
Hungarian: 16 (0.2%)
Portuguese: 15 (0.2%)
Danish: 9 (0.1%)
West Indian: 8 (0.10%)
Lithuanian: 7 (0.09%)
Most common places of birth for foreign-born residents (%):
Russia
Mill Plain:
29.0% (306)
Washington:
2.5% (15,491)
Mexico
Mill Plain:
14.3% (151)
Washington:
24.1% (148,115)
Ukraine
Mill Plain:
6.4% (67)
Washington:
3.0% (18,572)
Vietnam
Mill Plain:
6.0% (63)
Washington:
6.7% (40,879)
Other Eastern Europe
Mill Plain:
4.6% (48)
Washington:
1.2% (7,645)
Other South Central Asia
Mill Plain:
4.4% (46)
Washington:
0.5% (2,889)
Korea
Mill Plain:
3.8% (40)
Washington:
6.2% (38,172)
Canada
Mill Plain:
3.6% (38)
Washington:
7.7% (47,568)
United Kingdom
Mill Plain:
3.4% (36)
Washington:
3.3% (20,321)
Japan
Mill Plain:
2.8% (30)
Washington:
2.8% (16,936)
Bosnia and Herzegovina
Mill Plain:
2.8% (29)
Washington:
0.4% (2,755)
Philippines
Mill Plain:
2.7% (28)
Washington:
7.6% (46,733)
Romania
Mill Plain:
2.5% (26)
Washington:
0.7% (4,345)
Other Western Asia
Mill Plain:
2.2% (23)
Washington:
0.4% (2,661)
Other Western Africa
Mill Plain:
1.9% (20)
Washington:
0.2% (1,129)
Iran
Mill Plain:
1.5% (16)
Washington:
0.7% (4,573)
Panama
Mill Plain:
1.5% (16)
Washington:
0.3% (1,548)
Place of birth for U.S.-born residents:
This state: 2,100
Other state: 4,256
Northeast: 270
Midwest: 688
South: 366
West: 2,932
27% of Mill Plain residents lived in the same house 5 years ago. Out of people who lived in different houses, 53% lived in this county. Out of people who lived in different counties, 23% lived in Washington.
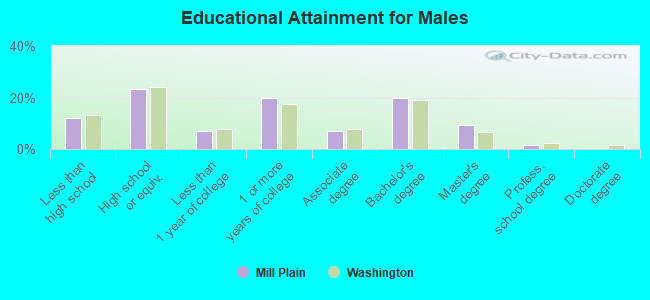
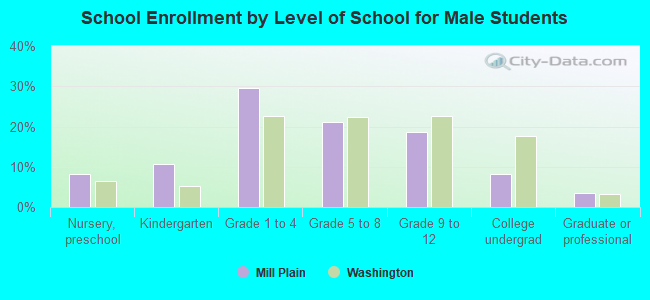
Education attainment for males 25 years and older:
No schooling: 8
Nursery to 4th grade: 6
5th and 6th grade: 5
7th and 8th grade: 34
9th grade: 9
10th grade: 40
11th grade: 59
12th grade, no diploma: 104
High school graduate (or equivalency): 519
Less than 1 year of college: 159
Some college more than 1 year, no degree: 438
Associate degree: 158
Bachelor's degree: 437
Master's degree: 208
Professional school degree: 35
Doctorate degree: 0
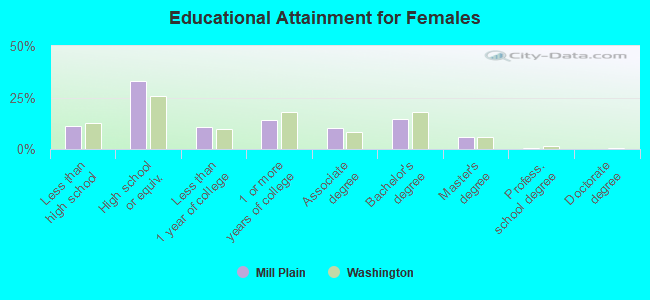
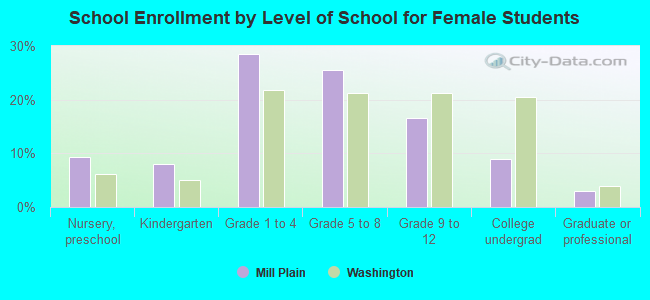
Education attainment for females 25 years and older:
No schooling: 5
Nursery to 4th grade: 21
5th and 6th grade: 0
7th and 8th grade: 34
9th grade: 19
10th grade: 31
11th grade: 23
12th grade, no diploma: 119
High school graduate (or equivalency): 729
Less than 1 year of college: 231
Some college more than 1 year, no degree: 314
Associate degree: 222
Bachelor's degree: 319
Master's degree: 133
Professional school degree: 13
Doctorate degree: 0
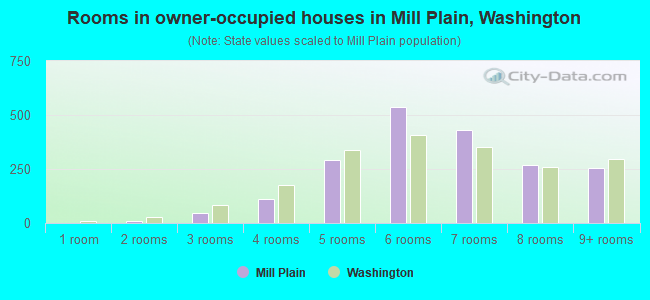
Housing units in structures:
One, detached: 2,074
One, attached: 64
Two: 18
20 to 49: 8
50 or more: 8
Mobile homes: 344
Median worth of mobile homes: $193,734
Housing units lacking complete plumbing facilities: 0.2%