Mount Pleasant, MI (Michigan) Houses and Residents
Estimated median house or condo value in 2022: $180,770 (it was $95,100 in 2000 )
Mount Pleasant:
$180,770Michigan:
$224,400
Lower value quartile - upper value quartile: $126,936 - $243,392Mean price in 2022: Detached houses: $193,884 Here:
$193,884State:
$280,038
Townhouses or other attached units: $172,703 Here:
$172,703State:
$239,520
In 2-unit structures: $185,591 Here:
$185,591State:
$219,481
In 3-to-4-unit structures: $208,275 Here:
$208,275State:
$207,067
Mobile homes: $328,682 Here:
$328,682State:
$72,868
Total population: 25,971 (All urban)
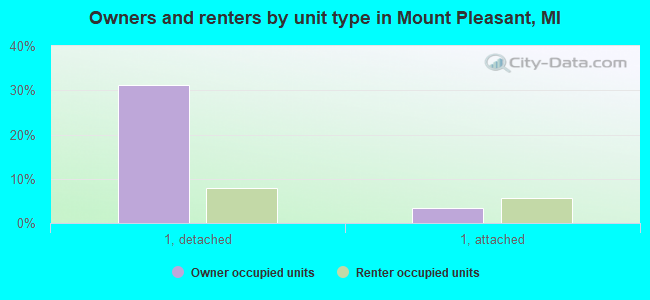
Houses: 8,668 (7,706 occupied: 2,815 owner occupied, 5,003 renter occupied )
% of renters here:
64%State:
27%
Housing density: 1,112 houses/condos per square mile
Median price asked for vacant for-sale houses and condos in 2022: $132,566.
Median contract rent in 2022: $771 (lower quartile is $521, upper quartile is $978)
Median rent asked for vacant for-rent units in 2022: $1,363
Median gross rent in Mount Pleasant, MI in 2022: $858
Housing units in Mount Pleasant with a mortgage: 1,704 (128 second mortgage, 0 home equity loan, 107 both second mortgage and home equity loan )Houses without a mortgage: 43
Median household income for houses/condos with a mortgage: $88,444
Median household income for apartments without a mortgage: $62,859
Median monthly housing costs: $863
Data:
Median house or condo value ($)
Median house or condo value ($ change since 2000)
Median house or condo value ($) - White
Median house or condo value ($) - Black or African American
Median house or condo value ($) - Asian
Median house or condo value ($) - Hispanic or Latino
Median house or condo value ($) - American Indian and Alaska Native
Median house or condo value ($) - Multirace
Median house or condo value ($) - Other Race
Median price asked for mobile homes ($)
Household density (households per square mile)
Mean house or condo value by units in structure - 1, detached ($)
Mean house or condo value by units in structure - 1, attached ($)
Mean house or condo value by units in structure - 2 ($)
Mean house or condo value by units in structure by units in structure - 3 or 4 ($)
Mean house or condo value by units in structure - 5 or more ($)
Mean house or condo value by units in structure - Boat, RV, van, etc. ($)
Mean house or condo value by units in structure - Mobile home ($)
Median contract rent ($)
Median contract rent - Lower quartile ($)
Median contract rent - Upper quartile ($)
Median gross rent ($)
Urban houses (%)
Rural houses (%)
Houses occupied (%)
Houses occupied (% change since 2000)
Houses owner occupied (%)
Houses owner occupied (% change since 2000)
Houses renter occupied (%)
Houses renter occupied (% change since 2000)
Vacant housing units - For rent (%)
Vacant housing units - For rent (% change since 2000)
Vacant housing units - For sale only (%)
Vacant housing units - For sale only (% change since 2000)
Vacant housing units - Rented or sold, not occupied (%)
Vacant housing units - Rented or sold, not occupied (% change since 2000)
Vacant housing units - For seasonal, recreational, or occasional use (%)
Vacant housing units - For seasonal, recreational, or occasional use (% change since 2000)
Vacant housing units - For migrant workers (%)
Vacant housing units - For migrant workers (% change since 2000)
Vacant housing units - Other vacant (%)
Vacant housing units - Other vacant (% change since 2000)
Median monthly housing costs ($)
Median household income for houses/condos with a mortgage ($)
Median household income for houses/condos without a mortgage ($)
Median household income ($)
Median household income ($) - White
Median household income ($) - Black or African American
Median household income ($) - Asian
Median household income ($) - Hispanic or Latino
Median household income ($) - American Indian and Alaska Native
Median household income ($) - Multirace
Median household income ($) - Other Race
Mortgage status - with mortgage (%)
Mortgage status - with second mortgage (%)
Mortgage status - with home equity loan (%)
Mortgage status - with both second mortgage and home equity loan (%)
Mortgage status - without a mortgage (%)
Median year house/condo built
Median year apartment built
Household type by relationship - Male householder living alone (%)
Household type by relationship - Male householder not living alone (%)
Household type by relationship - Female householder living alone (%)
Household type by relationship - Female householder not living alone (%)
Household type by relationship - Opposite-Sex spouse (%)
Household type by relationship - Same-Sex spouse (%)
Household type by relationship - Opposite-Sex unmarried partner (%)
Household type by relationship - Same-Sex unmarried partner (%)
Household type by relationship - In group quarters (%)
Size of family households - 2-person household (%)
Size of family households - 3-person household (%)
Size of family households - 4-person household (%)
Size of family households - 5-person household (%)
Size of family households - 6-person household (%)
Size of family households - 7-or-more-person household (%)
Size of nonfamily households - 1-person household (%)
Size of nonfamily households - 2-person household (%)
Size of nonfamily households - 3-person household (%)
Size of nonfamily households - 4-person household (%)
Size of nonfamily households - 5-person household (%)
Size of nonfamily households - 6-person household (%)
Size of nonfamily households - 7-or-moreperson household (%)
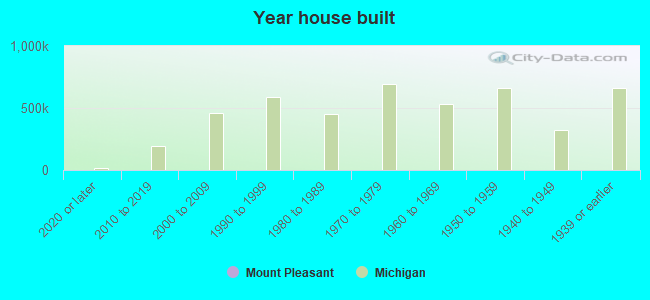
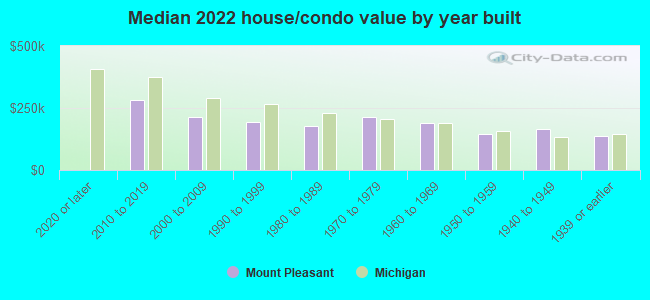
Year house built - Built 2010 or later (%)
Year house built - Built 2000 to 2009 (%)
Year house built - Built 1990 to 1999 (%)
Year house built - Built 1980 to 1989 (%)
Year house built - Built 1970 to 1979 (%)
Year house built - Built 1960 to 1969 (%)
Year house built - Built 1950 to 1959 (%)
Year house built - Built 1940 to 1949 (%)
Year house built - Built 1939 or earlier (%)
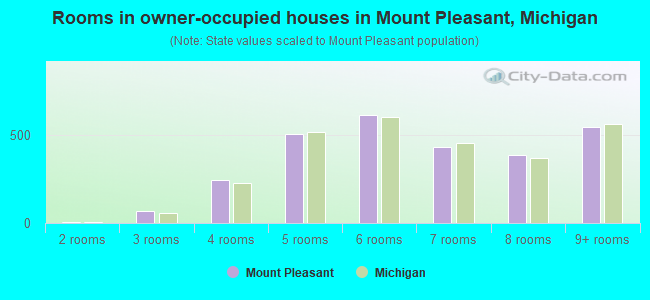
Median number of rooms in houses and condos
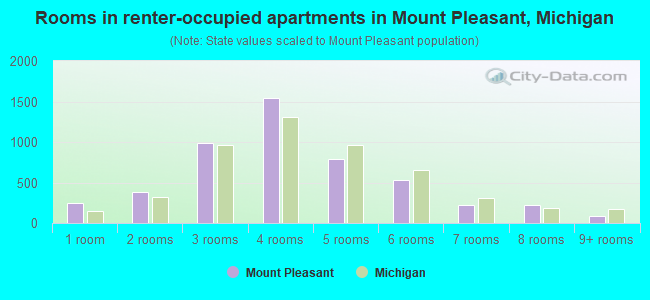
Median number of rooms in apartments
Median number of bedrooms in owner occupied houses
Mean number of bedrooms in owner occupied houses
Median number of bedrooms in renter occupied houses
Mean number of bedrooms in renter occupied houses
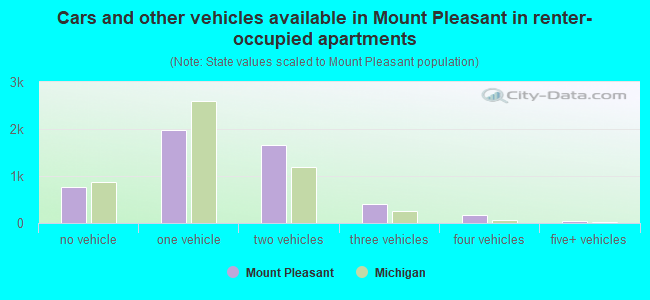
Median number of vehichles in owner occupied houses
Mean number of vehichles in owner occupied houses
Median number of vehichles in renter occupied houses
Mean number of vehichles in renter occupied houses
Rooms in owner-occupied houses - 1 room (%)
Rooms in owner-occupied houses - 2 rooms (%)
Rooms in owner-occupied houses - 3 rooms (%)
Rooms in owner-occupied houses - 4 rooms (%)
Rooms in owner-occupied houses - 5 rooms (%)
Rooms in owner-occupied houses - 6 rooms (%)
Rooms in owner-occupied houses - 7 rooms (%)
Rooms in owner-occupied houses - 8 rooms (%)
Rooms in owner-occupied houses - 9+ rooms (%)
Rooms in renter-occupied houses - 1 room (%)
Rooms in renter-occupied houses - 2 rooms (%)
Rooms in renter-occupied houses - 3 rooms (%)
Rooms in renter-occupied houses - 4 rooms (%)
Rooms in renter-occupied houses - 5 rooms (%)
Rooms in renter-occupied houses - 6 rooms (%)
Rooms in renter-occupied houses - 7 rooms (%)
Rooms in renter-occupied houses - 8 rooms (%)
Rooms in renter-occupied houses - 9+ rooms (%)
Bedrooms in owner-occupied houses - no bedrooms (%)
Bedrooms in owner-occupied houses - 1 bedroom (%)
Bedrooms in owner-occupied houses - 2 bedrooms (%)
Bedrooms in owner-occupied houses - 3 bedrooms (%)
Bedrooms in owner-occupied houses - 4 bedrooms (%)
Bedrooms in owner-occupied houses - 5+ bedrooms (%)
Bedrooms in renter-occupied houses - no bedrooms (%)
Bedrooms in renter-occupied houses - 1 bedroom (%)
Bedrooms in renter-occupied houses - 2 bedrooms (%)
Bedrooms in renter-occupied houses - 3 bedrooms (%)
Bedrooms in renter-occupied houses - 4 bedrooms (%)
Bedrooms in renter-occupied houses - 5+ bedrooms (%)
Vehicles available in owner-occupied houses - no vehicle available (%)
Vehicles available in owner-occupied houses - 1 vehicle available(%)
Vehicles available in owner-occupied houses - 2 Vehicles available (%)
Vehicles available in owner-occupied houses - 3 Vehicles available (%)
Vehicles available in owner-occupied houses - 4 Vehicles available (%)
Vehicles available in owner-occupied houses - 5+ Vehicles available (%)
Vehicles available in renter-occupied houses - no vehicle available (%)
Vehicles available in renter-occupied houses - 1 vehicle available (%)
Vehicles available in renter-occupied houses - 2 Vehicles available (%)
Vehicles available in renter-occupied houses - 3 Vehicles available (%)
Vehicles available in renter-occupied houses - 4 Vehicles available (%)
Vehicles available in renter-occupied houses - 5+ Vehicles available (%)
Housing units in structures - 1, detached (%)
Housing units in structures - 1, attached (%)
Housing units in structures - 2 (%)
Housing units in structures - 3 or 4 (%)
Housing units in structures - 5 to 9 (%)
Housing units in structures - 10 to 19 (%)
Housing units in structures - 20 to 49 (%)
Housing units in structures - 50 or more (%)
Housing units in structures - Mobile home (%)
Housing units in structures - Boat, RV, van, etc. (%)
Housing units in structures - Owners - 1, detached (%)
Housing units in structures - Owners - 1, attached (%)
Housing units in structures - Owners - 2 (%)
Housing units in structures - Owners - 3 or 4 (%)
Housing units in structures - Owners - 5 to 9 (%)
Housing units in structures - Owners - 10 to 19 (%)
Housing units in structures - Owners - 20 to 49 (%)
Housing units in structures - Owners - 50 or more (%)
Housing units in structures - Owners - Mobile home (%)
Housing units in structures - Owners - Boat, RV, van, etc. (%)
Housing units in structures - Renters - 1, detached (%)
Housing units in structures - Renters - 1, attached (%)
Housing units in structures - Renters - 2 (%)
Housing units in structures - Renters - 3 or 4 (%)
Housing units in structures - Renters - 5 to 9 (%)
Housing units in structures - Renters - 10 to 19 (%)
Housing units in structures - Renters - 20 to 49 (%)
Housing units in structures - Renters - 50 or more (%)
Housing units in structures - Renters - Mobile home (%)
Housing units in structures - Renters - Boat, RV, van, etc. (%)
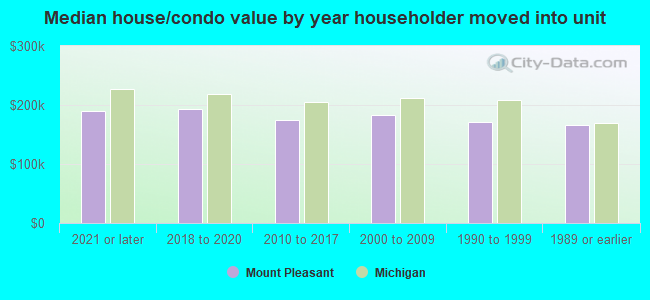
House/condo owner moved in on average (years ago)
Renter moved in on average (years ago)
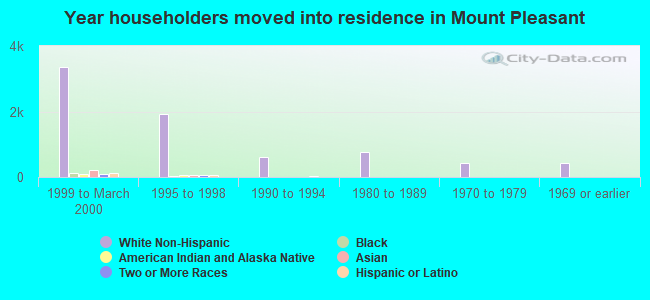
Year householder moved into unit - Moved in 1999 to March 2000 (%)
Year householder moved into unit - Moved in 1999 to March 2000 (%) - White
Year householder moved into unit - Moved in 1999 to March 2000 (%) - Black or African American
Year householder moved into unit - Moved in 1999 to March 2000 (%) - Asian
Year householder moved into unit - Moved in 1999 to March 2000 (%) - Hispanic or Latino
Year householder moved into unit - Moved in 1999 to March 2000 (%) - American Indian and Alaska Native
Year householder moved into unit - Moved in 1999 to March 2000 (%) - Multirace
Year householder moved into unit - Moved in 1999 to March 2000 (%) - Other Race
Year householder moved into unit - Moved in 1995 to 1998 (%)
Year householder moved into unit - Moved in 1995 to 1998 (%) - White
Year householder moved into unit - Moved in 1995 to 1998 (%) - Black or African American
Year householder moved into unit - Moved in 1995 to 1998 (%) - Asian
Year householder moved into unit - Moved in 1995 to 1998 (%) - Hispanic or Latino
Year householder moved into unit - Moved in 1995 to 1998 (%) - American Indian and Alaska Native
Year householder moved into unit - Moved in 1995 to 1998 (%) - Multirace
Year householder moved into unit - Moved in 1995 to 1998 (%) - Other Race
Year householder moved into unit - Moved in 1990 to 1994 (%)
Year householder moved into unit - Moved in 1990 to 1994 (%) - White
Year householder moved into unit - Moved in 1990 to 1994 (%) - Black or African American
Year householder moved into unit - Moved in 1990 to 1994 (%) - Asian
Year householder moved into unit - Moved in 1990 to 1994 (%) - Hispanic or Latino
Year householder moved into unit - Moved in 1990 to 1994 (%) - American Indian and Alaska Native
Year householder moved into unit - Moved in 1990 to 1994 (%) - Multirace
Year householder moved into unit - Moved in 1990 to 1994 (%) - Other Race
Year householder moved into unit - Moved in 1980 to 1989 (%)
Year householder moved into unit - Moved in 1980 to 1989 (%) - White
Year householder moved into unit - Moved in 1980 to 1989 (%) - Black or African American
Year householder moved into unit - Moved in 1980 to 1989 (%) - Asian
Year householder moved into unit - Moved in 1980 to 1989 (%) - Hispanic or Latino
Year householder moved into unit - Moved in 1980 to 1989 (%) - American Indian and Alaska Native
Year householder moved into unit - Moved in 1980 to 1989 (%) - Multirace
Year householder moved into unit - Moved in 1980 to 1989 (%) - Other Race
Year householder moved into unit - Moved in 1970 to 1979 (%)
Year householder moved into unit - Moved in 1970 to 1979 (%) - White
Year householder moved into unit - Moved in 1970 to 1979 (%) - Black or African American
Year householder moved into unit - Moved in 1970 to 1979 (%) - Asian
Year householder moved into unit - Moved in 1970 to 1979 (%) - Hispanic or Latino
Year householder moved into unit - Moved in 1970 to 1979 (%) - American Indian and Alaska Native
Year householder moved into unit - Moved in 1970 to 1979 (%) - Multirace
Year householder moved into unit - Moved in 1970 to 1979 (%) - Other Race
Year householder moved into unit - Moved in 1969 or earlier (%)
Year householder moved into unit - Moved in 1969 or earlier (%) - White
Year householder moved into unit - Moved in 1969 or earlier (%) - Black or African American
Year householder moved into unit - Moved in 1969 or earlier (%) - Asian
Year householder moved into unit - Moved in 1969 or earlier (%) - Hispanic or Latino
Year householder moved into unit - Moved in 1969 or earlier (%) - American Indian and Alaska Native
Year householder moved into unit - Moved in 1969 or earlier (%) - Multirace
Year householder moved into unit - Moved in 1969 or earlier (%) - Other Race
Housing units lacking complete plumbing facilities (%)
Housing units lacking complete kitchen facilities (%)
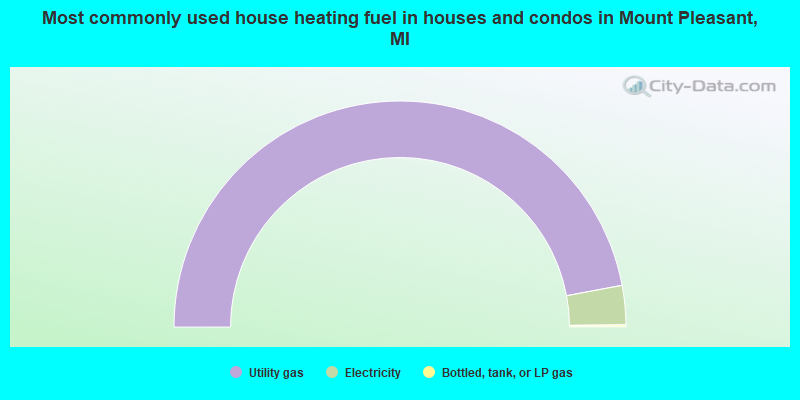
House heating fuel used in houses and condos - Utility gas (%)
House heating fuel used in houses and condos - Bottled, tank, or LP gas (%)
House heating fuel used in houses and condos - Electricity (%)
House heating fuel used in houses and condos - Fuel oil, kerosene, etc. (%)
House heating fuel used in houses and condos - Coal or coke (%)
House heating fuel used in houses and condos - Wood (%)
House heating fuel used in houses and condos - Solar energy (%)
House heating fuel used in houses and condos - Other fuel (%)
House heating fuel used in houses and condos - No fuel used (%)
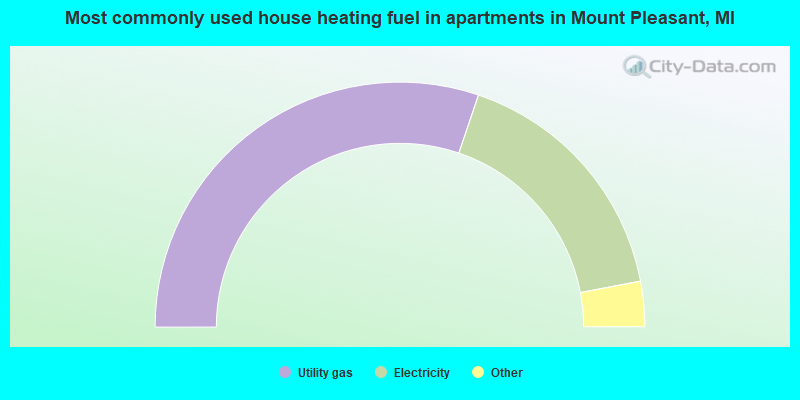
House heating fuel used in apartments - Utility gas (%)
House heating fuel used in apartments - Bottled, tank, or LP gas (%)
House heating fuel used in apartments - Electricity (%)
House heating fuel used in apartments - Fuel oil, kerosene, etc. (%)
House heating fuel used in apartments - Coal or coke (%)
House heating fuel used in apartments - Wood (%)
House heating fuel used in apartments - Solar energy (%)
House heating fuel used in apartments - Other fuel (%)
House heating fuel used in apartments - No fuel used (%)
Median year house/condo built: 1963Median year apartment built: 1980Household type by relationship:
Households: 21,774
Male householders: 3,519 (1,402 living alone ), Female householders: 4,127 (1,484 living alone )1,803 spouses (1,786 opposite-sex spouses ), 966 unmarried partners , (950 opposite-sex unmarried partners ), 3,000 children (2,795 natural , 71 adopted , 133 stepchildren ), 145 grandchildren , 126 brothers or sisters , 111 parents , 6 foster children , 164 other relatives , 2,399 non-relatives In group quarters: 5,401
Size of family households: 1,410 2-persons , 807 3-persons , 559 4-persons , 174 5-persons , 30 6-persons , 8 7-or-more-persons .
Size of nonfamily households: 2,998 1-person , 1,286 2-persons , 316 3-persons , 270 4-persons , 18 5-persons , 22 6-persons .
1,429 married couples with children. single-parent households (192 men , 642 women ).
91.5% of residents of Mount Pleasant speak English at home. of residents speak Spanish at home (71% speak English very well , 16% speak English well , 6% speak English not well , 7% don't speak English at all ).of residents speak other Indo-European language at home (86% speak English very well , 14% speak English well ).of residents speak Asian or Pacific Island language at home (62% speak English very well , 18% speak English well , 20% speak English not well ).of residents speak other language at home (79% speak English very well , 13% speak English well , 8% don't speak English at all ).
Foreign born population: 1,195 (5.5%)of them are naturalized citizens )
Median number of rooms in houses and condos:
Median number of rooms in apartments
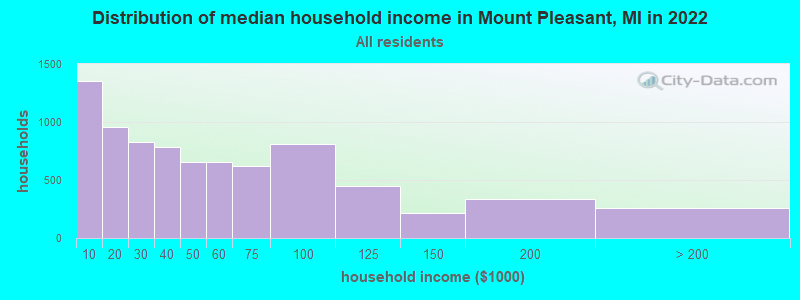
Mount Pleasant, MI household income distribution 1,354 Less than $10,000956 $10,000 to $19,999824 $20,000 to $29,999784 $30,000 to $39,999656 $40,000 to $49,999655 $50,000 to $59,999623 $60,000 to $74,999814 $75,000 to $99,999452 $100,000 to $124,999219 $125,000 to $149,999332 $150,000 to $199,999261 $200,000 or more
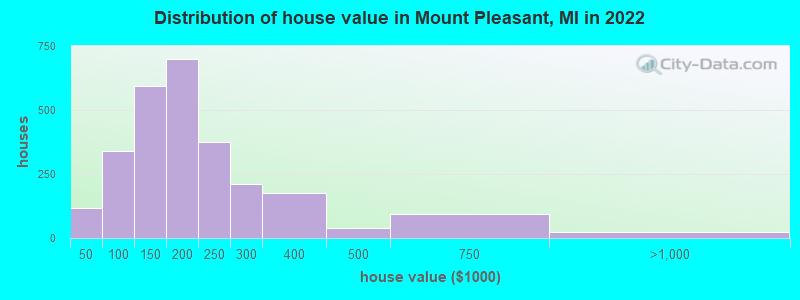
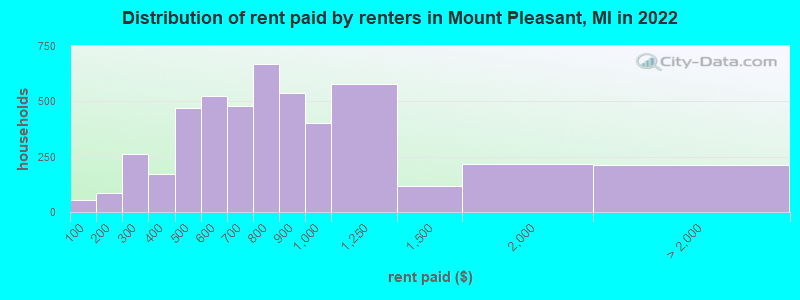
Home value of owner - occupied houses in 2022 in Mount Pleasant, MI 37 Less than $10,00035 $10,000 to $14,9995 $15,000 to $19,9993 $20,000 to $24,99916 $25,000 to $29,9999 $30,000 to $34,99911 $40,000 to $49,99926 $50,000 to $59,99950 $60,000 to $69,99944 $70,000 to $79,999120 $80,000 to $89,99986 $90,000 to $99,999303 $100,000 to $124,999289 $125,000 to $149,999375 $150,000 to $174,999322 $175,000 to $199,999373 $200,000 to $249,999210 $250,000 to $299,999176 $300,000 to $399,99938 $400,000 to $499,99993 $500,000 to $749,99923 $750,000 to $999,999Rent paid by renters in 2022 in Mount Pleasant, MI 52 Less than $10086 $150 to $199104 $200 to $249156 $250 to $299118 $300 to $34955 $350 to $399233 $400 to $449238 $450 to $499341 $500 to $549184 $550 to $599276 $600 to $649200 $650 to $699194 $700 to $749475 $750 to $799538 $800 to $899402 $900 to $999577 $1,000 to $1,249117 $1,250 to $1,499215 $1,500 to $1,999115 $2,000 to $2,49997 No cash rent
Percentage of workers working in this county: 86.6%Number of people working at home: 906 (8.5% of all workers )
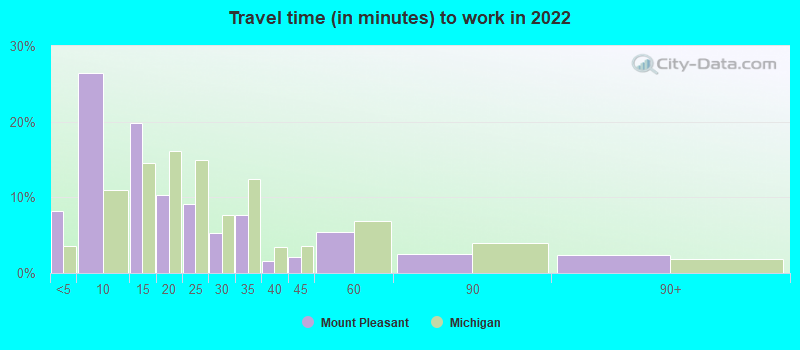
Travel time to work (commute)
Less than 5 minutes: 1,1845 to 9 minutes: 3,63110 to 14 minutes: 2,24215 to 19 minutes: 88320 to 24 minutes: 43225 to 29 minutes: 15730 to 34 minutes: 39635 to 39 minutes: 7140 to 44 minutes: 14645 to 59 minutes: 34960 to 89 minutes: 18890 or more minutes: 157
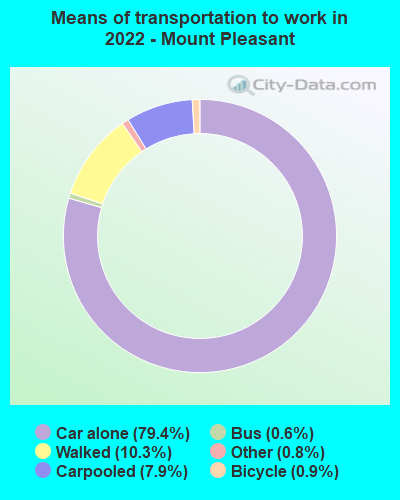
Means of transportation to work:
Drove a car alone: 12,617 (73.2%)Carpooled: 1,271 (7.4%)Bus : 73 (0.4%)Ferryboat: 6 (0.0%)Taxi: 156 (0.9%)Bicycle: 166 (1.0%)Walked: 1,658 (9.6%)Worked at home: 906 (5.3%)
Unemployment by race in 2022
Unemployment rate for White non-Hispanic residents 6.8% Males6.3% FemalesUnemployment rate for Black residents 5.9% Males10.7% FemalesUnemployment rate for American Indian and Alaska Native residents 21.7% Males21.7% FemalesUnemployment rate for Asian residents 9.8% Males9.7% FemalesUnemployment rate for other race residents 11.6% FemalesUnemployment rate for two or more race residents 7.3% Males8.9% FemalesUnemployment rate for Hispanic or Latino residents 10.3% Males11.2% Females
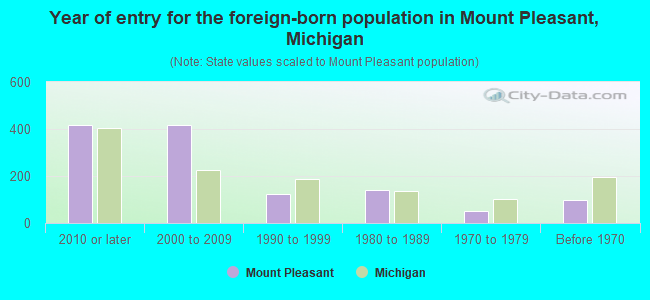
Year of entry for the foreign-born population in Mount Pleasant, Michigan
419 2010 or later 417 2000 to 2009 124 1990 to 1999 140 1980 to 1989 51 1970 to 1979 100 Before 1970
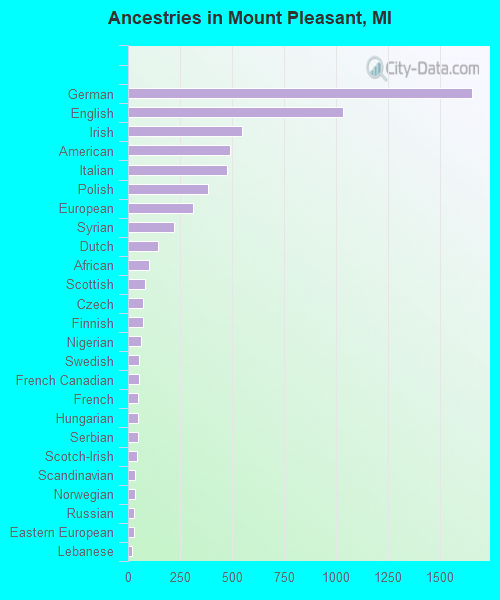
First ancestries reported:
German: 1,653 (18.6%)
English: 1,035 (11.6%)
Irish: 546 (6.1%)
American: 490 (5.5%)
Italian: 477 (5.4%)
Polish: 387 (4.4%)
European: 311 (3.5%)
Syrian: 221 (2.5%)
Dutch: 145 (1.6%)
African: 101 (1.1%)
Scottish: 81 (0.9%)
Czech: 74 (0.8%)
Finnish: 73 (0.8%)
Nigerian: 63 (0.7%)
Swedish: 53 (0.6%)
French Canadian: 51 (0.6%)
French: 50 (0.6%)
Hungarian: 49 (0.6%)
Serbian: 48 (0.5%)
Scotch-Irish: 42 (0.5%)
Scandinavian: 36 (0.4%)
Norwegian: 32 (0.4%)
Russian: 31 (0.3%)
Eastern European: 31 (0.3%)
Lebanese: 21 (0.2%)
Romanian: 21 (0.2%)
Canadian: 19 (0.2%)
Yugoslavian: 18 (0.2%)
Slovak: 18 (0.2%)
Lithuanian: 18 (0.2%)
Slavic: 16 (0.2%)
Northern European: 15 (0.2%)
Assyrian: 14 (0.2%)
Greek: 13 (0.1%)
Danish: 12 (0.1%)
Austrian: 12 (0.1%)
Australian: 10 (0.1%)
Celtic: 10 (0.1%)
Bulgarian: 10 (0.1%)
Czechoslovakian: 9 (0.1%)
Ukrainian: 9 (0.1%)
Pennsylvania German: 9 (0.1%)
Arab: 8 (0.09%)
British: 8 (0.09%)
Swiss: 8 (0.09%)
Haitian: 8 (0.09%)
Moroccan: 6 (0.07%)
Portuguese: 6 (0.07%)
Ghanaian: 5 (0.06%)
West Indian: 2 (0.02%)
Most common places of birth for foreign-born residents (%): India Mount Pleasant:
14.0% (167)Michigan:
11.1% (77,240)
China, excluding Hong Kong and Taiwan Mount Pleasant:
10.5% (125)Michigan:
4.9% (34,295)
Brazil Mount Pleasant:
8.3% (99)Michigan:
1.1% (7,485)
Mexico Mount Pleasant:
7.4% (89)Michigan:
10.9% (75,965)
Germany Mount Pleasant:
6.0% (72)Michigan:
2.3% (16,126)
Peru Mount Pleasant:
4.6% (55)Michigan:
0.2% (1,298)
Canada Mount Pleasant:
4.3% (51)Michigan:
5.0% (35,052)
Nigeria Mount Pleasant:
4.3% (51)Michigan:
0.9% (5,964)
Philippines Mount Pleasant:
2.7% (32)Michigan:
2.8% (19,112)
Netherlands Mount Pleasant:
2.5% (30)Michigan:
0.5% (3,681)
England Mount Pleasant:
2.4% (29)Michigan:
0.9% (6,424)
Poland Mount Pleasant:
2.2% (26)Michigan:
1.6% (10,857)
Pakistan Mount Pleasant:
2.2% (26)Michigan:
1.5% (10,596)
Cambodia Mount Pleasant:
1.9% (23)Michigan:
0.2% (1,657)
Korea Mount Pleasant:
1.8% (21)Michigan:
3.0% (20,884)
Other Eastern Europe Mount Pleasant:
1.8% (21)Michigan:
1.0% (6,730)
Taiwan Mount Pleasant:
1.7% (20)Michigan:
0.6% (4,450)
Place of birth for U.S.-born residents:
This state: 16,393Other state: 3,997Northeast: 477Midwest: 1,880South: 833West: 828 64.3% of Mount Pleasant residents lived in the same house 1 years ago.
Out of people who lived in different houses, 26.5% lived in this county.
Out of people who lived in different counties, 78.0% lived in Michigan.
Mount Pleasant:
64.3%State average:
88.4%
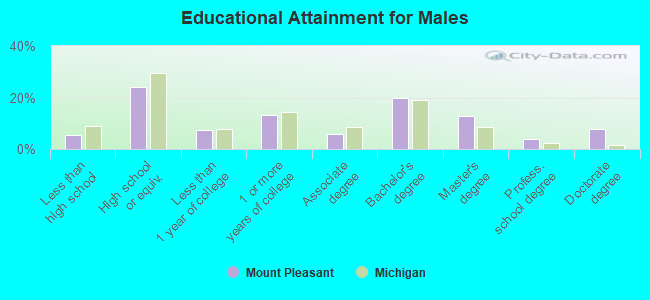
Education attainment for males 25 years and older:
No schooling: 22Nursery to 4th grade: 265th and 6th grade: 97th and 8th grade: 269th grade: 4910th grade: 2111th grade: 4512th grade, no diploma: 57High school graduate (or equivalency): 1,158Less than 1 year of college: 351Some college more than 1 year, no degree: 630Associate degree: 282Bachelor's degree: 937Master's degree: 614Professional school degree: 179Doctorate degree: 369
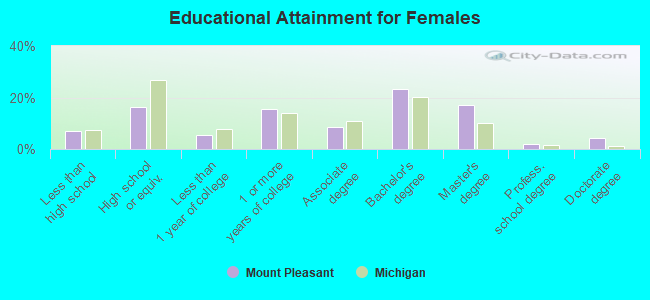
Education attainment for females 25 years and older:
No schooling: 92Nursery to 4th grade: 85th and 6th grade: 277th and 8th grade: 369th grade: 5110th grade: 1511th grade: 6912th grade, no diploma: 53High school graduate (or equivalency): 803Less than 1 year of college: 273Some college more than 1 year, no degree: 775Associate degree: 416Bachelor's degree: 1,154Master's degree: 854Professional school degree: 96Doctorate degree: 219
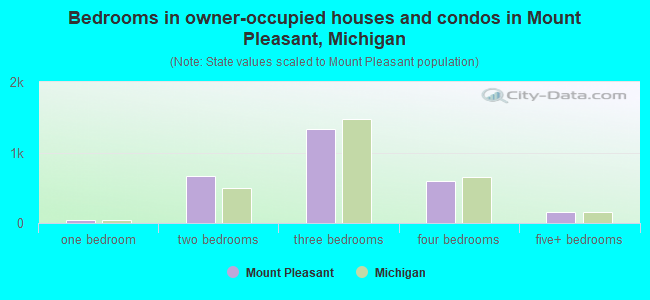
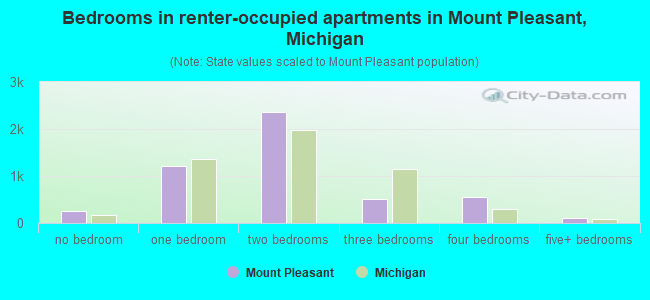
Housing units in structures:
One, detached: 3,261One, attached: 712Two: 4723 or 4: 7385 to 9: 1,15610 to 19: 85920 to 49: 33850 or more: 956Mobile homes: 123Boats, RVs, vans, etc.: 48Median worth of mobile homes: $12,052
Housing units lacking complete plumbing facilities in 2022: 1.0%Housing units lacking complete kitchen facilities in 2022: 1.0%House/condo owner moved in on average 9 years ago
Renter moved in on average 1 years ago
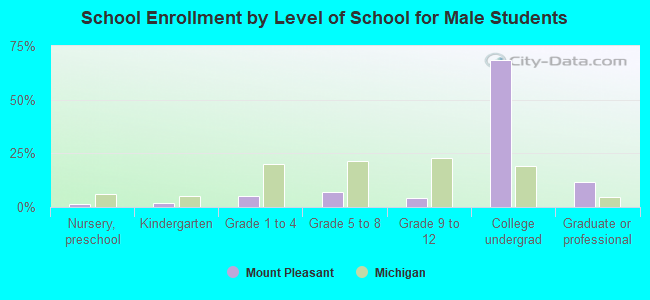
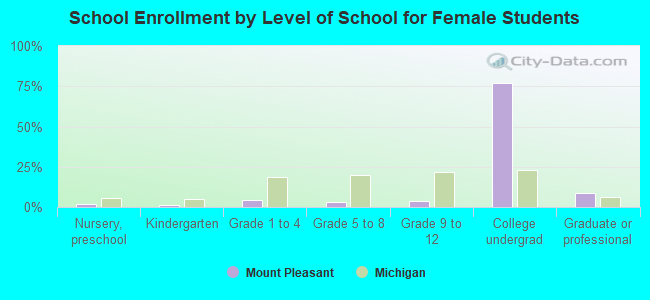
Private vs. public school enrollment:
Students in private schools in grades 1 to 8 (elementary and middle school): 86 Students in private schools in grades 9 to 12 (high school): 7 Students in private undergraduate colleges: 598