New Braunfels, TX (Texas) Houses and Residents
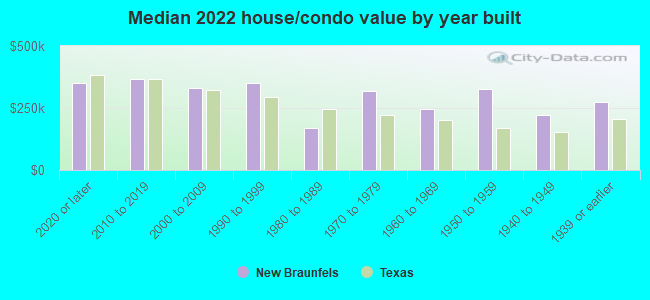
| New Braunfels: | $335,400 |
| Texas: | $275,400 |
Mean price in 2022:
Detached houses: $374,011
Here: $374,011 State: $369,058 Townhouses or other attached units: $293,278
Here: $293,278 State: $327,631 In 2-unit structures: $589,399
Here: $589,399 State: $374,947 In 3-to-4-unit structures: $1,256,282
Here: $1,256,282 State: $209,652 In 5-or-more-unit structures: $370,990
Here: $370,990 State: $413,944 Mobile homes: $96,932
Here: $96,932 State: $124,413
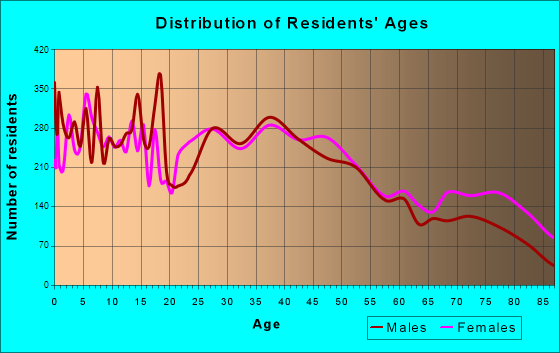
Total population: 66,394 (Urban population: 34,928 (all inside urban clusters), Rural population: 1,956 (67 farm, 1,889 nonfarm))
Houses: 44,158 (40,089 occupied: 27,268 owner occupied, 12,821 renter occupied)
| % of renters here: | 32% |
| State: | 38% |
Housing density: 1,510 houses/condos per square mile
Median price asked for vacant for-sale houses and condos in 2022: $542,592.
Median contract rent in 2022: $1,453 (lower quartile is $1,094, upper quartile is $1,837)
Median rent asked for vacant for-rent units in 2022: $2,097
Median gross rent in New Braunfels, TX in 2022: $1,605
Housing units in New Braunfels with a mortgage: 17,679 (542 second mortgage, 0 home equity loan, 466 both second mortgage and home equity loan)
Houses without a mortgage: 235
Median household income for houses/condos with a mortgage: $104,832
Median household income for apartments without a mortgage: $70,541
Median monthly housing costs: $1,561
Compare current foreclosures in New Braunfels, TX:
| Photo | Address | Area | Beds / Baths | Price | Details |
|---|---|---|---|---|---|

|
#1
Diamondback Trl
New Braunfels, TX 78130
|
1,334 sq. feet
|
2 baths 3 beds |
show details | |

|
#2
Azalea Way
New Braunfels, TX 78132
|
2,704 sq. feet
|
2 baths 5 beds |
show details | |

|
#3
Archer Blvd
New Braunfels, TX 78132
|
2,224 sq. feet
|
2 baths 4 beds |
show details | |

|
#4
Elderberry
New Braunfels, TX 78130
|
- sq. feet
|
2 baths 3 beds |
show details | |

|
#5
Perryman St
New Braunfels, TX 78130
|
- sq. feet
|
2 baths 3 beds |
show details | |

|
#6
Pumpkin Ridge
New Braunfels, TX 78130
|
2,212 sq. feet
|
2 baths 4 beds |
show details | |

|
#7
San Saba
New Braunfels, TX 78130
|
2,085 sq. feet
|
2 baths 4 beds |
show details | |

|
#8
Sungate Dr
New Braunfels, TX 78130
|
2,726 sq. feet
|
2 baths 3 beds |
show details | |

|
#9
Meadow Wind
New Braunfels, TX 78132
|
- sq. feet
|
3 baths 4 beds |
show details | |

|
#10
Sunfire Cir
New Braunfels, TX 78130
|
1,258 sq. feet
|
2 baths 3 beds |
show details |
| Photo | Address | Area | Beds / Baths | Price | Details |
|---|---|---|---|---|---|

|
#11
Roadrunner Ave
New Braunfels, TX 78130
|
1,638 sq. feet
|
2 baths 3 beds |
show details | |

|
#12
Fm 1044
New Braunfels, TX 78130
|
3,168 sq. feet
|
2 baths - beds |
show details | |

|
#13
Spotted Owl
New Braunfels, TX 78130
|
2,413 sq. feet
|
2 baths - beds |
show details | |

|
#14
S Lone Star Ave
New Braunfels, TX 78130
|
1,056 sq. feet
|
2 baths - beds |
show details | |

|
#15
Old Bastrop Rd # 73
New Braunfels, TX 78130
|
1,638 sq. feet
|
2 baths - beds |
show details | |

|
#16
Flaming Oak Dr
New Braunfels, TX 78132
|
1,787 sq. feet
|
2 baths - beds |
show details | |

|
#17
Cherry Hl
New Braunfels, TX 78130
|
2,094 sq. feet
|
2 baths - beds |
show details | |

|
#18
W Merriweather St
New Braunfels, TX 78130
|
800 sq. feet
|
1 baths - beds |
show details | |

|
#19
Starling Crk
New Braunfels, TX 78130
|
1,618 sq. feet
|
2 baths - beds |
show details | |

|
#20
Fm 1044
New Braunfels, TX 78130
|
1,512 sq. feet
|
2 baths - beds |
show details |
| Photo | Address | Area | Beds / Baths | Price | Details |
|---|---|---|---|---|---|

|
#21
Cherokee Blvd
New Braunfels, TX 78132
|
1,431 sq. feet
|
2 baths - beds |
show details | |

|
#22
Woodrow Cir
New Braunfels, TX 78130
|
1,530 sq. feet
|
2 baths - beds |
show details | |

|
#23
Kite Cor
New Braunfels, TX 78130
|
3,145 sq. feet
|
2 baths - beds |
show details | |

|
#24
Northpark Rdg
New Braunfels, TX 78130
|
1,682 sq. feet
|
2 baths - beds |
show details | |

|
#25
Val Verde Dr
New Braunfels, TX 78130
|
1,562 sq. feet
|
2 baths - beds |
show details | |

|
#26
Oak Hollow Dr
New Braunfels, TX 78132
|
1,400 sq. feet
|
1 baths - beds |
show details | |

|
#27
Sunshine Peak
New Braunfels, TX 78130
|
1,844 sq. feet
|
2 baths - beds |
show details | |

|
#28
Monroe Ave
New Braunfels, TX 78132
|
- sq. feet
|
- baths - beds |
show details | |

|
#29
Geronimo Crk
New Braunfels, TX 78130
|
- sq. feet
|
- baths - beds |
show details | |

|
#30
N Interstate 35
New Braunfels, TX 78130
|
- sq. feet
|
- baths - beds |
show details |
| Photo | Address | Area | Beds / Baths | Price | Details |
|---|---|---|---|---|---|

|
#31
Rolling Rdg
New Braunfels, TX 78130
|
1,536 sq. feet
|
- baths - beds |
show details | |

|
#32
Etzel Ter
New Braunfels, TX 78132
|
- sq. feet
|
- baths - beds |
show details | |

|
#33
Lillianite
New Braunfels, TX 78130
|
- sq. feet
|
- baths - beds |
show details | |

|
#34
Citori Path
New Braunfels, TX 78130
|
- sq. feet
|
- baths - beds |
show details | |

|
#35
Potthast Dr
New Braunfels, TX 78130
|
1,664 sq. feet
|
- baths - beds |
show details | |

|
#36
Aller
New Braunfels, TX 78130
|
- sq. feet
|
- baths - beds |
show details | |

|
#37
Klein Mdws
New Braunfels, TX 78130
|
- sq. feet
|
- baths - beds |
show details | |

|
#38
Primrose Way
New Braunfels, TX 78132
|
- sq. feet
|
- baths - beds |
show details | |

|
#39
Kinzig Dr
New Braunfels, TX 78130
|
- sq. feet
|
- baths - beds |
show details | |

|
#40
Colin Rdg
New Braunfels, TX 78132
|
- sq. feet
|
- baths - beds |
show details |
| Photo | Address | Area | Beds / Baths | Price | Details |
|---|---|---|---|---|---|

|
#41
Autumn Rouge
New Braunfels, TX 78130
|
- sq. feet
|
- baths - beds |
show details | |

|
#42
Daisy Way
New Braunfels, TX 78132
|
- sq. feet
|
- baths - beds |
show details | |

|
#43
Wall St
New Braunfels, TX 78130
|
- sq. feet
|
- baths - beds |
show details | |

|
#44
Creekside Way Apt 2307
New Braunfels, TX 78130
|
- sq. feet
|
- baths - beds |
show details | |

|
#45
Conner Dr
New Braunfels, TX 78130
|
- sq. feet
|
- baths - beds |
show details | |

|
#46
Autumn Rouge
New Braunfels, TX 78130
|
- sq. feet
|
- baths - beds |
show details | |

|
#47
Colony Inn
New Braunfels, TX 78132
|
- sq. feet
|
- baths - beds |
show details | |

|
#48
Nicholas Cv
New Braunfels, TX 78130
|
- sq. feet
|
- baths - beds |
show details | |

|
#49
Hillsong St
New Braunfels, TX 78132
|
- sq. feet
|
- baths - beds |
show details | |

|
Check over 1 million property listings on Foreclosure.com!
|
browse all offers | |||


Median year apartment built: 2004
Household type by relationship:
Households: 98,643- Male householders: 18,705 (4,648 living alone), Female householders: 21,384 (7,931 living alone)
20,205 spouses (19,817 opposite-sex spouses), 2,738 unmarried partners, (2,617 opposite-sex unmarried partners), 26,273 children (23,418 natural, 1,059 adopted, 1,796 stepchildren), 2,128 grandchildren, 955 brothers or sisters, 1,256 parents, 0 foster children, 1,937 other relatives, 1,808 non-relatives
- In group quarters: 1,254
Size of family households: 10,842 2-persons, 7,396 3-persons, 5,018 4-persons, 1,619 5-persons, 446 6-persons, 490 7-or-more-persons.
Size of nonfamily households: 12,579 1-person, 1,557 2-persons, 142 3-persons.
13,505 married couples with children.
4,327 single-parent households (1,053 men, 3,274 women).
78.8% of residents of New Braunfels speak English at home.
19.4% of residents speak Spanish at home (76% speak English very well, 11% speak English well, 10% speak English not well, 2% don't speak English at all).
1.4% of residents speak other Indo-European language at home (86% speak English very well, 12% speak English well, 2% speak English not well).
0.3% of residents speak Asian or Pacific Island language at home (74% speak English very well, 24% speak English well, 2% speak English not well).
0.1% of residents speak other language at home (100% speak English very well).
Foreign born population: 6,866 (7.0%)
(56.7% of them are naturalized citizens)
| Here: | 6.1 |
| State: | 6.3 |
| Here: | 4.1 |
| State: | 4.0 |
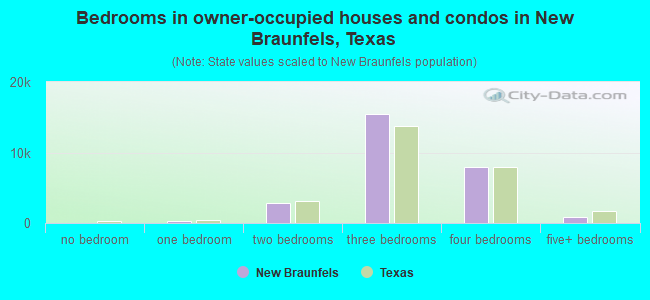
- Bedrooms in owner-occupied houses and condos in New Braunfels, Texas
- 52no bedroom
- 2711 bedroom
- 2,7682 bedrooms
- 15,4893 bedrooms
- 7,8804 bedrooms
- 8085+ bedrooms
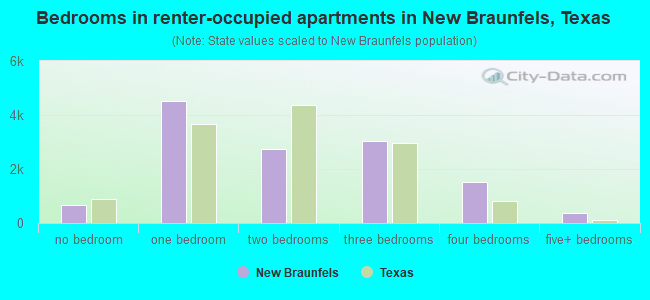
- Bedrooms in renter-occupied apartments in New Braunfels, Texas
- 673no bedroom
- 4,5311 bedroom
- 2,7242 bedrooms
- 3,0243 bedrooms
- 1,5064 bedrooms
- 3635+ bedrooms
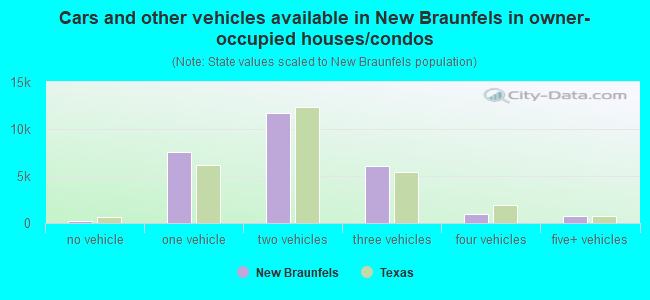
- Cars and other vehicles available in New Braunfels in owner-occupied houses/condos
- 210no vehicle
- 7,5681 vehicle
- 11,6832 vehicles
- 6,0543 vehicles
- 9854 vehicles
- 7685+ vehicles
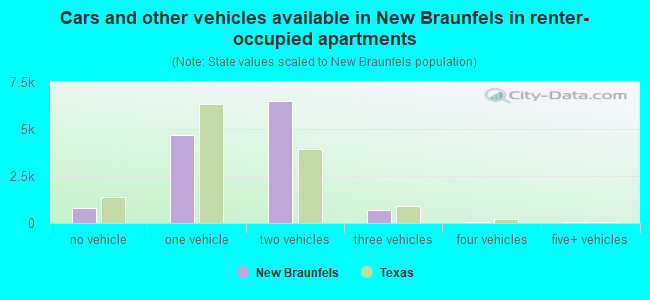
- Cars and other vehicles available in New Braunfels in renter-occupied apartments
- 779no vehicle
- 4,6701 vehicle
- 6,5092 vehicles
- 7053 vehicles
- 794 vehicles
- 795+ vehicles
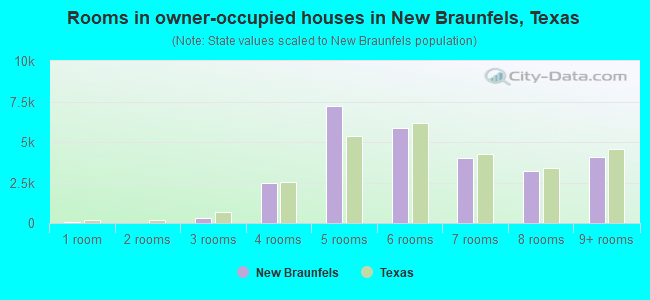
- Rooms in owner-occupied houses in New Braunfels, Texas
- 521 room
- 02 rooms
- 2953 rooms
- 2,4974 rooms
- 7,1955 rooms
- 5,8946 rooms
- 4,0067 rooms
- 3,2308 rooms
- 4,0999+ rooms
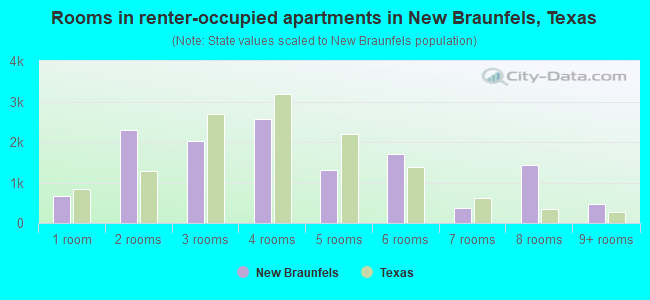
- Rooms in renter-occupied apartments in New Braunfels, Texas
- 6731 room
- 2,3062 rooms
- 2,0173 rooms
- 2,5694 rooms
- 1,3045 rooms
- 1,6946 rooms
- 3737 rooms
- 1,4258 rooms
- 4609+ rooms

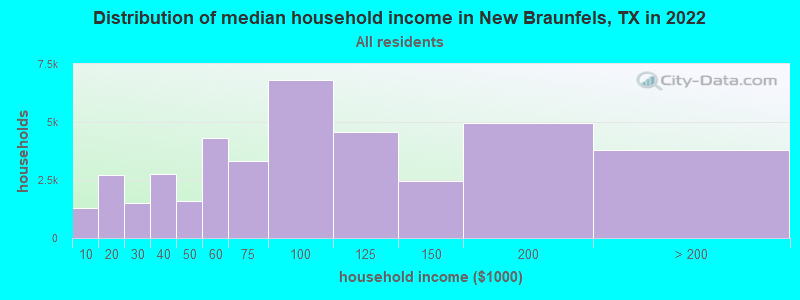
New Braunfels, TX household income distribution

- 1,281Less than $10,000
- 2,718$10,000 to $19,999
- 1,514$20,000 to $29,999
- 2,740$30,000 to $39,999
- 1,601$40,000 to $49,999
- 4,330$50,000 to $59,999
- 3,328$60,000 to $74,999
- 6,804$75,000 to $99,999
- 4,559$100,000 to $124,999
- 2,461$125,000 to $149,999
- 4,949$150,000 to $199,999
- 3,804$200,000 or more
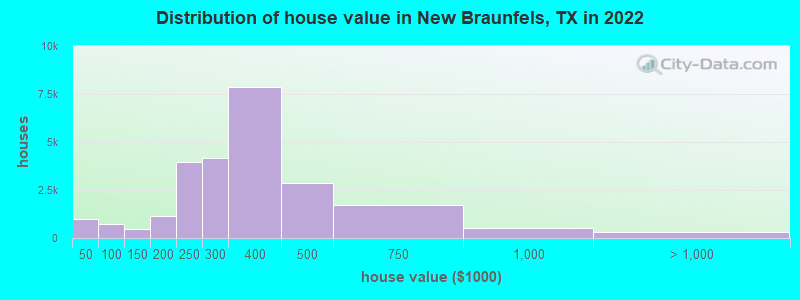
Home value of owner - occupied houses in 2022 in New Braunfels, TX
-
- 316Less than $10,000
- 31$10,000 to $14,999
- 143$15,000 to $19,999
- 206$20,000 to $24,999
- 80$30,000 to $34,999
- 43$35,000 to $39,999
- 183$40,000 to $49,999
- 188$50,000 to $59,999
- 93$60,000 to $69,999
- 94$70,000 to $79,999
- 79$80,000 to $89,999
- 65$90,000 to $99,999
- 236$100,000 to $124,999
- 206$125,000 to $149,999
- 672$150,000 to $174,999
- 477$175,000 to $199,999
- 3,976$200,000 to $249,999
- 4,140$250,000 to $299,999
- 7,850$300,000 to $399,999
- 2,872$400,000 to $499,999
- 1,723$500,000 to $749,999
- 544$750,000 to $999,999
- 152$1,000,000 to $1,499,999
- 68$1,500,000 to $1,999,999
- 82$2,000,000 or more
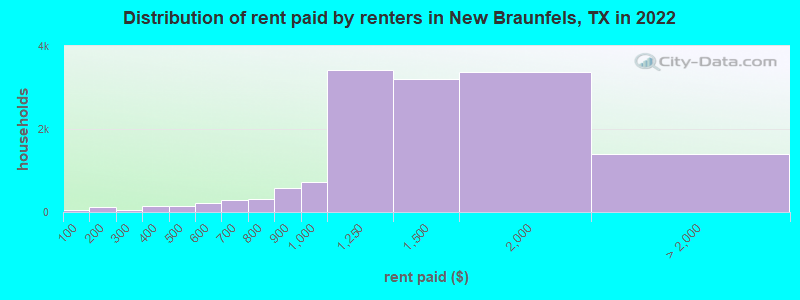
Rent paid by renters in 2022 in New Braunfels, TX
-
- 58Less than $100
- 127$150 to $199
- 53$200 to $249
- 142$350 to $399
- 45$400 to $449
- 91$450 to $499
- 155$500 to $549
- 66$550 to $599
- 167$600 to $649
- 123$650 to $699
- 16$700 to $749
- 294$750 to $799
- 574$800 to $899
- 720$900 to $999
- 3,419$1,000 to $1,249
- 3,214$1,250 to $1,499
- 3,370$1,500 to $1,999
- 692$2,000 to $2,499
- 173$2,500 to $2,999
- 16$3,000 to $3,499
- 153$3,500 or more
- 353No cash rent
Percentage of workers working in this county: 59.2%
Number of people working at home: 7,378 (15.1% of all workers)
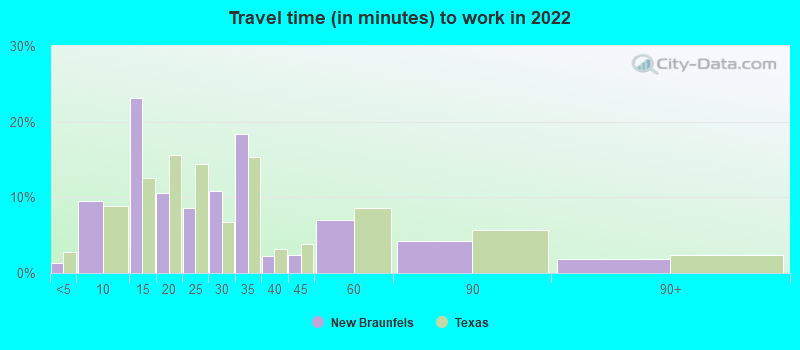
Travel time to work (commute)
- Less than 5 minutes: 764
- 5 to 9 minutes: 4,681
- 10 to 14 minutes: 9,093
- 15 to 19 minutes: 4,764
- 20 to 24 minutes: 3,499
- 25 to 29 minutes: 3,860
- 30 to 34 minutes: 6,372
- 35 to 39 minutes: 842
- 40 to 44 minutes: 1,148
- 45 to 59 minutes: 4,922
- 60 to 89 minutes: 3,114
- 90 or more minutes: 989
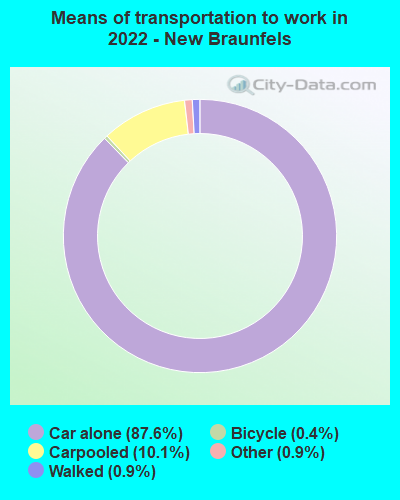
Means of transportation to work:
- Drove a car alone: 37,868 (74.0%)
- Carpooled: 4,731 (9.2%)
- Bus: 26 (0.1%)
- Ferryboat: 34 (0.1%)
- Taxi: 476 (0.9%)
- Bicycle: 155 (0.3%)
- Walked: 435 (0.8%)
- Worked at home: 7,378 (14.4%)
- Unemployment by race in 2022
- Unemployment rate for White non-Hispanic residents
- 0.9%Males
- 8.4%Females
- Unemployment rate for Black residents
- 3.4%Males
- Unemployment rate for American Indian and Alaska Native residents
- 38.9%Females
- Unemployment rate for Asian residents
- 1.4%Females
- Unemployment rate for other race residents
- 1.5%Males
- 3.7%Females
- Unemployment rate for two or more race residents
- 3.4%Males
- 1.5%Females
- Unemployment rate for Hispanic or Latino residents
- 1.8%Males
- 1.0%Females
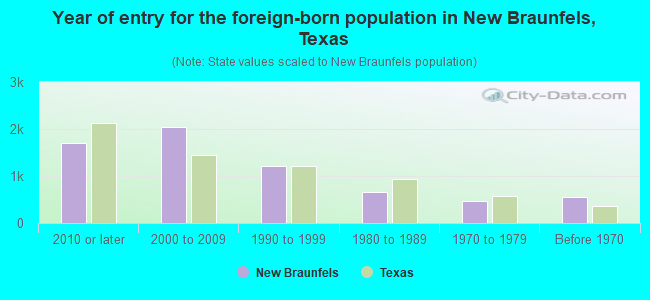
- Year of entry for the foreign-born population in New Braunfels, Texas
- 1,6922010 or later
- 2,0432000 to 2009
- 1,2191990 to 1999
- 6701980 to 1989
- 4691970 to 1979
- 543Before 1970
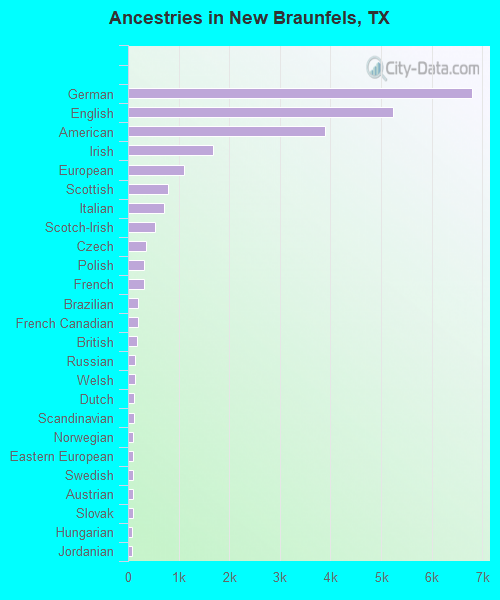
First ancestries reported:
- German: 6,792 (14.0%)
- English: 5,230 (10.8%)
- American: 3,883 (8.0%)
- Irish: 1,686 (3.5%)
- European: 1,108 (2.3%)
- Scottish: 799 (1.6%)
- Italian: 710 (1.5%)
- Scotch-Irish: 533 (1.1%)
- Czech: 350 (0.7%)
- Polish: 319 (0.7%)
- French: 318 (0.7%)
- Brazilian: 200 (0.4%)
- French Canadian: 190 (0.4%)
- British: 171 (0.4%)
- Russian: 145 (0.3%)
- Welsh: 136 (0.3%)
- Dutch: 122 (0.3%)
- Scandinavian: 109 (0.2%)
- Norwegian: 104 (0.2%)
- Eastern European: 99 (0.2%)
- Swedish: 98 (0.2%)
- Austrian: 97 (0.2%)
- Slovak: 92 (0.2%)
- Hungarian: 88 (0.2%)
- Jordanian: 74 (0.2%)
- Celtic: 71 (0.1%)
- Canadian: 55 (0.1%)
- Czechoslovakian: 50 (0.1%)
- Basque: 48 (0.10%)
- Danish: 36 (0.07%)
- Swiss: 35 (0.07%)
- Portuguese: 30 (0.06%)
- African: 30 (0.06%)
- Australian: 29 (0.06%)
- Pennsylvania German: 28 (0.06%)
- West Indian: 24 (0.05%)
- Northern European: 22 (0.05%)
- Finnish: 18 (0.04%)
- Ukrainian: 15 (0.03%)
- Lithuanian: 14 (0.03%)
- Belgian: 13 (0.03%)
- Romanian: 8 (0.02%)
Most common places of birth for foreign-born residents (%):
| New Braunfels: | 63.4% (4,328) |
| Texas: | 48.4% (2,411,723) |
| New Braunfels: | 6.0% (413) |
| Texas: | 1.1% (55,371) |
| New Braunfels: | 2.4% (165) |
| Texas: | 0.4% (21,746) |
| New Braunfels: | 1.9% (128) |
| Texas: | 0.8% (37,989) |
| New Braunfels: | 1.9% (128) |
| Texas: | 1.3% (62,978) |
| New Braunfels: | 1.8% (121) |
| Texas: | 1.5% (72,413) |
| New Braunfels: | 1.8% (120) |
| Texas: | 6.1% (306,347) |
| New Braunfels: | 1.7% (116) |
| Texas: | 0.2% (9,236) |
Place of birth for U.S.-born residents:
- This state: 59,091
- Other state: 30,770
- Northeast: 3,281
- Midwest: 7,482
- South: 7,770
- West: 12,237
81.1% of New Braunfels residents lived in the same house 1 years ago.
Out of people who lived in different houses, 9.4% lived in this county.
Out of people who lived in different counties, 58.2% lived in Texas.
| New Braunfels: | 81.1% |
| State average: | 85.7% |
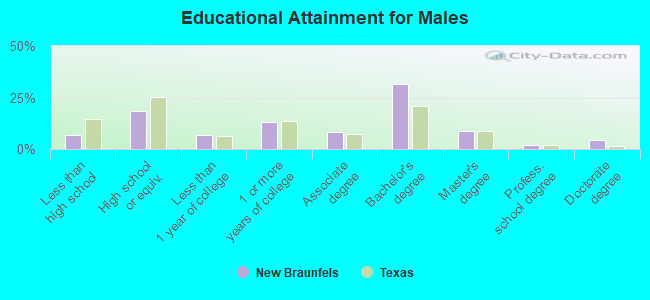
Education attainment for males 25 years and older:
- No schooling: 271
- Nursery to 4th grade: 152
- 5th and 6th grade: 71
- 7th and 8th grade: 339
- 9th grade: 83
- 10th grade: 869
- 11th grade: 0
- 12th grade, no diploma: 428
- High school graduate (or equivalency): 6,002
- Less than 1 year of college: 2,288
- Some college more than 1 year, no degree: 4,193
- Associate degree: 2,737
- Bachelor's degree: 10,291
- Master's degree: 2,798
- Professional school degree: 569
- Doctorate degree: 1,464
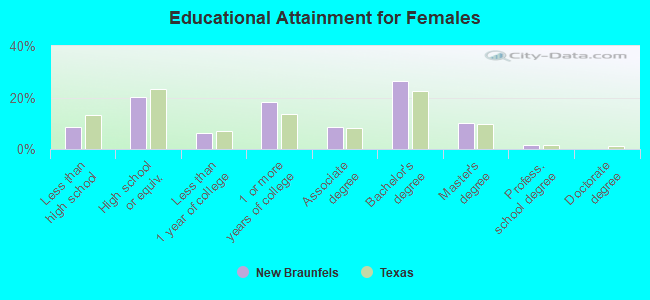
Education attainment for females 25 years and older:
- No schooling: 301
- Nursery to 4th grade: 0
- 5th and 6th grade: 327
- 7th and 8th grade: 342
- 9th grade: 219
- 10th grade: 282
- 11th grade: 1,014
- 12th grade, no diploma: 481
- High school graduate (or equivalency): 7,205
- Less than 1 year of college: 2,263
- Some college more than 1 year, no degree: 6,545
- Associate degree: 3,084
- Bachelor's degree: 9,363
- Master's degree: 3,532
- Professional school degree: 543
- Doctorate degree: 0
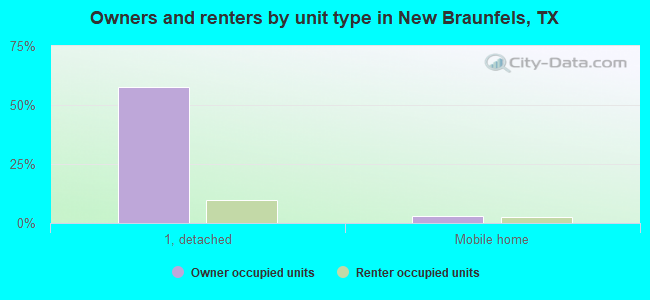
Housing units in structures:
- One, detached: 32,838
- One, attached: 1,141
- Two: 941
- 3 or 4: 1,063
- 5 to 9: 783
- 10 to 19: 559
- 20 to 49: 2,380
- 50 or more: 3,013
- Mobile homes: 1,440
Median worth of mobile homes: $49,900
Housing units lacking complete kitchen facilities in 2022: 2.1%
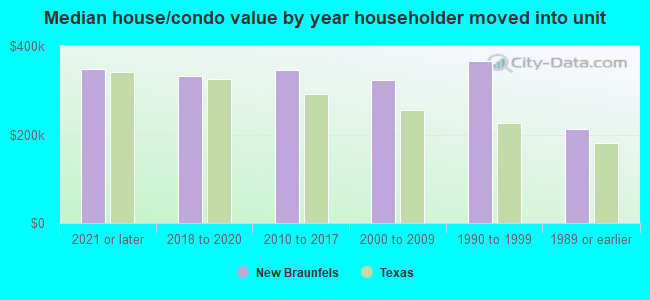
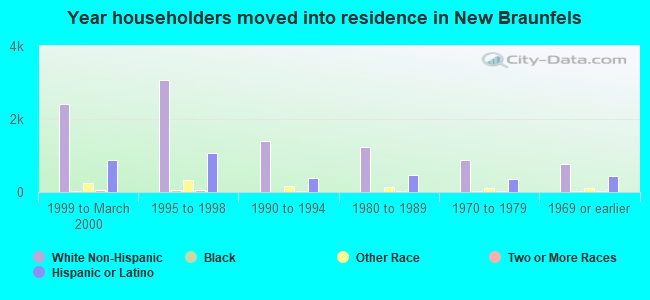
House/condo owner moved in on average 6 years ago
Renter moved in on average 2 years ago
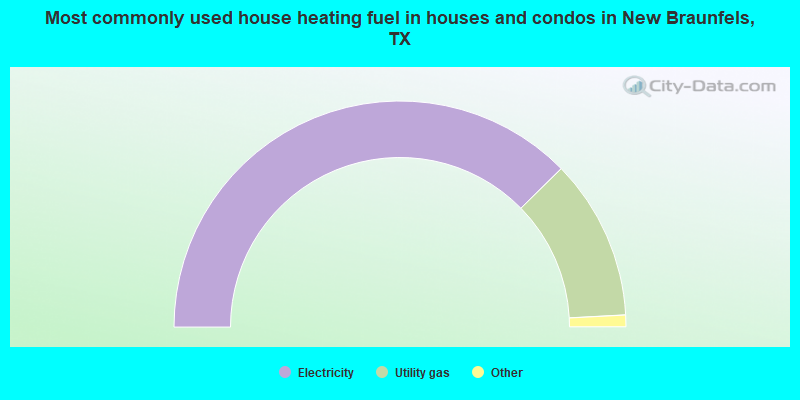
- 75.3%Electricity
- 23.0%Utility gas
- 1.1%Bottled, tank, or LP gas
- 0.5%No fuel used
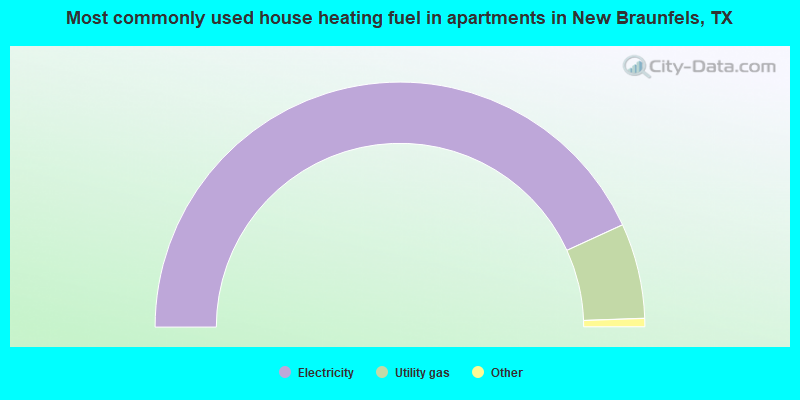
- 86.3%Electricity
- 12.6%Utility gas
- 1.0%No fuel used
- 0.1%Bottled, tank, or LP gas
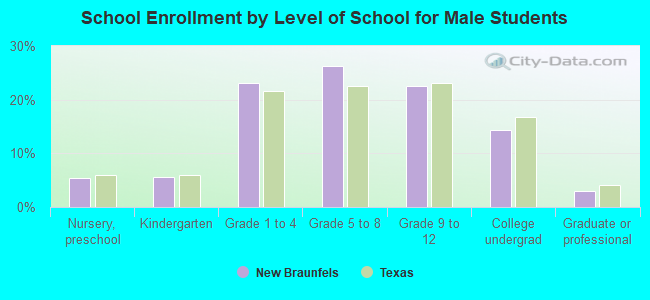
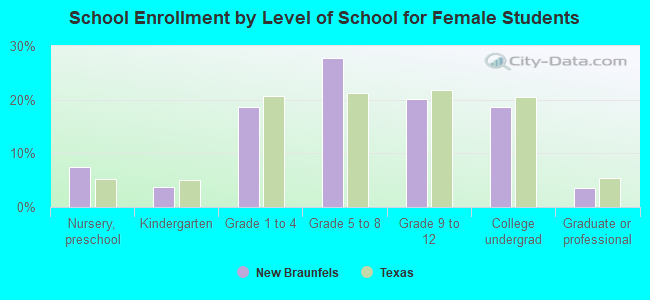
Private vs. public school enrollment:
| Here: | 19.8% |
| Texas: | 8.8% |
| Here: | 26.4% |
| Texas: | 8.0% |
| Here: | 28.6% |
| Texas: | 16.2% |