Housing density: 1,229 houses/condos per square mile
Median price asked for vacant for-sale houses and condos in 2022 in this county: $628,500.
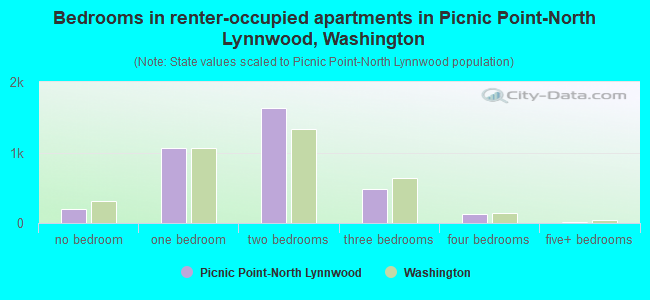
Median contract rent in 2022: $1,834 (lower quartile is $1,544, upper quartile is over $2,000)
Median rent asked for vacant for-rent units in 2022: $1,834
Median gross rent in Picnic Point-North Lynnwood, WA in 2022: $1,928
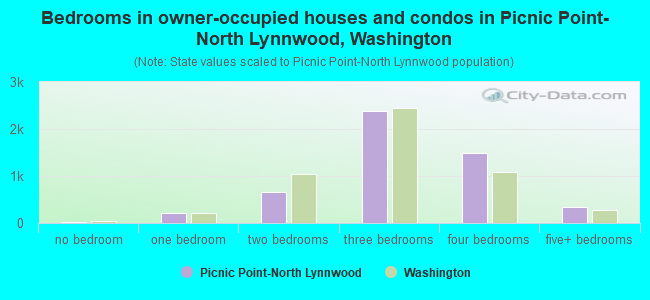
Housing units in Picnic Point-North Lynnwood with a mortgage: 3,824 (500 second mortgage, 453 home equity loan, 19 both second mortgage and home equity loan) Houses without a mortgage: 537
Compare current foreclosures near Picnic Point-North Lynnwood, WA:
In family households: 589,694 (132,675 male householders, 49,607 female householders)
140,500 spouses, 208,748 children (193,212 natural, 5,027 adopted, 10,509 stepchildren), 9,881 grandchildren, 6,965 brothers or sisters, 6,533 parents, foster children, 9,131 other relatives, 20,713 non-relatives
In nonfamily households: 113,244 (43,016 male householders (30,707 living alone)), 43,027 female householders (34,612 living alone)), 27,201 nonrelatives
In group quarters: 10,397 (5,769 institutionalized population)
121,078 married couples with children.
33,184 single-parent households (9,051 men, 24,133 women).
80.9% of residents of Picnic Point-North Lynnwood speak English at home.
4.0% of residents speak Spanish at home (62% speak English very well, 21% speak English well, 12% speak English not well, 5% don't speak English at all).
4.8% of residents speak other Indo-European language at home (68% speak English very well, 21% speak English well, 10% speak English not well, 1% don't speak English at all).
8.8% of residents speak Asian or Pacific Island language at home (52% speak English very well, 30% speak English well, 15% speak English not well, 3% don't speak English at all).
1.5% of residents speak other language at home (38% speak English very well, 49% speak English well, 11% speak English not well, 2% don't speak English at all).
Foreign born population: 9,853 (31.1%)
(42.6% of them are naturalized citizens)
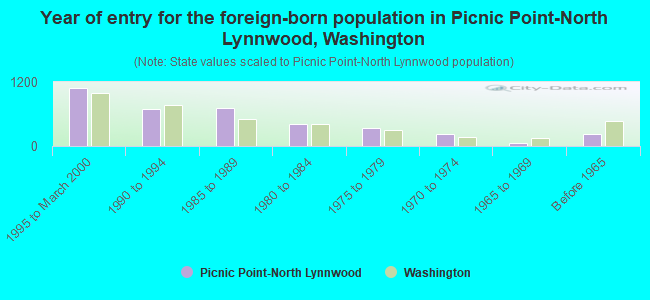
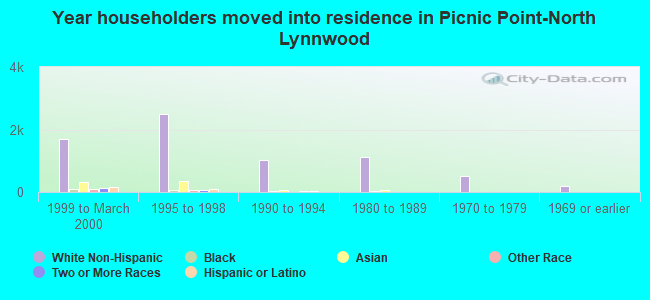
Year of entry for the foreign-born population in Picnic Point-North Lynnwood, Washington
1,0921995 to March 2000
6911990 to 1994
7161985 to 1989
4121980 to 1984
3391975 to 1979
2311970 to 1974
651965 to 1969
234Before 1965
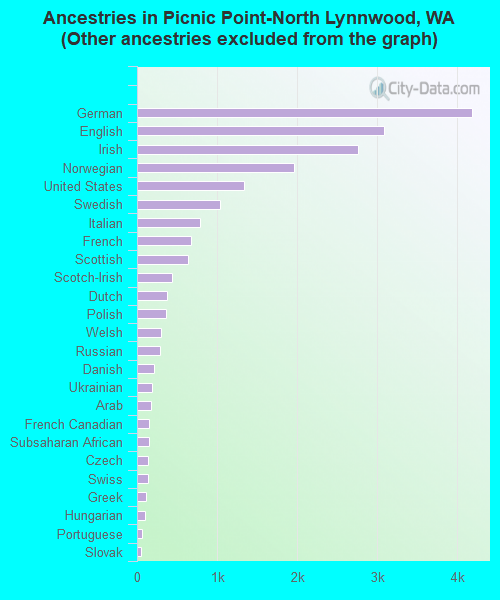
First ancestries reported:
Other: 6,538 (24.9%)
German: 4,186 (15.9%)
English: 3,083 (11.7%)
Irish: 2,755 (10.5%)
Norwegian: 1,956 (7.5%)
United States: 1,332 (5.1%)
Swedish: 1,037 (4.0%)
Italian: 783 (3.0%)
French: 679 (2.6%)
Scottish: 632 (2.4%)
Scotch-Irish: 433 (1.6%)
Dutch: 377 (1.4%)
Polish: 356 (1.4%)
Welsh: 298 (1.1%)
Russian: 293 (1.1%)
Danish: 212 (0.8%)
Ukrainian: 183 (0.7%)
Arab: 174 (0.7%)
French Canadian: 155 (0.6%)
Subsaharan African: 147 (0.6%)
Czech: 137 (0.5%)
Swiss: 132 (0.5%)
Greek: 109 (0.4%)
Hungarian: 105 (0.4%)
Portuguese: 68 (0.3%)
Slovak: 54 (0.2%)
Lithuanian: 31 (0.1%)
Most common places of birth for foreign-born residents (%):
Korea
Picnic Point-North Lynnwood:
21.8% (825)
Washington:
6.2% (38,172)
Philippines
Picnic Point-North Lynnwood:
9.4% (356)
Washington:
7.6% (46,733)
Mexico
Picnic Point-North Lynnwood:
6.3% (239)
Washington:
24.1% (148,115)
Vietnam
Picnic Point-North Lynnwood:
6.3% (238)
Washington:
6.7% (40,879)
Canada
Picnic Point-North Lynnwood:
4.9% (187)
Washington:
7.7% (47,568)
Ukraine
Picnic Point-North Lynnwood:
3.4% (127)
Washington:
3.0% (18,572)
United Kingdom
Picnic Point-North Lynnwood:
3.3% (124)
Washington:
3.3% (20,321)
Egypt
Picnic Point-North Lynnwood:
3.0% (115)
Washington:
0.2% (1,187)
El Salvador
Picnic Point-North Lynnwood:
2.9% (110)
Washington:
0.7% (4,492)
Japan
Picnic Point-North Lynnwood:
2.8% (104)
Washington:
2.8% (16,936)
Russia
Picnic Point-North Lynnwood:
2.8% (104)
Washington:
2.5% (15,491)
Hong Kong
Picnic Point-North Lynnwood:
2.4% (91)
Washington:
1.0% (6,263)
Other Northern Europe
Picnic Point-North Lynnwood:
2.1% (79)
Washington:
1.0% (6,393)
Other Western Asia
Picnic Point-North Lynnwood:
2.0% (75)
Washington:
0.4% (2,661)
Pakistan
Picnic Point-North Lynnwood:
1.9% (72)
Washington:
0.3% (1,975)
Germany
Picnic Point-North Lynnwood:
1.8% (68)
Washington:
3.4% (21,167)
Iran
Picnic Point-North Lynnwood:
1.8% (67)
Washington:
0.7% (4,573)
Other Eastern Africa
Picnic Point-North Lynnwood:
1.7% (65)
Washington:
1.0% (6,438)
China, excluding Hong Kong and Taiwan
Picnic Point-North Lynnwood:
1.5% (58)
Washington:
3.3% (20,530)
Place of birth for U.S.-born residents:
This state: 10,754
Other state: 8,120
Northeast: 909
Midwest: 2,045
South: 1,063
West: 4,103
44% of Picnic Point-North Lynnwood residents lived in the same house 5 years ago. Out of people who lived in different houses, 48% lived in this county. Out of people who lived in different counties, 56% lived in Washington.
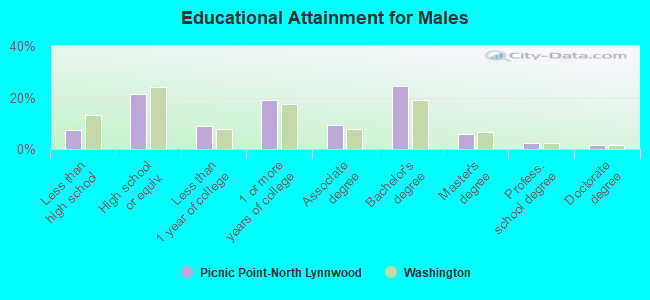
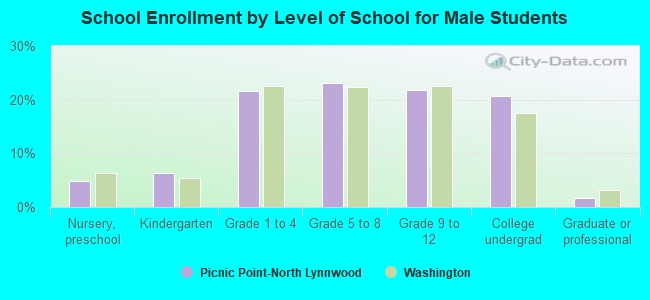
Education attainment for males 25 years and older:
No schooling: 16
Nursery to 4th grade: 0
5th and 6th grade: 51
7th and 8th grade: 46
9th grade: 89
10th grade: 86
11th grade: 112
12th grade, no diploma: 132
High school graduate (or equivalency): 1,543
Less than 1 year of college: 631
Some college more than 1 year, no degree: 1,358
Associate degree: 659
Bachelor's degree: 1,746
Master's degree: 419
Professional school degree: 155
Doctorate degree: 125
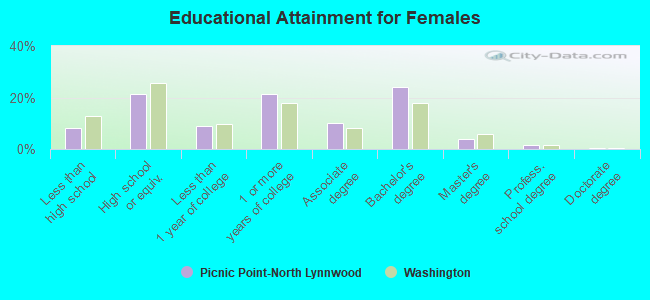
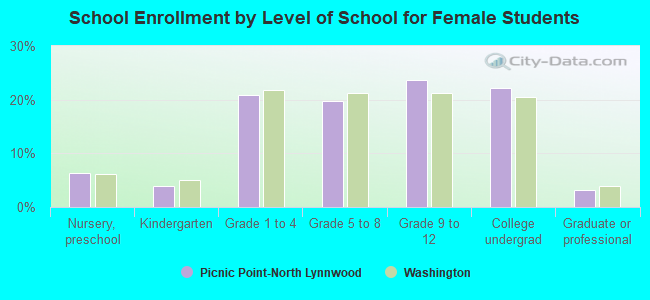
Education attainment for females 25 years and older:
No schooling: 32
Nursery to 4th grade: 29
5th and 6th grade: 22
7th and 8th grade: 30
9th grade: 86
10th grade: 124
11th grade: 136
12th grade, no diploma: 154
High school graduate (or equivalency): 1,591
Less than 1 year of college: 646
Some college more than 1 year, no degree: 1,566
Associate degree: 753
Bachelor's degree: 1,773
Master's degree: 295
Professional school degree: 116
Doctorate degree: 34
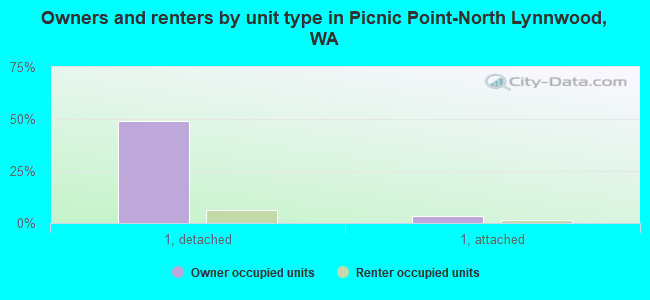
Housing units in structures:
One, detached: 4,844
One, attached: 454
Two: 171
3 or 4: 465
5 to 9: 749
10 to 19: 1,026
20 to 49: 519
50 or more: 438
Mobile homes: 348
Boats, RVs, vans, etc.: 45
Median worth of mobile homes: $94,668
Housing units lacking complete plumbing facilities: 0.0%
Housing units lacking complete kitchen facilities: 0.1%