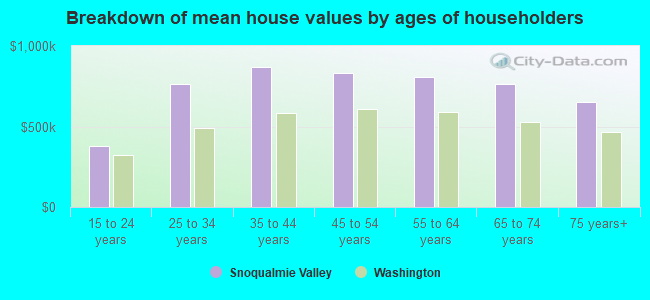
Median price asked for vacant for-sale houses and condos in 2022 in this county: $843,880.
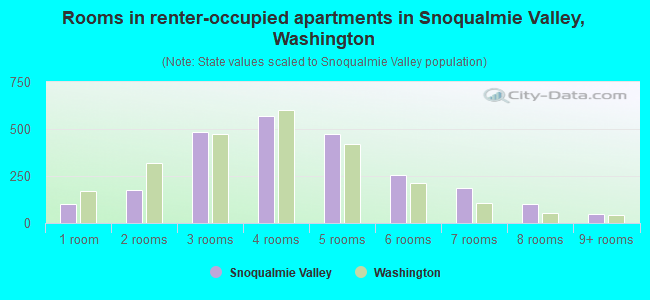
Median contract rent in 2022: $1,903 (lower quartile is $1,354, upper quartile is over $2,000)
Median rent asked for vacant for-rent units in 2022: $1,895
Median gross rent in Snoqualmie Valley, WA in 2022: over $2,000
Housing units in Snoqualmie Valley with a mortgage: 7,645 (1,014 second mortgage, 929 home equity loan, 26 both second mortgage and home equity loan) Houses without a mortgage: 1,303
Compare current foreclosures near Snoqualmie Valley, WA:
In family households: 1,455,162 (324,509 male householders, 137,001 female householders)
357,491 spouses, 491,900 children (462,739 natural, 12,743 adopted, 16,418 stepchildren), 22,208 grandchildren, 21,116 brothers or sisters, 17,956 parents, foster children, 25,527 other relatives, 45,636 non-relatives
In nonfamily households: 438,956 (162,683 male householders (115,616 living alone)), 165,039 female householders (129,083 living alone)), 111,234 nonrelatives
In group quarters: 37,131 (10,490 institutionalized population)
277,933 married couples with children.
81,653 single-parent households (19,170 men, 62,483 women).
93.5% of residents of Snoqualmie Valley speak English at home.
3.2% of residents speak Spanish at home (69% speak English very well, 13% speak English well, 14% speak English not well, 5% don't speak English at all).
2.1% of residents speak other Indo-European language at home (84% speak English very well, 11% speak English well, 4% speak English not well).
1.1% of residents speak Asian or Pacific Island language at home (57% speak English very well, 24% speak English well, 18% speak English not well, 1% don't speak English at all).
0.1% of residents speak other language at home (82% speak English very well, 18% speak English well).
Foreign born population: 3,507 (7.3%)
(51.2% of them are naturalized citizens)
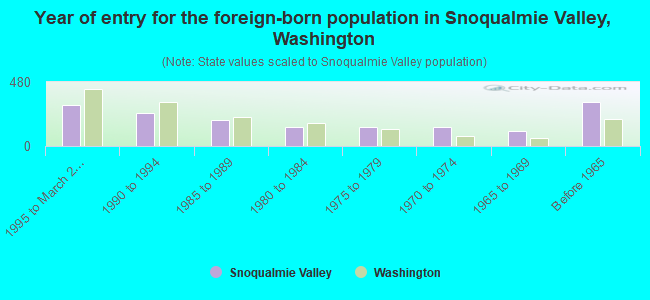
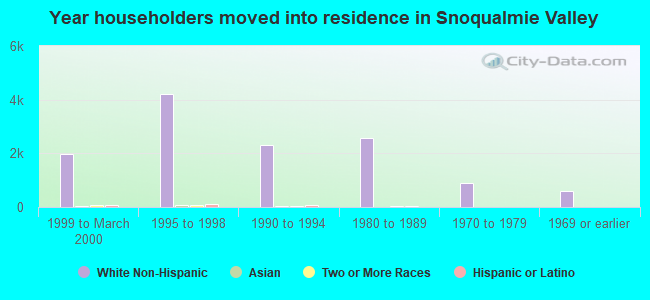
Year of entry for the foreign-born population in Snoqualmie Valley, Washington
3081995 to March 2000
2511990 to 1994
1941985 to 1989
1391980 to 1984
1441975 to 1979
1421970 to 1974
1141965 to 1969
330Before 1965
Most common places of birth for foreign-born residents (%):
Canada
Snoqualmie Valley:
17.3% (280)
Washington:
7.7% (47,568)
Mexico
Snoqualmie Valley:
15.8% (256)
Washington:
24.1% (148,115)
Germany
Snoqualmie Valley:
10.8% (175)
Washington:
3.4% (21,167)
United Kingdom
Snoqualmie Valley:
10.2% (165)
Washington:
3.3% (20,321)
Romania
Snoqualmie Valley:
4.3% (70)
Washington:
0.7% (4,345)
Vietnam
Snoqualmie Valley:
3.6% (59)
Washington:
6.7% (40,879)
Korea
Snoqualmie Valley:
2.9% (47)
Washington:
6.2% (38,172)
Philippines
Snoqualmie Valley:
2.8% (46)
Washington:
7.6% (46,733)
Other Northern Europe
Snoqualmie Valley:
2.3% (38)
Washington:
1.0% (6,393)
Japan
Snoqualmie Valley:
2.2% (36)
Washington:
2.8% (16,936)
Guatemala
Snoqualmie Valley:
2.2% (35)
Washington:
0.5% (3,096)
France
Snoqualmie Valley:
2.1% (34)
Washington:
0.5% (3,086)
Czechoslovakia (includes Czech Republic and Slovakia)
Snoqualmie Valley:
2.0% (32)
Washington:
0.3% (2,041)
China, excluding Hong Kong and Taiwan
Snoqualmie Valley:
2.0% (32)
Washington:
3.3% (20,530)
Argentina
Snoqualmie Valley:
1.8% (30)
Washington:
0.2% (1,049)
Thailand
Snoqualmie Valley:
1.8% (29)
Washington:
1.0% (6,294)
Polynesia
Snoqualmie Valley:
1.8% (29)
Washington:
0.3% (1,748)
Malaysia
Snoqualmie Valley:
1.5% (25)
Washington:
0.2% (1,500)
Place of birth for U.S.-born residents:
This state: 19,582
Other state: 15,252
Northeast: 1,871
Midwest: 4,324
South: 1,985
West: 7,072
55% of Snoqualmie Valley residents lived in the same house 5 years ago. Out of people who lived in different houses, 66% lived in this county. Out of people who lived in different counties, 33% lived in Washington.
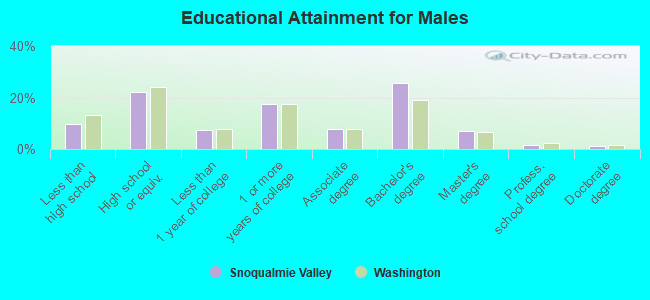
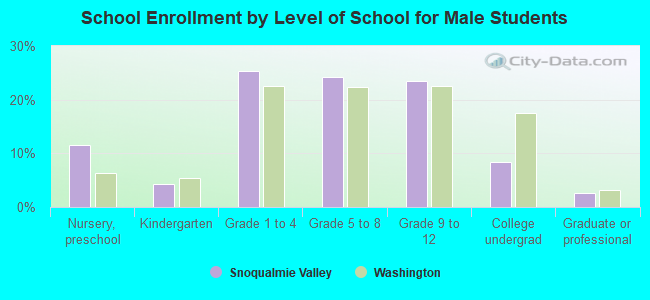
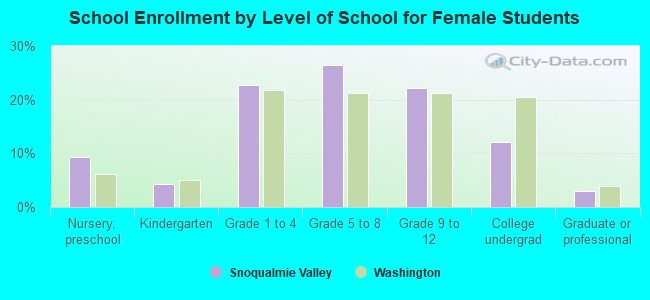
Education attainment for males 25 years and older:
No schooling: 23
Nursery to 4th grade: 29
5th and 6th grade: 40
7th and 8th grade: 143
9th grade: 150
10th grade: 158
11th grade: 280
12th grade, no diploma: 343
High school graduate (or equivalency): 2,652
Less than 1 year of college: 887
Some college more than 1 year, no degree: 2,067
Associate degree: 939
Bachelor's degree: 3,064
Master's degree: 819
Professional school degree: 195
Doctorate degree: 134
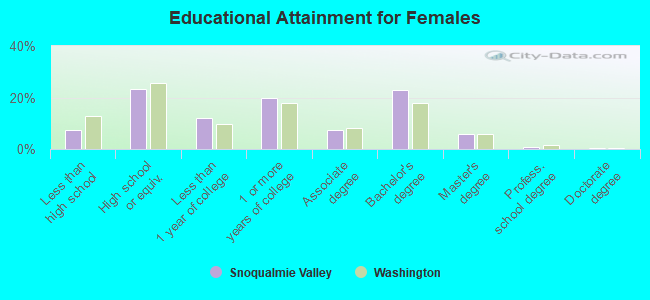
Education attainment for females 25 years and older:
No schooling: 26
Nursery to 4th grade: 0
5th and 6th grade: 17
7th and 8th grade: 123
9th grade: 74
10th grade: 242
11th grade: 182
12th grade, no diploma: 236
High school graduate (or equivalency): 2,782
Less than 1 year of college: 1,426
Some college more than 1 year, no degree: 2,361
Associate degree: 899
Bachelor's degree: 2,745
Master's degree: 698
Professional school degree: 108
Doctorate degree: 63
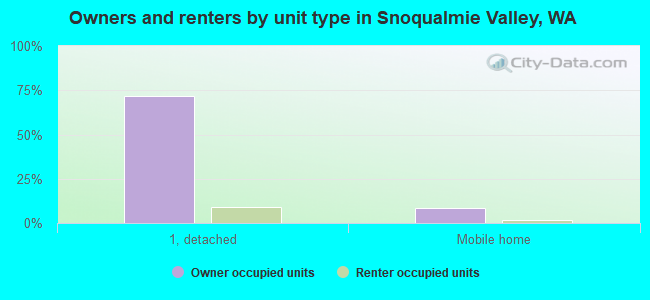
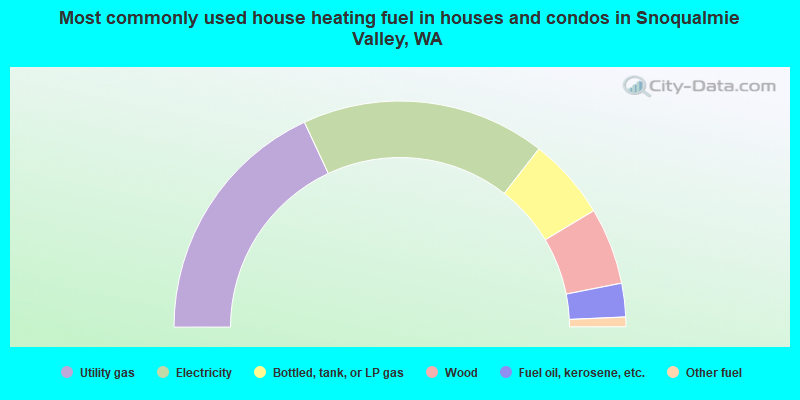
Housing units in structures:
One, detached: 11,401
One, attached: 261
Two: 113
3 or 4: 280
5 to 9: 236
10 to 19: 178
20 to 49: 258
50 or more: 64
Mobile homes: 1,425
Boats, RVs, vans, etc.: 65
Median worth of mobile homes: $316,418
Housing units lacking complete plumbing facilities: 0.8%
Housing units lacking complete kitchen facilities: 1.0%