Wheaton-Glenmont, MD (Maryland) Houses and Residents
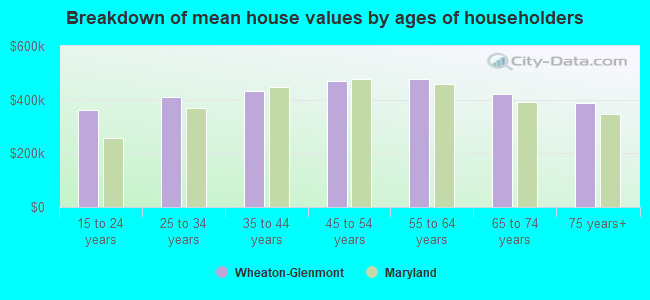
| Wheaton-Glenmont: | $468,226 |
| Maryland: | $398,100 |
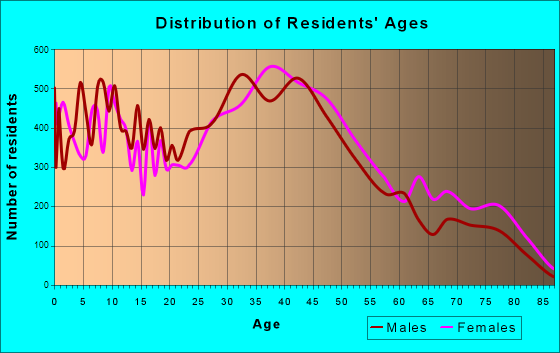
Total population: 61,910 (Urban population: 57,723, Rural population: 0)
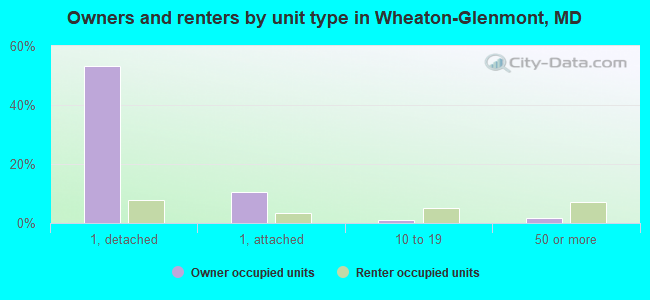
Houses: 20,134 (19,582 occupied: 13,235 owner occupied, 6,347 renter occupied)
| % of renters here: | 32% |
| State: | 32% |
Housing density: 1,967 houses/condos per square mile
Median price asked for vacant for-sale houses and condos in 2022 in this county: $868,821.
Median contract rent in 2022: $1,721 (lower quartile is $1,400, upper quartile is over $2,000)
Median rent asked for vacant for-rent units in 2022: $1,642
Median gross rent in Wheaton-Glenmont, MD in 2022: $1,845
Housing units in Wheaton-Glenmont with a mortgage: 9,507 (1,023 second mortgage, 941 home equity loan, 23 both second mortgage and home equity loan)
Houses without a mortgage: 2,585
Compare current foreclosures near Wheaton-Glenmont, MD:
| Photo | Address | Area | Beds / Baths | Price | Details |
|---|---|---|---|---|---|

|
#1
17th St NW Apt 504
Washington, DC 20009
|
800 sq. feet
|
1 baths 1 beds |
$405,000
|
show details |

|
#2
Gladys Retreat Cir
Bowie, MD 20720
|
2,880 sq. feet
|
3 baths 3 beds |
$409,900
|
show details |

|
#3
Eastern Ave NE
Washington, DC 20011
|
1,024 sq. feet
|
1 baths 3 beds |
$395,000
|
show details |

|
#4
Brooke Knolls Rd
Gaithersburg, MD 20882
|
1,704 sq. feet
|
3 baths 4 beds |
$681,500
|
show details |

|
#5
Monroe St NW
Washington, DC 20010
|
- sq. feet
|
2 baths 2 beds |
$665,000
|
show details |

|
#6
Addison Rd
Capitol Heights, MD 20743
|
1,400 sq. feet
|
1 baths 3 beds |
$260,000
|
show details |

|
#7
9th St NW
Washington, DC 20011
|
1,604 sq. feet
|
2 baths 3 beds |
$598,000
|
show details |

|
#8
Hammersmith Cir
Silver Spring, MD 20906
|
1,152 sq. feet
|
1 baths 3 beds |
$353,600
|
show details |

|
#9
Pooks Hill Rd Apt 1612s
Bethesda, MD 20814
|
1,250 sq. feet
|
1 baths 2 beds |
$289,000
|
show details |

|
#10
Cathedral Ave NW Apt 108
Washington, DC 20016
|
765 sq. feet
|
1 baths 1 beds |
$269,900
|
show details |
| Photo | Address | Area | Beds / Baths | Price | Details |
|---|---|---|---|---|---|

|
#11
Interlachen Dr Apt 111
Silver Spring, MD 20906
|
965 sq. feet
|
1 baths 2 beds |
$148,000
|
show details |

|
#12
Delaware Ave SW Apt N720
Washington, DC 20024
|
- sq. feet
|
1 baths 1 beds |
$149,900
|
show details |

|
#13
Mandan Rd Apt 103 Unit 621
Greenbelt, MD 20770
|
- sq. feet
|
2 baths 3 beds |
$179,900
|
show details |

|
#14
T St SE Apt 3
Washington, DC 20020
|
- sq. feet
|
2 baths 4 beds |
$339,900
|
show details |

|
#15
Holbrook Ter NE
Washington, DC 20002
|
3,164 sq. feet
|
4 baths 8 beds |
show details | |

|
#16
4th St NE Apt 2
Washington, DC 20002
|
1,061 sq. feet
|
2 baths 2 beds |
show details | |

|
#17
Brassie Pl Apt 201
Montgomery Village, MD 20886
|
1,054 sq. feet
|
2 baths 2 beds |
show details | |

|
#18
Bowen Rd SE Apt 403
Washington, DC 20020
|
930 sq. feet
|
1 baths 2 beds |
show details | |

|
#19
S Arbory Ln
Laurel, MD 20707
|
1,283 sq. feet
|
3 baths 3 beds |
show details | |

|
#20
Oakland Mills Rd
Columbia, MD 21046
|
- sq. feet
|
3 baths 4 beds |
show details |
| Photo | Address | Area | Beds / Baths | Price | Details |
|---|---|---|---|---|---|

|
#21
Rockville Pike Unit 712
Rockville, MD 20852
|
505 sq. feet
|
1 baths 1 beds |
show details | |

|
#22
Deanwood Dr
Capitol Heights, MD 20743
|
640 sq. feet
|
1 baths 1 beds |
show details | |

|
#23
Fern Pl NW
Washington, DC 20012
|
1,920 sq. feet
|
1 baths 4 beds |
show details | |

|
#24
Kipling Pkwy
District Heights, MD 20747
|
1,680 sq. feet
|
1 baths 3 beds |
show details | |

|
#25
Counsellor Dr
Vienna, VA 22181
|
1,916 sq. feet
|
2 baths 5 beds |
show details | |

|
#26
N Royal St
Alexandria, VA 22314
|
- sq. feet
|
1 baths 1 beds |
show details | |

|
#27
Scott Ave
Rockville, MD 20851
|
1,188 sq. feet
|
1 baths 3 beds |
show details | |

|
#28
46th St SE
Washington, DC 20019
|
1,232 sq. feet
|
2 baths 3 beds |
show details | |

|
#29
Pearl Fog Way
Dunn Loring, VA 22027
|
3,497 sq. feet
|
4 baths 4 beds |
show details | |

|
#30
Hummingbird Ter
Gaithersburg, MD 20879
|
1,472 sq. feet
|
2 baths 3 beds |
show details |
| Photo | Address | Area | Beds / Baths | Price | Details |
|---|---|---|---|---|---|

|
#31
Winthrop St
Oxon Hill, MD 20745
|
1,020 sq. feet
|
1 baths 3 beds |
show details | |

|
#32
Plainfield St
Falls Church, VA 22043
|
1,102 sq. feet
|
3 baths 4 beds |
show details | |

|
#33
Tremayne Pl Apt 309
Mc Lean, VA 22102
|
1,180 sq. feet
|
2 baths 2 beds |
show details | |

|
#34
Southern Ave SE
Washington, DC 20019
|
1,024 sq. feet
|
1 baths 3 beds |
show details | |

|
#35
Henderson Chapel Ln
Bowie, MD 20720
|
4,002 sq. feet
|
3 baths 4 beds |
show details | |

|
#36
Rhode Island Ave NW Apt 202
Washington, DC 20005
|
604 sq. feet
|
1 baths 1 beds |
show details | |

|
#37
Wahler Pl SE
Washington, DC 20032
|
1,364 sq. feet
|
2 baths 3 beds |
show details | |

|
#38
26th St N
Arlington, VA 22207
|
3,310 sq. feet
|
4 baths 5 beds |
show details | |

|
#39
Elfin Ave
Capitol Heights, MD 20743
|
1,146 sq. feet
|
2 baths 3 beds |
show details | |

|
#40
Burkes Promise Dr
Bowie, MD 20720
|
2,984 sq. feet
|
4 baths 5 beds |
show details |
| Photo | Address | Area | Beds / Baths | Price | Details |
|---|---|---|---|---|---|

|
#41
16th St NW Apt 305
Washington, DC 20009
|
1,158 sq. feet
|
1 baths 2 beds |
show details | |

|
#42
Byers St
Capitol Heights, MD 20743
|
2,238 sq. feet
|
2 baths 2 beds |
show details | |

|
#43
Halley Pl SE Apt 204
Washington, DC 20032
|
934 sq. feet
|
1 baths 3 beds |
show details | |

|
#44
Peacock Dr
Hyattsville, MD 20785
|
1,452 sq. feet
|
2 baths 3 beds |
show details | |

|
#45
Myrtle Ave
Bowie, MD 20720
|
3,436 sq. feet
|
2 baths 4 beds |
show details | |

|
#46
Wedgedale Dr
Sterling, VA 20164
|
1,540 sq. feet
|
2 baths 4 beds |
show details | |

|
#47
Lee Landing Dr
Falls Church, VA 22043
|
900 sq. feet
|
1 baths 2 beds |
show details | |

|
#48
Rugged Ln
Capitol Heights, MD 20743
|
- sq. feet
|
3 baths 4 beds |
show details | |

|
#49
Barnaby St SE
Washington, DC 20032
|
1,664 sq. feet
|
2 baths 3 beds |
show details | |

|
Check over 1 million property listings on Foreclosure.com!
|
browse all offers | |||

 | Overall scene in the Maryland/NOVA suburbs - what's it like? (8 replies) |
| Is Wheaton going downhill??? (81 replies) |
| Specialty Beer Stores? (10 replies) |
| For those interested in demographics or searching for "diverse" communities (6 replies) |
| Potential Move to DS area (2 replies) |
Household type by relationship:
Households: 962,877- In family households: 818,609 (170,949 male householders, 73,949 female householders)
190,571 spouses, 287,257 children (273,230 natural, 6,853 adopted, 7,174 stepchildren), 12,668 grandchildren, 13,356 brothers or sisters, 12,424 parents, foster children, 20,293 other relatives, 29,004 non-relatives
- In nonfamily households: 144,268 (45,103 male householders (33,162 living alone)), 67,085 female householders (56,102 living alone)), 32,080 nonrelatives
- In group quarters: 8,900 (5,864 institutionalized population)
167,990 married couples with children.
37,951 single-parent households (7,214 men, 30,737 women).
52.2% of residents of Wheaton-Glenmont speak English at home.
25.8% of residents speak Spanish at home (40% speak English very well, 28% speak English well, 24% speak English not well, 7% don't speak English at all).
9.4% of residents speak other Indo-European language at home (62% speak English very well, 22% speak English well, 13% speak English not well, 3% don't speak English at all).
9.6% of residents speak Asian or Pacific Island language at home (41% speak English very well, 33% speak English well, 23% speak English not well, 4% don't speak English at all).
3.0% of residents speak other language at home (65% speak English very well, 27% speak English well, 7% speak English not well, 1% don't speak English at all).
Foreign born population: 35,166 (50.6%)
(54.2% of them are naturalized citizens)
| Here: | 6.6 |
| State: | 7.3 |
| Here: | 5.2 |
| State: | 4.2 |
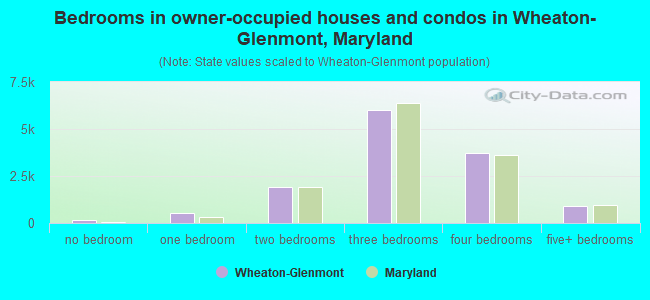
- Bedrooms in owner-occupied houses and condos in Wheaton-Glenmont, Maryland
- 147no bedroom
- 5461 bedroom
- 1,8982 bedrooms
- 6,0033 bedrooms
- 3,7394 bedrooms
- 9025+ bedrooms
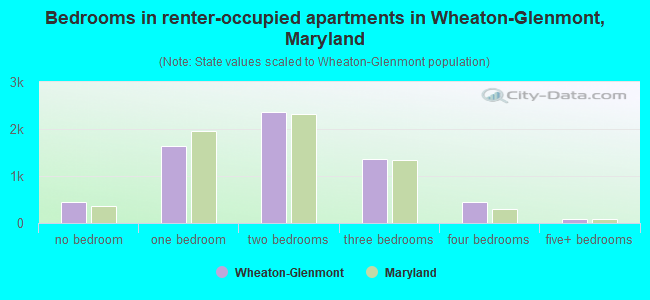
- Bedrooms in renter-occupied apartments in Wheaton-Glenmont, Maryland
- 456no bedroom
- 1,6331 bedroom
- 2,3572 bedrooms
- 1,3703 bedrooms
- 4384 bedrooms
- 935+ bedrooms
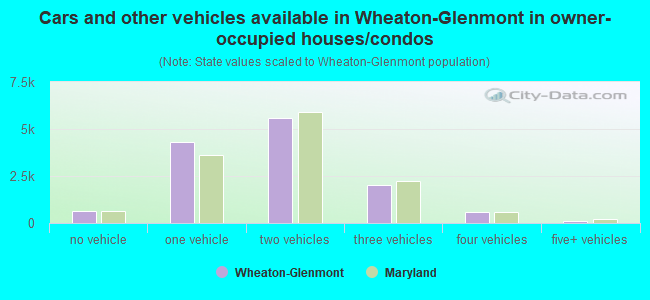
- Cars and other vehicles available in Wheaton-Glenmont in owner-occupied houses/condos
- 661no vehicle
- 4,2961 vehicle
- 5,5962 vehicles
- 2,0123 vehicles
- 5744 vehicles
- 965+ vehicles
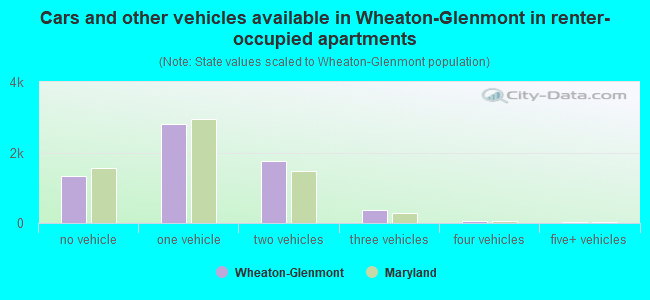
- Cars and other vehicles available in Wheaton-Glenmont in renter-occupied apartments
- 1,328no vehicle
- 2,8031 vehicle
- 1,7582 vehicles
- 3733 vehicles
- 564 vehicles
- 295+ vehicles
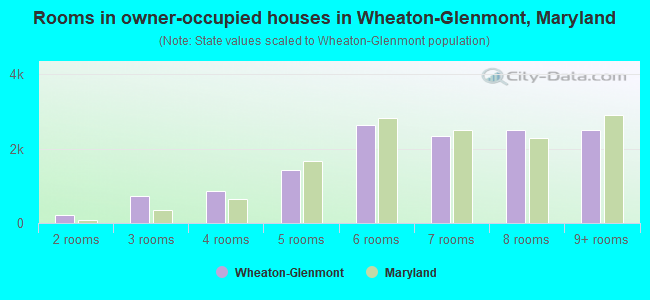
- Rooms in owner-occupied houses in Wheaton-Glenmont, Maryland
- 221 room
- 2022 rooms
- 7333 rooms
- 8624 rooms
- 1,4365 rooms
- 2,6426 rooms
- 2,3377 rooms
- 2,4918 rooms
- 2,5109+ rooms
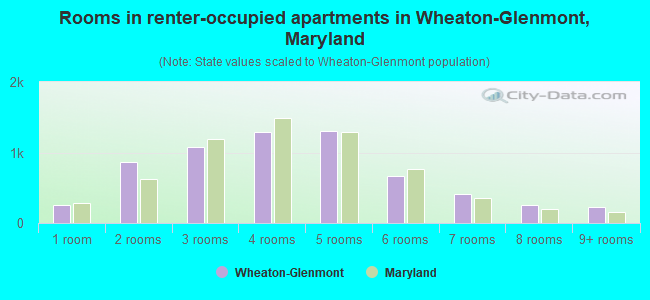
- Rooms in renter-occupied apartments in Wheaton-Glenmont, Maryland
- 2591 room
- 8632 rooms
- 1,0743 rooms
- 1,2904 rooms
- 1,3005 rooms
- 6656 rooms
- 4117 rooms
- 2568 rooms
- 2299+ rooms
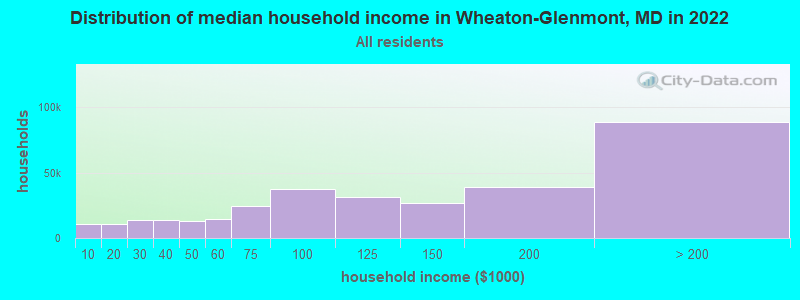
Wheaton-Glenmont, MD household income distribution

- 10,698Less than $10,000
- 11,088$10,000 to $19,999
- 13,646$20,000 to $29,999
- 13,605$30,000 to $39,999
- 13,243$40,000 to $49,999
- 14,685$50,000 to $59,999
- 24,177$60,000 to $74,999
- 37,382$75,000 to $99,999
- 31,224$100,000 to $124,999
- 26,659$125,000 to $149,999
- 38,646$150,000 to $199,999
- 88,761$200,000 or more
Percentage of workers working in this county: 69.5%
Number of people working at home: 9,649 (28.1% of all workers)
Travel time to work (commute)
- Less than 5 minutes: 285
- 5 to 9 minutes: 838
- 10 to 14 minutes: 1,715
- 15 to 19 minutes: 3,053
- 20 to 24 minutes: 3,454
- 25 to 29 minutes: 1,682
- 30 to 34 minutes: 5,374
- 35 to 39 minutes: 1,216
- 40 to 44 minutes: 1,784
- 45 to 59 minutes: 4,603
- 60 to 89 minutes: 2,667
- 90 or more minutes: 883
Means of transportation to work:
- Drove a car alone: 17,963 (63.4%)
- Carpooled: 3,845 (13.6%)
- Bus or trolley bus: 2,263 (8.0%)
- Streetcar or trolley car: 4 (0.0%)
- Subway or elevated: 2,578 (9.1%)
- Railroad: 86 (0.3%)
- Ferryboat: 8 (0.0%)
- Taxi: 96 (0.3%)
- Bicycle: 74 (0.3%)
- Walked: 490 (1.7%)
- Other means: 147 (0.5%)
- Worked at home: 769 (2.7%)
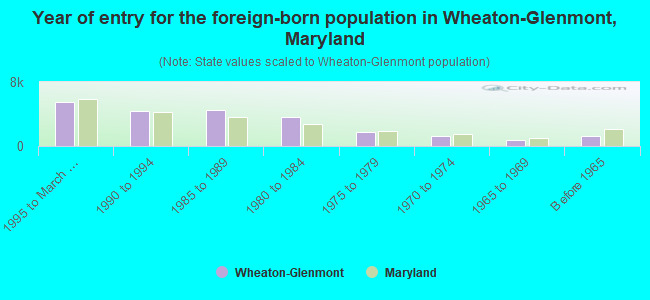
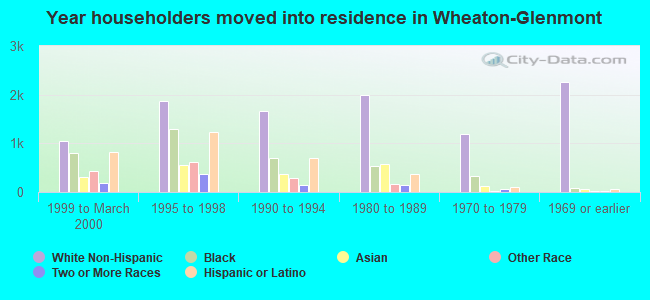
- Year of entry for the foreign-born population in Wheaton-Glenmont, Maryland
- 5,4491995 to March 2000
- 4,3371990 to 1994
- 4,4991985 to 1989
- 3,6601980 to 1984
- 1,7431975 to 1979
- 1,2081970 to 1974
- 7291965 to 1969
- 1,230Before 1965
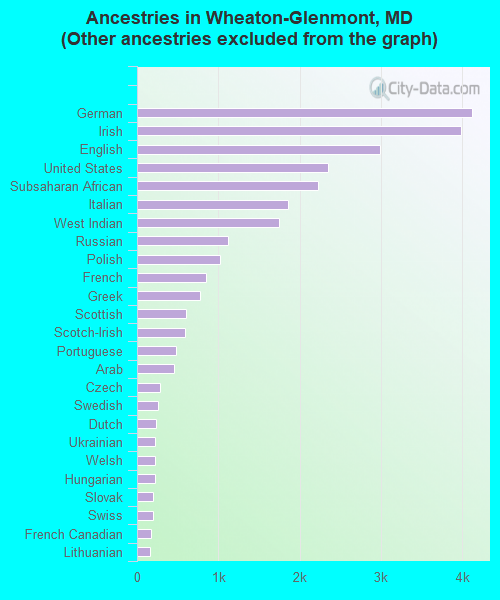
First ancestries reported:
- Other: 30,809 (52.9%)
- German: 4,122 (7.1%)
- Irish: 3,989 (6.8%)
- English: 2,994 (5.1%)
- United States: 2,348 (4.0%)
- Subsaharan African: 2,223 (3.8%)
- Italian: 1,861 (3.2%)
- West Indian: 1,747 (3.0%)
- Russian: 1,125 (1.9%)
- Polish: 1,023 (1.8%)
- French: 843 (1.4%)
- Greek: 778 (1.3%)
- Scottish: 599 (1.0%)
- Scotch-Irish: 587 (1.0%)
- Portuguese: 476 (0.8%)
- Arab: 456 (0.8%)
- Czech: 279 (0.5%)
- Swedish: 257 (0.4%)
- Dutch: 232 (0.4%)
- Ukrainian: 226 (0.4%)
- Welsh: 224 (0.4%)
- Hungarian: 216 (0.4%)
- Slovak: 200 (0.3%)
- Swiss: 193 (0.3%)
- French Canadian: 174 (0.3%)
- Lithuanian: 154 (0.3%)
- Danish: 73 (0.1%)
- Norwegian: 73 (0.1%)
Most common places of birth for foreign-born residents (%):
| Wheaton-Glenmont: | 22.0% (5,030) |
| Maryland: | 8.1% (41,818) |
| Wheaton-Glenmont: | 5.4% (1,237) |
| Maryland: | 2.9% (14,807) |
| Wheaton-Glenmont: | 4.5% (1,034) |
| Maryland: | 2.0% (10,309) |
| Wheaton-Glenmont: | 4.5% (1,021) |
| Maryland: | 4.4% (22,741) |
| Wheaton-Glenmont: | 3.4% (767) |
| Maryland: | 3.7% (18,988) |
| Wheaton-Glenmont: | 3.2% (729) |
| Maryland: | 1.6% (8,407) |
| Wheaton-Glenmont: | 3.0% (681) |
| Maryland: | 6.0% (31,249) |
| Wheaton-Glenmont: | 2.9% (652) |
| Maryland: | 1.1% (5,630) |
| Wheaton-Glenmont: | 2.8% (640) |
| Maryland: | 3.7% (19,287) |
| Wheaton-Glenmont: | 2.8% (632) |
| Maryland: | 4.1% (21,007) |
| Wheaton-Glenmont: | 2.6% (595) |
| Maryland: | 6.2% (32,276) |
| Wheaton-Glenmont: | 2.4% (541) |
| Maryland: | 1.2% (6,295) |
| Wheaton-Glenmont: | 2.2% (500) |
| Maryland: | 0.8% (4,250) |
| Wheaton-Glenmont: | 1.6% (363) |
| Maryland: | 1.1% (5,594) |
| Wheaton-Glenmont: | 1.5% (351) |
| Maryland: | 1.2% (6,190) |
| Wheaton-Glenmont: | 1.5% (346) |
| Maryland: | 0.5% (2,771) |
Place of birth for U.S.-born residents:
- This state: 12,191
- Other state: 21,984
- Northeast: 5,867
- Midwest: 2,527
- South: 12,265
- West: 1,325
61% of Wheaton-Glenmont residents lived in the same house 5 years ago.
Out of people who lived in different houses, 62% lived in this county.
Out of people who lived in different counties, 31% lived in Maryland.
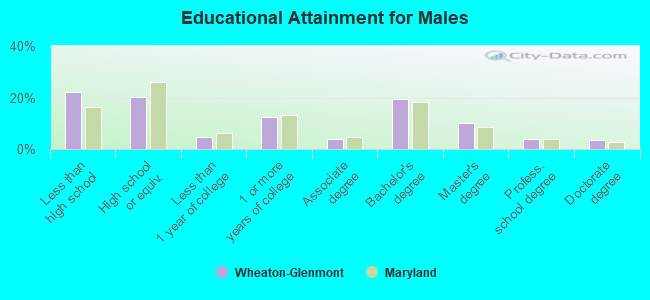
Education attainment for males 25 years and older:
- No schooling: 400
- Nursery to 4th grade: 366
- 5th and 6th grade: 620
- 7th and 8th grade: 578
- 9th grade: 556
- 10th grade: 326
- 11th grade: 346
- 12th grade, no diploma: 839
- High school graduate (or equivalency): 3,683
- Less than 1 year of college: 835
- Some college more than 1 year, no degree: 2,226
- Associate degree: 732
- Bachelor's degree: 3,513
- Master's degree: 1,838
- Professional school degree: 698
- Doctorate degree: 607
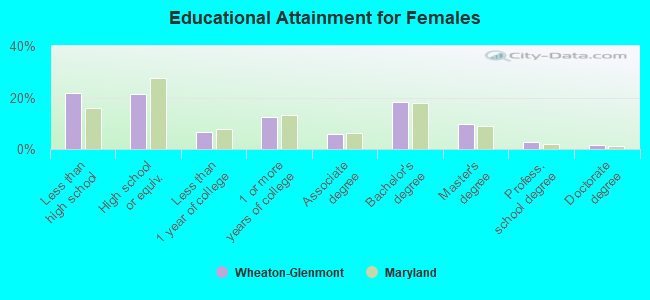
Education attainment for females 25 years and older:
- No schooling: 558
- Nursery to 4th grade: 393
- 5th and 6th grade: 710
- 7th and 8th grade: 603
- 9th grade: 531
- 10th grade: 335
- 11th grade: 319
- 12th grade, no diploma: 987
- High school graduate (or equivalency): 4,340
- Less than 1 year of college: 1,386
- Some college more than 1 year, no degree: 2,577
- Associate degree: 1,190
- Bachelor's degree: 3,708
- Master's degree: 1,977
- Professional school degree: 551
- Doctorate degree: 317
Housing units in structures:
- One, detached: 12,181
- One, attached: 2,800
- Two: 88
- 3 or 4: 254
- 5 to 9: 1,420
- 10 to 19: 1,203
- 20 to 49: 377
- 50 or more: 1,803
- Mobile homes: 8
Median worth of mobile homes: $630,236
Housing units lacking complete kitchen facilities: 0.4%
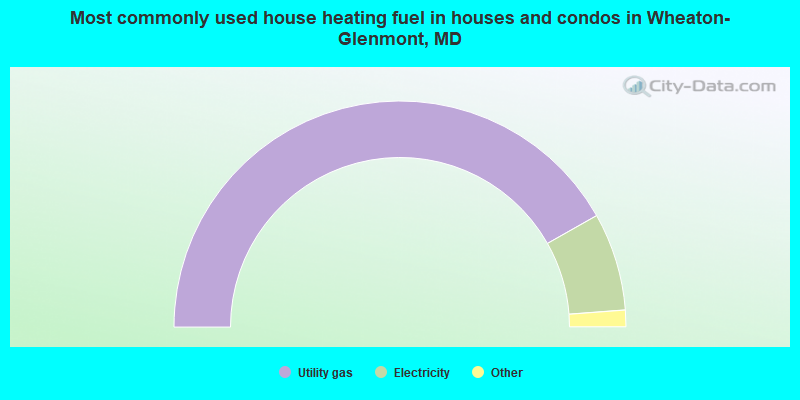
- 83.6%Utility gas
- 14.0%Electricity
- 1.2%Fuel oil, kerosene, etc.
- 0.7%Bottled, tank, or LP gas
- 0.2%Other fuel
- 0.1%Wood
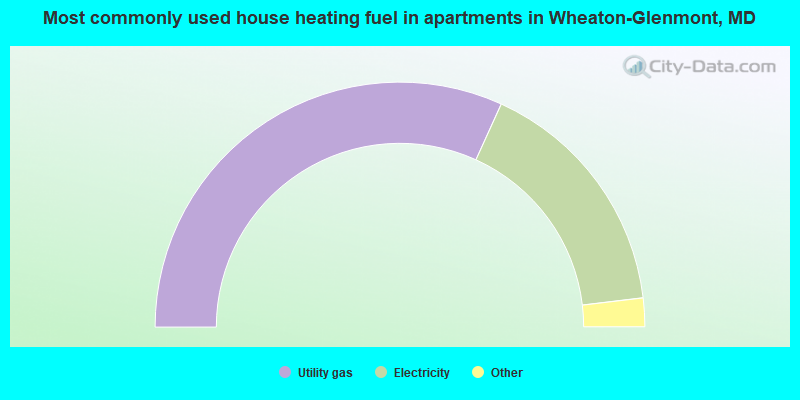
- 63.6%Utility gas
- 32.6%Electricity
- 2.6%Fuel oil, kerosene, etc.
- 0.8%Bottled, tank, or LP gas
- 0.3%No fuel used
- 0.1%Other fuel
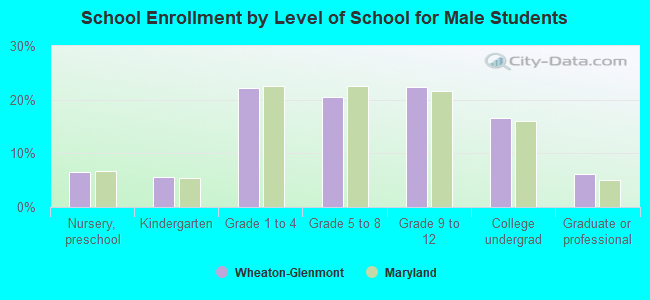
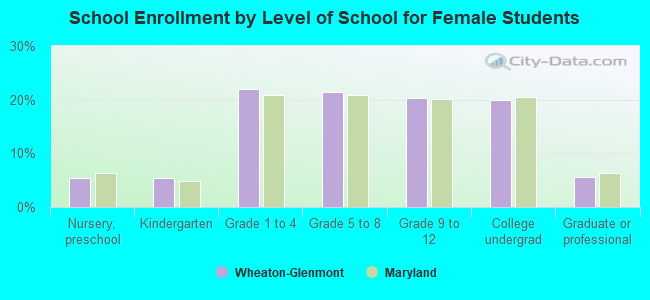
Private vs. public school enrollment:
| Here: | 15.4% |
| Maryland: | 14.8% |
| Here: | 13.2% |
| Maryland: | 13.3% |
| Here: | 19.2% |
| Maryland: | 21.7% |