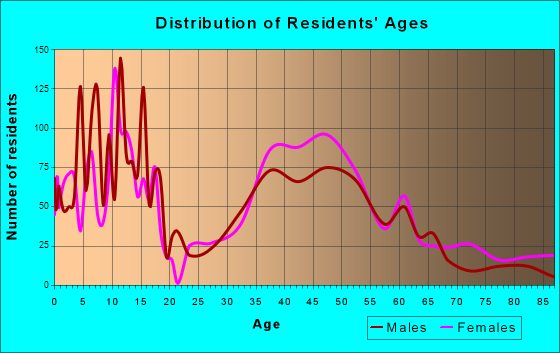
Zionsville, IN (Indiana) Houses and Residents
| Zionsville: | $554,248 |
| Indiana: | $208,700 |
Total population: 25,734 (Urban population: 8,370, Rural population: 109 (10 farm, 99 nonfarm))
Houses: 12,191 (11,841 occupied: 10,216 owner occupied, 1,805 renter occupied)
| % of renters here: | 15% |
| State: | 29% |
Housing density: 2,102 houses/condos per square mile
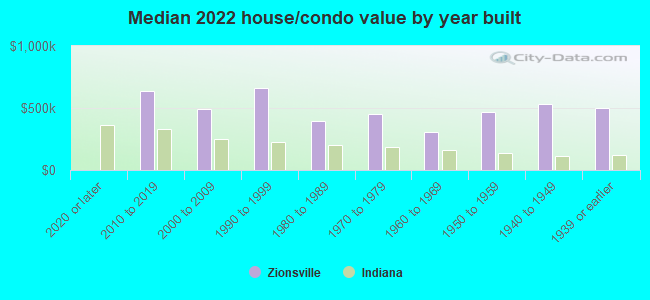
Median price asked for vacant for-sale houses and condos in 2022: $230,707.
Median contract rent in 2022: $1,299 (lower quartile is $984, upper quartile is over $2,000)
Median rent asked for vacant for-rent units in 2022: $704
Median gross rent in Zionsville, IN in 2022: $1,511
Housing units in Zionsville with a mortgage: 7,092 (1,098 second mortgage, 0 home equity loan, 992 both second mortgage and home equity loan)
Houses without a mortgage: 240
Median household income for houses/condos with a mortgage: $171,994
Median household income for apartments without a mortgage: $139,842
Median monthly housing costs: $1,831
Compare current foreclosures near Zionsville, IN:
| Photo | Address | Area | Beds / Baths | Price | Details |
|---|---|---|---|---|---|

|
#1
Barth Dr
Zionsville, IN 46077
|
1,676 sq. feet
|
2 baths 3 beds |
show details | |

|
#2
W 96th St
Zionsville, IN 46077
|
1,584 sq. feet
|
1 baths 3 beds |
show details | |

|
#3
Regents Park Dr
Zionsville, IN 46077
|
3,611 sq. feet
|
3 baths 3 beds |
show details | |

|
#4
Hunters Rdg N
Zionsville, IN 46077
|
2,984 sq. feet
|
2 baths 4 beds |
show details | |

|
#5
Chase Oak Ct
Zionsville, IN 46077
|
5,513 sq. feet
|
5 baths 4 beds |
show details | |

|
#6
Pickwick Ct
Zionsville, IN 46077
|
1,236 sq. feet
|
2 baths 3 beds |
show details | |

|
#7
Village Walk Dr
Zionsville, IN 46077
|
2,562 sq. feet
|
3 baths 3 beds |
show details | |

|
#8
Deandra Dr
Zionsville, IN 46077
|
- sq. feet
|
- baths - beds |
show details | |

|
#9
W Old 106th St
Zionsville, IN 46077
|
- sq. feet
|
- baths - beds |
show details | |

|
#10
Sugar Maple Dr
Zionsville, IN 46077
|
- sq. feet
|
- baths - beds |
show details |
| Photo | Address | Area | Beds / Baths | Price | Details |
|---|---|---|---|---|---|

|
#11
Saylor Dr
Zionsville, IN 46077
|
- sq. feet
|
- baths - beds |
show details | |

|
#12
Williams Glen Blvd
Zionsville, IN 46077
|
- sq. feet
|
- baths - beds |
show details | |

|
#13
Westhaven Cir Apt 306
Zionsville, IN 46077
|
- sq. feet
|
- baths - beds |
show details | |

|
#14
W 96th St Ste C
Zionsville, IN 46077
|
- sq. feet
|
- baths - beds |
show details | |

|
#15
W 13th St
Indianapolis, IN 46214
|
1,300 sq. feet
|
1 baths 3 beds |
$112,320
|
show details |

|
#16
Ruth Dr
Indianapolis, IN 46240
|
848 sq. feet
|
1 baths 2 beds |
$245,000
|
show details |

|
#17
Wallace Ave
Indianapolis, IN 46201
|
801 sq. feet
|
1 baths 2 beds |
$175,000
|
show details |

|
#18
Wicklow Way
Brownsburg, IN 46112
|
3,158 sq. feet
|
2 baths 4 beds |
$479,900
|
show details |

|
#19
Squire Ln
Pittsboro, IN 46167
|
3,148 sq. feet
|
2 baths 4 beds |
show details | |

|
#20
Watercrest Way
Indianapolis, IN 46278
|
1,648 sq. feet
|
2 baths 3 beds |
show details |
| Photo | Address | Area | Beds / Baths | Price | Details |
|---|---|---|---|---|---|

|
#21
Adams St
Indianapolis, IN 46218
|
- sq. feet
|
1 baths 3 beds |
show details | |

|
#22
N Gray St
Indianapolis, IN 46201
|
1,309 sq. feet
|
2 baths 3 beds |
show details | |

|
#23
E 156th St
Carmel, IN 46032
|
3,240 sq. feet
|
3 baths 4 beds |
show details | |

|
#24
Lexington Ave
Indianapolis, IN 46203
|
1,736 sq. feet
|
4 baths 4 beds |
show details | |

|
#25
Wallace Ave
Indianapolis, IN 46201
|
1,118 sq. feet
|
1 baths 3 beds |
show details | |

|
#26
E 33rd St
Indianapolis, IN 46226
|
1,188 sq. feet
|
1 baths 3 beds |
show details | |

|
#27
Melbourne Rd
Indianapolis, IN 46228
|
3,564 sq. feet
|
1 baths 4 beds |
show details | |

|
#28
W Troy Ave
Indianapolis, IN 46241
|
1,176 sq. feet
|
2 baths 2 beds |
show details | |

|
#29
N Talbott St
Indianapolis, IN 46205
|
1,140 sq. feet
|
1 baths 2 beds |
show details | |

|
#30
N Oriental St
Indianapolis, IN 46202
|
1,560 sq. feet
|
2 baths 2 beds |
show details |
| Photo | Address | Area | Beds / Baths | Price | Details |
|---|---|---|---|---|---|

|
#31
W Black Wolf Run Dr
Carmel, IN 46033
|
3,340 sq. feet
|
4 baths 5 beds |
show details | |

|
#32
Terrace Ave
Indianapolis, IN 46203
|
1,908 sq. feet
|
2 baths 4 beds |
show details | |

|
#33
N Parker Ave
Indianapolis, IN 46201
|
1,114 sq. feet
|
1 baths 2 beds |
show details | |

|
#34
Walnut Meadow Ct
Indianapolis, IN 46234
|
1,387 sq. feet
|
1 baths 3 beds |
show details | |

|
#35
Lippincott Way
Indianapolis, IN 46268
|
1,707 sq. feet
|
1 baths 4 beds |
show details | |

|
#36
King Ave
Indianapolis, IN 46222
|
1,248 sq. feet
|
1 baths 4 beds |
show details | |

|
#37
Hillside Ave
Indianapolis, IN 46220
|
1,060 sq. feet
|
2 baths 3 beds |
show details | |

|
#38
Hovey St
Indianapolis, IN 46218
|
1,425 sq. feet
|
1 baths 3 beds |
show details | |

|
#39
N Oakland Ave
Indianapolis, IN 46201
|
1,704 sq. feet
|
1 baths 3 beds |
show details | |

|
#40
W Southern Ave
Indianapolis, IN 46241
|
1,272 sq. feet
|
1 baths 3 beds |
show details |
| Photo | Address | Area | Beds / Baths | Price | Details |
|---|---|---|---|---|---|

|
#41
E Hampton Dr
Indianapolis, IN 46226
|
1,296 sq. feet
|
1 baths 3 beds |
show details | |

|
#42
N Arsenal Ave
Indianapolis, IN 46218
|
1,330 sq. feet
|
- baths 3 beds |
show details | |

|
#43
Aspen Dr
Fishers, IN 46037
|
1,872 sq. feet
|
3 baths 3 beds |
show details | |

|
#44
Bromley Pl
Indianapolis, IN 46219
|
2,424 sq. feet
|
2 baths 3 beds |
show details | |

|
#45
1st St NE
Carmel, IN 46032
|
1,172 sq. feet
|
1 baths 3 beds |
show details | |

|
#46
S Mcclure St
Indianapolis, IN 46241
|
968 sq. feet
|
1 baths 2 beds |
show details | |

|
#47
S Biltmore Ave
Indianapolis, IN 46241
|
2,904 sq. feet
|
3 baths 4 beds |
show details | |

|
#48
Fullerton Dr
Indianapolis, IN 46214
|
1,904 sq. feet
|
2 baths 4 beds |
show details | |

|
#49
Maurice Dr
Indianapolis, IN 46234
|
1,414 sq. feet
|
1 baths 3 beds |
show details | |

|
Check over 1 million property listings on Foreclosure.com!
|
browse all offers | |||

Latest news about housing in Zionsville, IN collected exclusively by city-data.com from local newspapers, TV, and radio stations

 | Senior housing near Zionsville (1 reply) |
| Is my impression of Indianapolis accurate? (167 replies) |
| Zionsville Homes (18 replies) |
| Housing prices by suburb? (14 replies) |
| Burbs within 30-min of the city, new home? (4 replies) |
| Zionsville Apartments Help (5 replies) |
Median year apartment built: 2003
Household type by relationship:
Households: 32,099- Male householders: 6,495 (796 living alone), Female householders: 5,238 (871 living alone)
8,826 spouses (8,703 opposite-sex spouses), 453 unmarried partners, (446 opposite-sex unmarried partners), 10,013 children (9,706 natural, 108 adopted, 198 stepchildren), 108 grandchildren, 79 brothers or sisters, 229 parents, 0 foster children, 236 other relatives, 294 non-relatives
- In group quarters: 123
Size of family households: 4,099 2-persons, 1,961 3-persons, 1,864 4-persons, 1,300 5-persons, 202 6-persons, 42 7-or-more-persons.
Size of nonfamily households: 2,001 1-person, 291 2-persons, 35 3-persons, 18 4-persons.
7,382 married couples with children.
700 single-parent households (221 men, 479 women).
92.3% of residents of Zionsville speak English at home.
2.5% of residents speak Spanish at home (87% speak English very well, 4% speak English well, 9% speak English not well, 1% don't speak English at all).
1.2% of residents speak other Indo-European language at home (68% speak English very well, 30% speak English well, 2% speak English not well).
2.9% of residents speak Asian or Pacific Island language at home (67% speak English very well, 20% speak English well, 10% speak English not well, 3% don't speak English at all).
0.3% of residents speak other language at home (100% speak English well).
Foreign born population: 1,704 (5.3%)
(83.6% of them are naturalized citizens)
| Here: | 10.1 |
| State: | 6.6 |
| Here: | 4.2 |
| State: | 4.3 |
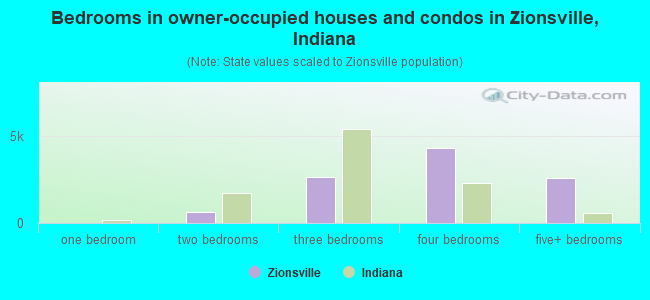
- Bedrooms in owner-occupied houses and condos in Zionsville, Indiana
- 0no bedroom
- 01 bedroom
- 6392 bedrooms
- 2,6363 bedrooms
- 4,3414 bedrooms
- 2,6015+ bedrooms
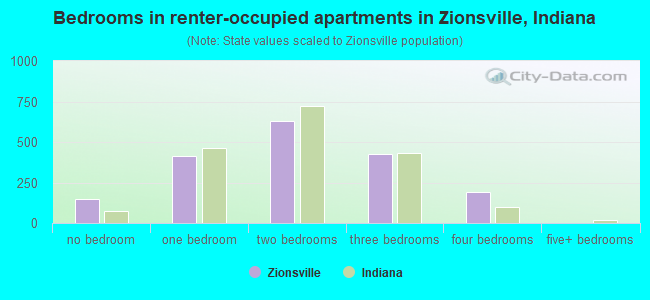
- Bedrooms in renter-occupied apartments in Zionsville, Indiana
- 147no bedroom
- 4131 bedroom
- 6292 bedrooms
- 4283 bedrooms
- 1894 bedrooms
- 05+ bedrooms
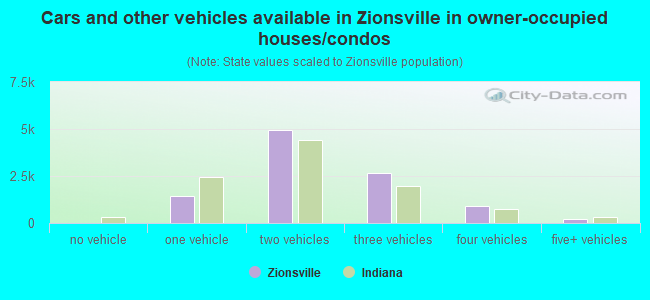
- Cars and other vehicles available in Zionsville in owner-occupied houses/condos
- 15no vehicle
- 1,4491 vehicle
- 4,9672 vehicles
- 2,6543 vehicles
- 8994 vehicles
- 2335+ vehicles
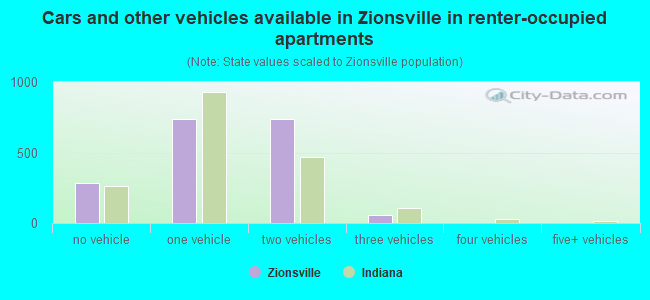
- Cars and other vehicles available in Zionsville in renter-occupied apartments
- 281no vehicle
- 7351 vehicle
- 7352 vehicles
- 553 vehicles
- 04 vehicles
- 05+ vehicles
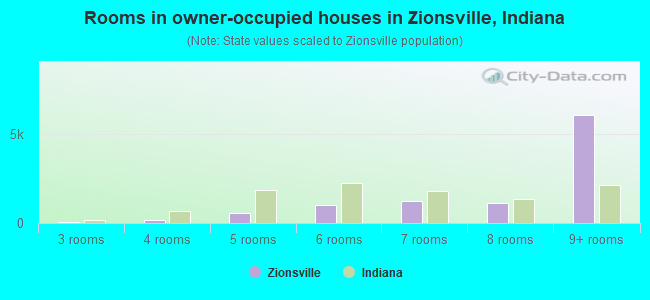
- Rooms in owner-occupied houses in Zionsville, Indiana
- 01 room
- 02 rooms
- 423 rooms
- 1854 rooms
- 5715 rooms
- 9986 rooms
- 1,2417 rooms
- 1,1158 rooms
- 6,0669+ rooms
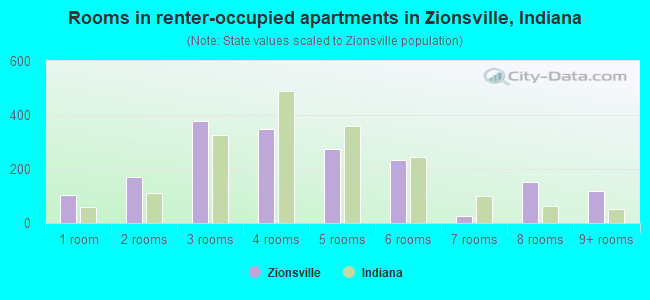
- Rooms in renter-occupied apartments in Zionsville, Indiana
- 1051 room
- 1712 rooms
- 3783 rooms
- 3494 rooms
- 2755 rooms
- 2356 rooms
- 267 rooms
- 1518 rooms
- 1179+ rooms
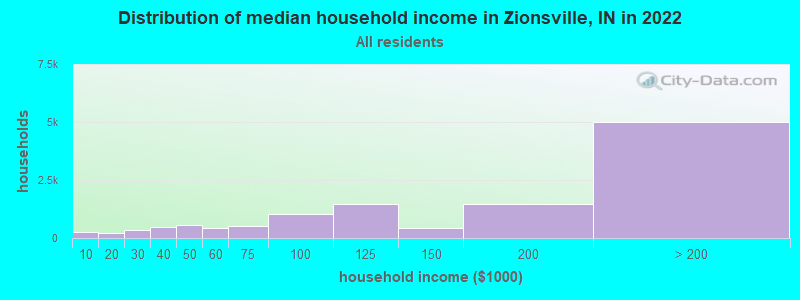
Zionsville, IN household income distribution

- 250Less than $10,000
- 219$10,000 to $19,999
- 334$20,000 to $29,999
- 460$30,000 to $39,999
- 551$40,000 to $49,999
- 449$50,000 to $59,999
- 502$60,000 to $74,999
- 1,044$75,000 to $99,999
- 1,470$100,000 to $124,999
- 422$125,000 to $149,999
- 1,483$150,000 to $199,999
- 5,013$200,000 or more
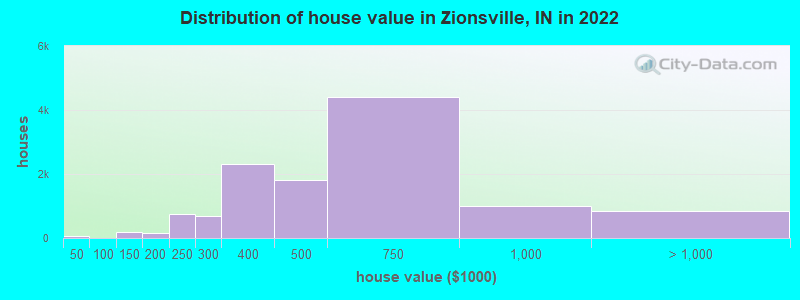
Home value of owner - occupied houses in 2022 in Zionsville, IN
-
- 17Less than $10,000
- 17$10,000 to $14,999
- 22$25,000 to $29,999
- 12$40,000 to $49,999
- 166$100,000 to $124,999
- 14$125,000 to $149,999
- 137$150,000 to $174,999
- 24$175,000 to $199,999
- 745$200,000 to $249,999
- 684$250,000 to $299,999
- 2,318$300,000 to $399,999
- 1,817$400,000 to $499,999
- 4,418$500,000 to $749,999
- 1,010$750,000 to $999,999
- 531$1,000,000 to $1,499,999
- 159$1,500,000 to $1,999,999
- 168$2,000,000 or more
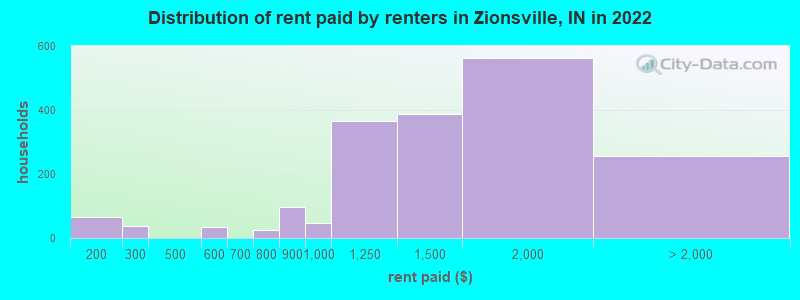
Rent paid by renters in 2022 in Zionsville, IN
-
- 66$150 to $199
- 4$200 to $249
- 31$250 to $299
- 34$500 to $549
- 23$750 to $799
- 96$800 to $899
- 47$900 to $999
- 366$1,000 to $1,249
- 385$1,250 to $1,499
- 561$1,500 to $1,999
- 216$2,000 to $2,499
- 16$3,000 to $3,499
- 13$3,500 or more
- 9No cash rent
Percentage of workers working in this county: 42.8%
Number of people working at home: 4,682 (30.6% of all workers)
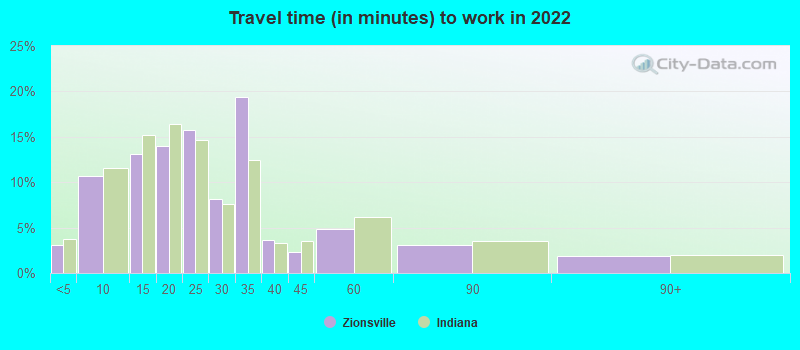
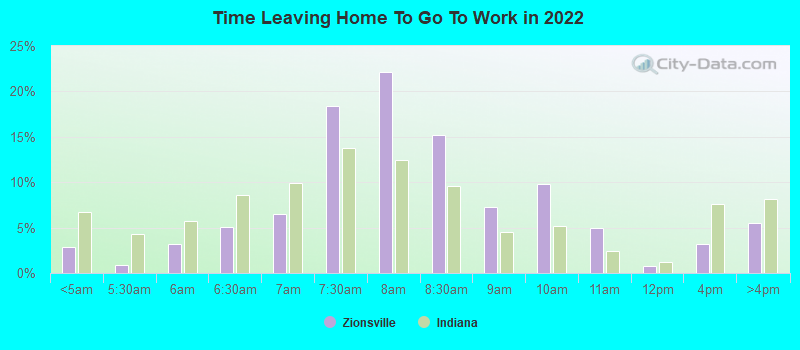
Travel time to work (commute)
- Less than 5 minutes: 434
- 5 to 9 minutes: 1,070
- 10 to 14 minutes: 1,292
- 15 to 19 minutes: 1,233
- 20 to 24 minutes: 1,899
- 25 to 29 minutes: 1,146
- 30 to 34 minutes: 2,283
- 35 to 39 minutes: 354
- 40 to 44 minutes: 614
- 45 to 59 minutes: 861
- 60 to 89 minutes: 549
- 90 or more minutes: 72
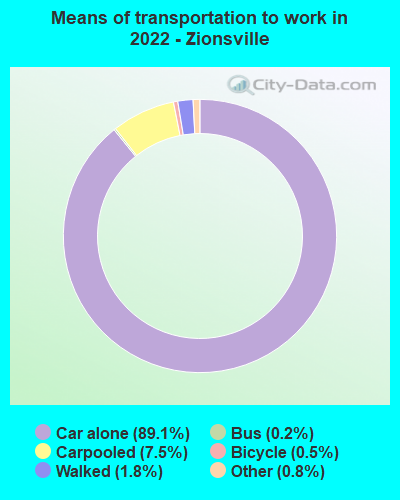
Means of transportation to work:
- Drove a car alone: 6,974 (59.1%)
- Carpooled: 648 (5.5%)
- Bus: 12 (0.1%)
- Taxi: 78 (0.7%)
- Bicycle: 49 (0.4%)
- Walked: 143 (1.2%)
- Worked at home: 4,682 (39.7%)
- Unemployment by race in 2022
- Unemployment rate for White non-Hispanic residents
- 3.6%Males
- 4.0%Females
- Unemployment rate for Black residents
- 3.4%Males
- Unemployment rate for American Indian and Alaska Native residents
- 18.4%Females
- Unemployment rate for Asian residents
- 12.4%Males
- 4.3%Females
- Unemployment rate for two or more race residents
- 17.5%Females
- Unemployment rate for Hispanic or Latino residents
- 8.0%Males
- 3.7%Females
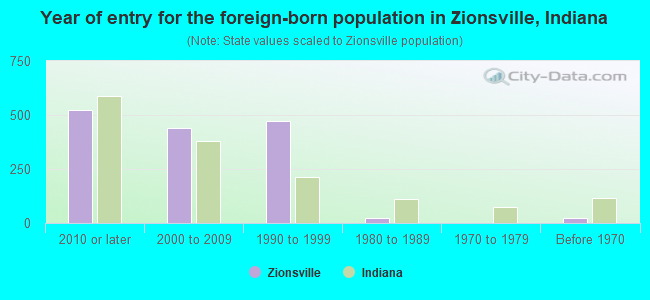
- Year of entry for the foreign-born population in Zionsville, Indiana
- 5212010 or later
- 4382000 to 2009
- 4731990 to 1999
- 221980 to 1989
- 01970 to 1979
- 24Before 1970
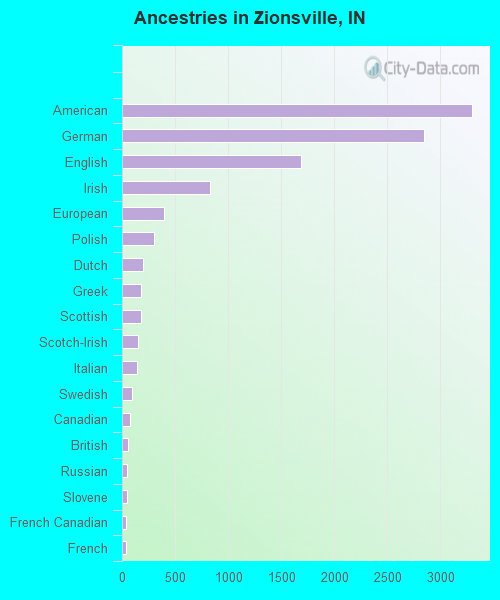
First ancestries reported:
- American: 3,293 (24.6%)
- German: 2,845 (21.3%)
- English: 1,690 (12.6%)
- Irish: 825 (6.2%)
- European: 392 (2.9%)
- Polish: 304 (2.3%)
- Dutch: 200 (1.5%)
- Greek: 180 (1.3%)
- Scottish: 176 (1.3%)
- Scotch-Irish: 151 (1.1%)
- Italian: 142 (1.1%)
- Swedish: 96 (0.7%)
- Canadian: 74 (0.6%)
- British: 57 (0.4%)
- Russian: 47 (0.4%)
- Slovene: 43 (0.3%)
- French Canadian: 41 (0.3%)
- French: 38 (0.3%)
- Finnish: 25 (0.2%)
- Nigerian: 25 (0.2%)
- Czechoslovakian: 24 (0.2%)
- Welsh: 24 (0.2%)
- Hungarian: 17 (0.1%)
- Norwegian: 16 (0.1%)
- Scandinavian: 15 (0.1%)
- Zimbabwean: 14 (0.1%)
- Northern European: 13 (0.10%)
- Iranian: 10 (0.07%)
- Swiss: 8 (0.06%)
- Slavic: 7 (0.05%)
- Belgian: 5 (0.04%)
Most common places of birth for foreign-born residents (%):
| Zionsville: | 19.7% (366) |
| Indiana: | 8.5% (32,127) |
| Zionsville: | 17.1% (317) |
| Indiana: | 5.3% (19,877) |
| Zionsville: | 10.9% (203) |
| Indiana: | 2.1% (7,834) |
| Zionsville: | 6.3% (116) |
| Indiana: | 27.0% (101,996) |
| Zionsville: | 6.0% (111) |
| Indiana: | 0.1% (327) |
| Zionsville: | 4.2% (78) |
| Indiana: | 0.8% (2,847) |
| Zionsville: | 3.9% (72) |
| Indiana: | 0.4% (1,388) |
| Zionsville: | 3.6% (66) |
| Indiana: | 1.8% (6,645) |
| Zionsville: | 2.4% (45) |
| Indiana: | 0.4% (1,540) |
| Zionsville: | 2.2% (40) |
| Indiana: | 4.3% (16,289) |
| Zionsville: | 2.0% (38) |
| Indiana: | 1.7% (6,439) |
| Zionsville: | 2.0% (37) |
| Indiana: | 0.4% (1,406) |
| Zionsville: | 1.7% (32) |
| Indiana: | 2.0% (7,653) |
| Zionsville: | 1.7% (31) |
| Indiana: | 0.3% (1,036) |
Place of birth for U.S.-born residents:
- This state: 17,902
- Other state: 12,637
- Northeast: 2,081
- Midwest: 6,388
- South: 2,950
- West: 1,150
85.9% of Zionsville residents lived in the same house 1 years ago.
Out of people who lived in different houses, 27.6% lived in this county.
Out of people who lived in different counties, 63.2% lived in Indiana.
| Zionsville: | 85.9% |
| State average: | 87.1% |
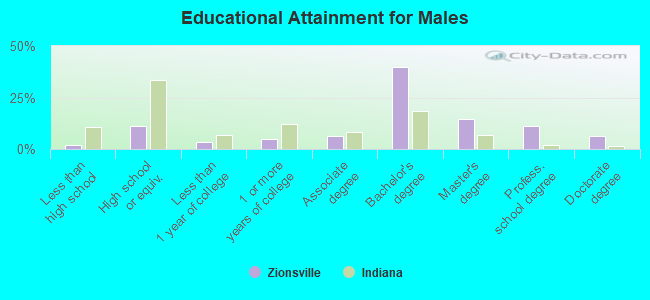
Education attainment for males 25 years and older:
- No schooling: 68
- Nursery to 4th grade: 0
- 5th and 6th grade: 13
- 7th and 8th grade: 110
- 9th grade: 5
- 10th grade: 11
- 11th grade: 0
- 12th grade, no diploma: 22
- High school graduate (or equivalency): 1,182
- Less than 1 year of college: 360
- Some college more than 1 year, no degree: 544
- Associate degree: 672
- Bachelor's degree: 4,297
- Master's degree: 1,580
- Professional school degree: 1,187
- Doctorate degree: 705
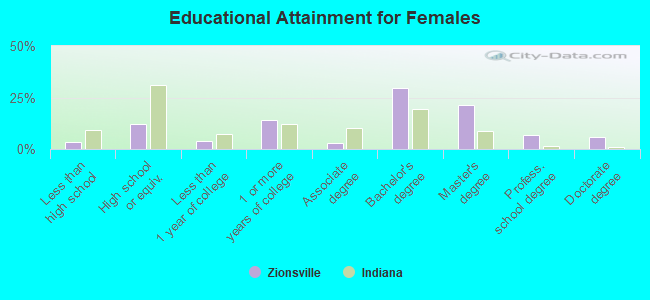
Education attainment for females 25 years and older:
- No schooling: 13
- Nursery to 4th grade: 0
- 5th and 6th grade: 0
- 7th and 8th grade: 0
- 9th grade: 0
- 10th grade: 62
- 11th grade: 91
- 12th grade, no diploma: 204
- High school graduate (or equivalency): 1,399
- Less than 1 year of college: 477
- Some college more than 1 year, no degree: 1,615
- Associate degree: 347
- Bachelor's degree: 3,483
- Master's degree: 2,488
- Professional school degree: 803
- Doctorate degree: 687
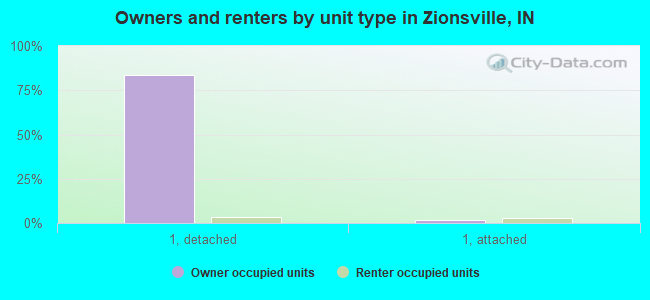
Housing units in structures:
- One, detached: 10,143
- One, attached: 648
- Two: 52
- 3 or 4: 112
- 5 to 9: 257
- 10 to 19: 382
- 20 to 49: 69
- 50 or more: 478
- Mobile homes: 47
Housing units lacking complete kitchen facilities in 2022: 0.6%
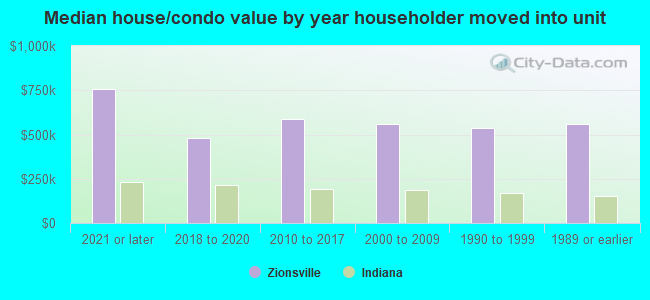
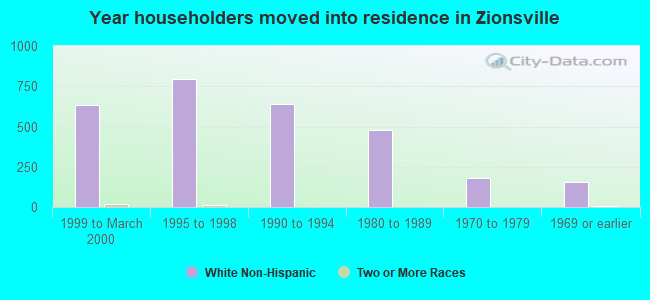
House/condo owner moved in on average 8 years ago
Renter moved in on average 3 years ago
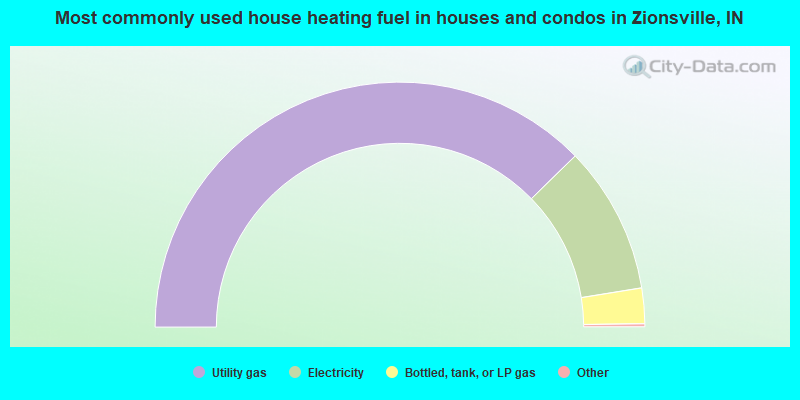
- 75.4%Utility gas
- 19.5%Electricity
- 4.7%Bottled, tank, or LP gas
- 0.3%Fuel oil, kerosene, etc.
- 0.1%Other fuel
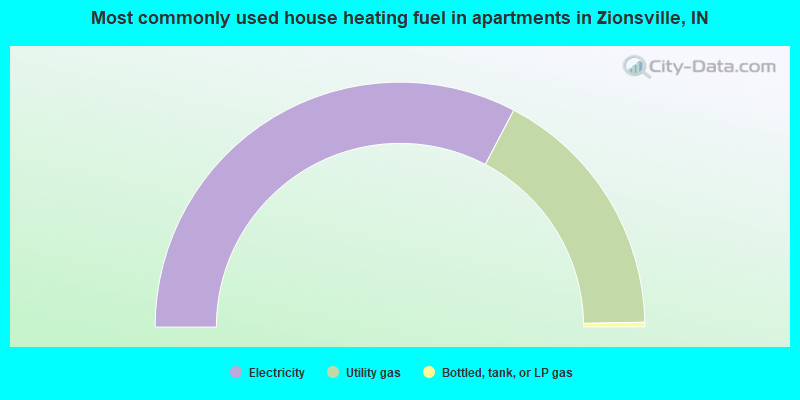
- 65.4%Electricity
- 34.0%Utility gas
- 0.6%Bottled, tank, or LP gas
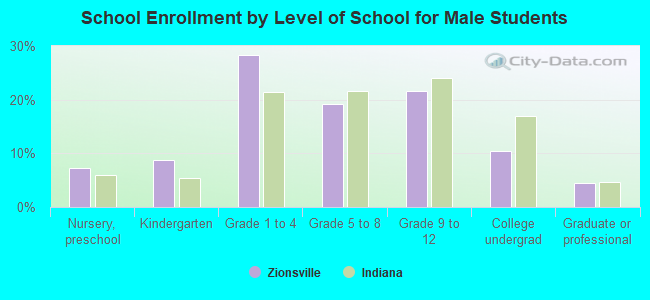
Private vs. public school enrollment:
| Here: | 4.0% |
| Indiana: | 14.9% |
| Here: | 8.1% |
| Indiana: | 11.4% |
| Here: | 37.5% |
| Indiana: | 22.3% |