Hicksville, New York Submit your own pictures of this place and show them to the world
OSM Map
General Map
Google Map
MSN Map
OSM Map
General Map
Google Map
MSN Map
OSM Map
General Map
Google Map
MSN Map
OSM Map
General Map
Google Map
MSN Map
Please wait while loading the map...
Population in 2010: 41,547. Population change since 2000: +0.7%Males: 21,535 Females: 20,012
March 2022 cost of living index in Hicksville: 152.5 (very high, U.S. average is 100) Percentage of residents living in poverty in 2022: 4.6%for White Non-Hispanic residents , 5.3% for Black residents , 9.1% for Hispanic or Latino residents , 8.4% for other race residents , 4.3% for two or more races residents )
Profiles of local businesses
Business Search - 14 Million verified businesses
Data:
Median household income ($)
Median household income (% change since 2000)
Household income diversity
Ratio of average income to average house value (%)
Ratio of average income to average rent
Median household income ($) - White
Median household income ($) - Black or African American
Median household income ($) - Asian
Median household income ($) - Hispanic or Latino
Median household income ($) - American Indian and Alaska Native
Median household income ($) - Multirace
Median household income ($) - Other Race
Median household income for houses/condos with a mortgage ($)
Median household income for apartments without a mortgage ($)
Races - White alone (%)
Races - White alone (% change since 2000)
Races - Black alone (%)
Races - Black alone (% change since 2000)
Races - American Indian alone (%)
Races - American Indian alone (% change since 2000)
Races - Asian alone (%)
Races - Asian alone (% change since 2000)
Races - Hispanic (%)
Races - Hispanic (% change since 2000)
Races - Native Hawaiian and Other Pacific Islander alone (%)
Races - Native Hawaiian and Other Pacific Islander alone (% change since 2000)
Races - Two or more races (%)
Races - Two or more races (% change since 2000)
Races - Other race alone (%)
Races - Other race alone (% change since 2000)
Racial diversity
Unemployment (%)
Unemployment (% change since 2000)
Unemployment (%) - White
Unemployment (%) - Black or African American
Unemployment (%) - Asian
Unemployment (%) - Hispanic or Latino
Unemployment (%) - American Indian and Alaska Native
Unemployment (%) - Multirace
Unemployment (%) - Other Race
Population density (people per square mile)
Population - Males (%)
Population - Females (%)
Population - Males (%) - White
Population - Males (%) - Black or African American
Population - Males (%) - Asian
Population - Males (%) - Hispanic or Latino
Population - Males (%) - American Indian and Alaska Native
Population - Males (%) - Multirace
Population - Males (%) - Other Race
Population - Females (%) - White
Population - Females (%) - Black or African American
Population - Females (%) - Asian
Population - Females (%) - Hispanic or Latino
Population - Females (%) - American Indian and Alaska Native
Population - Females (%) - Multirace
Population - Females (%) - Other Race
Coronavirus confirmed cases (May 21, 2024)
Deaths caused by coronavirus (May 21, 2024)
Coronavirus confirmed cases (per 100k population) (May 21, 2024)
Deaths caused by coronavirus (per 100k population) (May 21, 2024)
Daily increase in number of cases (May 21, 2024)
Weekly increase in number of cases (May 21, 2024)
Cases doubled (in days) (May 21, 2024)
Hospitalized patients (Apr 18, 2022)
Negative test results (Apr 18, 2022)
Total test results (Apr 18, 2022)
COVID Vaccine doses distributed (per 100k population) (Sep 19, 2023)
COVID Vaccine doses administered (per 100k population) (Sep 19, 2023)
COVID Vaccine doses distributed (Sep 19, 2023)
COVID Vaccine doses administered (Sep 19, 2023)
Likely homosexual households (%)
Likely homosexual households (% change since 2000)
Likely homosexual households - Lesbian couples (%)
Likely homosexual households - Lesbian couples (% change since 2000)
Likely homosexual households - Gay men (%)
Likely homosexual households - Gay men (% change since 2000)
Cost of living index
Median gross rent ($)
Median contract rent ($)
Median monthly housing costs ($)
Median house or condo value ($)
Median house or condo value ($ change since 2000)
Mean house or condo value by units in structure - 1, detached ($)
Mean house or condo value by units in structure - 1, attached ($)
Mean house or condo value by units in structure - 2 ($)
Mean house or condo value by units in structure by units in structure - 3 or 4 ($)
Mean house or condo value by units in structure - 5 or more ($)
Mean house or condo value by units in structure - Boat, RV, van, etc. ($)
Mean house or condo value by units in structure - Mobile home ($)
Median house or condo value ($) - White
Median house or condo value ($) - Black or African American
Median house or condo value ($) - Asian
Median house or condo value ($) - Hispanic or Latino
Median house or condo value ($) - American Indian and Alaska Native
Median house or condo value ($) - Multirace
Median house or condo value ($) - Other Race
Median resident age
Resident age diversity
Median resident age - Males
Median resident age - Females
Median resident age - White
Median resident age - Black or African American
Median resident age - Asian
Median resident age - Hispanic or Latino
Median resident age - American Indian and Alaska Native
Median resident age - Multirace
Median resident age - Other Race
Median resident age - Males - White
Median resident age - Males - Black or African American
Median resident age - Males - Asian
Median resident age - Males - Hispanic or Latino
Median resident age - Males - American Indian and Alaska Native
Median resident age - Males - Multirace
Median resident age - Males - Other Race
Median resident age - Females - White
Median resident age - Females - Black or African American
Median resident age - Females - Asian
Median resident age - Females - Hispanic or Latino
Median resident age - Females - American Indian and Alaska Native
Median resident age - Females - Multirace
Median resident age - Females - Other Race
Commute - mean travel time to work (minutes)
Travel time to work - Less than 5 minutes (%)
Travel time to work - Less than 5 minutes (% change since 2000)
Travel time to work - 5 to 9 minutes (%)
Travel time to work - 5 to 9 minutes (% change since 2000)
Travel time to work - 10 to 19 minutes (%)
Travel time to work - 10 to 19 minutes (% change since 2000)
Travel time to work - 20 to 29 minutes (%)
Travel time to work - 20 to 29 minutes (% change since 2000)
Travel time to work - 30 to 39 minutes (%)
Travel time to work - 30 to 39 minutes (% change since 2000)
Travel time to work - 40 to 59 minutes (%)
Travel time to work - 40 to 59 minutes (% change since 2000)
Travel time to work - 60 to 89 minutes (%)
Travel time to work - 60 to 89 minutes (% change since 2000)
Travel time to work - 90 or more minutes (%)
Travel time to work - 90 or more minutes (% change since 2000)
Marital status - Never married (%)
Marital status - Now married (%)
Marital status - Separated (%)
Marital status - Widowed (%)
Marital status - Divorced (%)
Median family income ($)
Median family income (% change since 2000)
Median non-family income ($)
Median non-family income (% change since 2000)
Median per capita income ($)
Median per capita income (% change since 2000)
Median family income ($) - White
Median family income ($) - Black or African American
Median family income ($) - Asian
Median family income ($) - Hispanic or Latino
Median family income ($) - American Indian and Alaska Native
Median family income ($) - Multirace
Median family income ($) - Other Race
Median year house/condo built
Median year apartment built
Year house built - Built 2005 or later (%)
Year house built - Built 2000 to 2004 (%)
Year house built - Built 1990 to 1999 (%)
Year house built - Built 1980 to 1989 (%)
Year house built - Built 1970 to 1979 (%)
Year house built - Built 1960 to 1969 (%)
Year house built - Built 1950 to 1959 (%)
Year house built - Built 1940 to 1949 (%)
Year house built - Built 1939 or earlier (%)
Average household size
Household density (households per square mile)
Average household size - White
Average household size - Black or African American
Average household size - Asian
Average household size - Hispanic or Latino
Average household size - American Indian and Alaska Native
Average household size - Multirace
Average household size - Other Race
Occupied housing units (%)
Vacant housing units (%)
Owner occupied housing units (%)
Renter occupied housing units (%)
Vacancy status - For rent (%)
Vacancy status - For sale only (%)
Vacancy status - Rented or sold, not occupied (%)
Vacancy status - For seasonal, recreational, or occasional use (%)
Vacancy status - For migrant workers (%)
Vacancy status - Other vacant (%)
Residents with income below the poverty level (%)
Residents with income below 50% of the poverty level (%)
Children below poverty level (%)
Poor families by family type - Married-couple family (%)
Poor families by family type - Male, no wife present (%)
Poor families by family type - Female, no husband present (%)
Poverty status for native-born residents (%)
Poverty status for foreign-born residents (%)
Poverty among high school graduates not in families (%)
Poverty among people who did not graduate high school not in families (%)
Residents with income below the poverty level (%) - White
Residents with income below the poverty level (%) - Black or African American
Residents with income below the poverty level (%) - Asian
Residents with income below the poverty level (%) - Hispanic or Latino
Residents with income below the poverty level (%) - American Indian and Alaska Native
Residents with income below the poverty level (%) - Multirace
Residents with income below the poverty level (%) - Other Race
Air pollution - Air Quality Index (AQI)
Air pollution - CO
Air pollution - NO2
Air pollution - SO2
Air pollution - Ozone
Air pollution - PM10
Air pollution - PM25
Air pollution - Pb
Crime - Murders per 100,000 population
Crime - Rapes per 100,000 population
Crime - Robberies per 100,000 population
Crime - Assaults per 100,000 population
Crime - Burglaries per 100,000 population
Crime - Thefts per 100,000 population
Crime - Auto thefts per 100,000 population
Crime - Arson per 100,000 population
Crime - City-data.com crime index
Crime - Violent crime index
Crime - Property crime index
Crime - Murders per 100,000 population (5 year average)
Crime - Rapes per 100,000 population (5 year average)
Crime - Robberies per 100,000 population (5 year average)
Crime - Assaults per 100,000 population (5 year average)
Crime - Burglaries per 100,000 population (5 year average)
Crime - Thefts per 100,000 population (5 year average)
Crime - Auto thefts per 100,000 population (5 year average)
Crime - Arson per 100,000 population (5 year average)
Crime - City-data.com crime index (5 year average)
Crime - Violent crime index (5 year average)
Crime - Property crime index (5 year average)
1996 Presidential Elections Results (%) - Democratic Party (Clinton)
1996 Presidential Elections Results (%) - Republican Party (Dole)
1996 Presidential Elections Results (%) - Other
2000 Presidential Elections Results (%) - Democratic Party (Gore)
2000 Presidential Elections Results (%) - Republican Party (Bush)
2000 Presidential Elections Results (%) - Other
2004 Presidential Elections Results (%) - Democratic Party (Kerry)
2004 Presidential Elections Results (%) - Republican Party (Bush)
2004 Presidential Elections Results (%) - Other
2008 Presidential Elections Results (%) - Democratic Party (Obama)
2008 Presidential Elections Results (%) - Republican Party (McCain)
2008 Presidential Elections Results (%) - Other
2012 Presidential Elections Results (%) - Democratic Party (Obama)
2012 Presidential Elections Results (%) - Republican Party (Romney)
2012 Presidential Elections Results (%) - Other
2016 Presidential Elections Results (%) - Democratic Party (Clinton)
2016 Presidential Elections Results (%) - Republican Party (Trump)
2016 Presidential Elections Results (%) - Other
2020 Presidential Elections Results (%) - Democratic Party (Biden)
2020 Presidential Elections Results (%) - Republican Party (Trump)
2020 Presidential Elections Results (%) - Other
Ancestries Reported - Arab (%)
Ancestries Reported - Czech (%)
Ancestries Reported - Danish (%)
Ancestries Reported - Dutch (%)
Ancestries Reported - English (%)
Ancestries Reported - French (%)
Ancestries Reported - French Canadian (%)
Ancestries Reported - German (%)
Ancestries Reported - Greek (%)
Ancestries Reported - Hungarian (%)
Ancestries Reported - Irish (%)
Ancestries Reported - Italian (%)
Ancestries Reported - Lithuanian (%)
Ancestries Reported - Norwegian (%)
Ancestries Reported - Polish (%)
Ancestries Reported - Portuguese (%)
Ancestries Reported - Russian (%)
Ancestries Reported - Scotch-Irish (%)
Ancestries Reported - Scottish (%)
Ancestries Reported - Slovak (%)
Ancestries Reported - Subsaharan African (%)
Ancestries Reported - Swedish (%)
Ancestries Reported - Swiss (%)
Ancestries Reported - Ukrainian (%)
Ancestries Reported - United States (%)
Ancestries Reported - Welsh (%)
Ancestries Reported - West Indian (%)
Ancestries Reported - Other (%)
Educational Attainment - No schooling completed (%)
Educational Attainment - Less than high school (%)
Educational Attainment - High school or equivalent (%)
Educational Attainment - Less than 1 year of college (%)
Educational Attainment - 1 or more years of college (%)
Educational Attainment - Associate degree (%)
Educational Attainment - Bachelor's degree (%)
Educational Attainment - Master's degree (%)
Educational Attainment - Professional school degree (%)
Educational Attainment - Doctorate degree (%)
School Enrollment - Nursery, preschool (%)
School Enrollment - Kindergarten (%)
School Enrollment - Grade 1 to 4 (%)
School Enrollment - Grade 5 to 8 (%)
School Enrollment - Grade 9 to 12 (%)
School Enrollment - College undergrad (%)
School Enrollment - Graduate or professional (%)
School Enrollment - Not enrolled in school (%)
School enrollment - Public schools (%)
School enrollment - Private schools (%)
School enrollment - Not enrolled (%)
Median number of rooms in houses and condos
Median number of rooms in apartments
Housing units lacking complete plumbing facilities (%)
Housing units lacking complete kitchen facilities (%)
Density of houses
Urban houses (%)
Rural houses (%)
Households with people 60 years and over (%)
Households with people 65 years and over (%)
Households with people 75 years and over (%)
Households with one or more nonrelatives (%)
Households with no nonrelatives (%)
Population in households (%)
Family households (%)
Nonfamily households (%)
Population in families (%)
Family households with own children (%)
Median number of bedrooms in owner occupied houses
Mean number of bedrooms in owner occupied houses
Median number of bedrooms in renter occupied houses
Mean number of bedrooms in renter occupied houses
Median number of vehichles in owner occupied houses
Mean number of vehichles in owner occupied houses
Median number of vehichles in renter occupied houses
Mean number of vehichles in renter occupied houses
Mortgage status - with mortgage (%)
Mortgage status - with second mortgage (%)
Mortgage status - with home equity loan (%)
Mortgage status - with both second mortgage and home equity loan (%)
Mortgage status - without a mortgage (%)
Average family size
Average family size - White
Average family size - Black or African American
Average family size - Asian
Average family size - Hispanic or Latino
Average family size - American Indian and Alaska Native
Average family size - Multirace
Average family size - Other Race
Geographical mobility - Same house 1 year ago (%)
Geographical mobility - Moved within same county (%)
Geographical mobility - Moved from different county within same state (%)
Geographical mobility - Moved from different state (%)
Geographical mobility - Moved from abroad (%)
Place of birth - Born in state of residence (%)
Place of birth - Born in other state (%)
Place of birth - Native, outside of US (%)
Place of birth - Foreign born (%)
Housing units in structures - 1, detached (%)
Housing units in structures - 1, attached (%)
Housing units in structures - 2 (%)
Housing units in structures - 3 or 4 (%)
Housing units in structures - 5 to 9 (%)
Housing units in structures - 10 to 19 (%)
Housing units in structures - 20 to 49 (%)
Housing units in structures - 50 or more (%)
Housing units in structures - Mobile home (%)
Housing units in structures - Boat, RV, van, etc. (%)
House/condo owner moved in on average (years ago)
Renter moved in on average (years ago)
Year householder moved into unit - Moved in 1999 to March 2000 (%)
Year householder moved into unit - Moved in 1995 to 1998 (%)
Year householder moved into unit - Moved in 1990 to 1994 (%)
Year householder moved into unit - Moved in 1980 to 1989 (%)
Year householder moved into unit - Moved in 1970 to 1979 (%)
Year householder moved into unit - Moved in 1969 or earlier (%)
Means of transportation to work - Drove car alone (%)
Means of transportation to work - Carpooled (%)
Means of transportation to work - Public transportation (%)
Means of transportation to work - Bus or trolley bus (%)
Means of transportation to work - Streetcar or trolley car (%)
Means of transportation to work - Subway or elevated (%)
Means of transportation to work - Railroad (%)
Means of transportation to work - Ferryboat (%)
Means of transportation to work - Taxicab (%)
Means of transportation to work - Motorcycle (%)
Means of transportation to work - Bicycle (%)
Means of transportation to work - Walked (%)
Means of transportation to work - Other means (%)
Working at home (%)
Industry diversity
Most Common Industries - Agriculture, forestry, fishing and hunting, and mining (%)
Most Common Industries - Agriculture, forestry, fishing and hunting (%)
Most Common Industries - Mining, quarrying, and oil and gas extraction (%)
Most Common Industries - Construction (%)
Most Common Industries - Manufacturing (%)
Most Common Industries - Wholesale trade (%)
Most Common Industries - Retail trade (%)
Most Common Industries - Transportation and warehousing, and utilities (%)
Most Common Industries - Transportation and warehousing (%)
Most Common Industries - Utilities (%)
Most Common Industries - Information (%)
Most Common Industries - Finance and insurance, and real estate and rental and leasing (%)
Most Common Industries - Finance and insurance (%)
Most Common Industries - Real estate and rental and leasing (%)
Most Common Industries - Professional, scientific, and management, and administrative and waste management services (%)
Most Common Industries - Professional, scientific, and technical services (%)
Most Common Industries - Management of companies and enterprises (%)
Most Common Industries - Administrative and support and waste management services (%)
Most Common Industries - Educational services, and health care and social assistance (%)
Most Common Industries - Educational services (%)
Most Common Industries - Health care and social assistance (%)
Most Common Industries - Arts, entertainment, and recreation, and accommodation and food services (%)
Most Common Industries - Arts, entertainment, and recreation (%)
Most Common Industries - Accommodation and food services (%)
Most Common Industries - Other services, except public administration (%)
Most Common Industries - Public administration (%)
Occupation diversity
Most Common Occupations - Management, business, science, and arts occupations (%)
Most Common Occupations - Management, business, and financial occupations (%)
Most Common Occupations - Management occupations (%)
Most Common Occupations - Business and financial operations occupations (%)
Most Common Occupations - Computer, engineering, and science occupations (%)
Most Common Occupations - Computer and mathematical occupations (%)
Most Common Occupations - Architecture and engineering occupations (%)
Most Common Occupations - Life, physical, and social science occupations (%)
Most Common Occupations - Education, legal, community service, arts, and media occupations (%)
Most Common Occupations - Community and social service occupations (%)
Most Common Occupations - Legal occupations (%)
Most Common Occupations - Education, training, and library occupations (%)
Most Common Occupations - Arts, design, entertainment, sports, and media occupations (%)
Most Common Occupations - Healthcare practitioners and technical occupations (%)
Most Common Occupations - Health diagnosing and treating practitioners and other technical occupations (%)
Most Common Occupations - Health technologists and technicians (%)
Most Common Occupations - Service occupations (%)
Most Common Occupations - Healthcare support occupations (%)
Most Common Occupations - Protective service occupations (%)
Most Common Occupations - Fire fighting and prevention, and other protective service workers including supervisors (%)
Most Common Occupations - Law enforcement workers including supervisors (%)
Most Common Occupations - Food preparation and serving related occupations (%)
Most Common Occupations - Building and grounds cleaning and maintenance occupations (%)
Most Common Occupations - Personal care and service occupations (%)
Most Common Occupations - Sales and office occupations (%)
Most Common Occupations - Sales and related occupations (%)
Most Common Occupations - Office and administrative support occupations (%)
Most Common Occupations - Natural resources, construction, and maintenance occupations (%)
Most Common Occupations - Farming, fishing, and forestry occupations (%)
Most Common Occupations - Construction and extraction occupations (%)
Most Common Occupations - Installation, maintenance, and repair occupations (%)
Most Common Occupations - Production, transportation, and material moving occupations (%)
Most Common Occupations - Production occupations (%)
Most Common Occupations - Transportation occupations (%)
Most Common Occupations - Material moving occupations (%)
People in Group quarters - Institutionalized population (%)
People in Group quarters - Correctional institutions (%)
People in Group quarters - Federal prisons and detention centers (%)
People in Group quarters - Halfway houses (%)
People in Group quarters - Local jails and other confinement facilities (including police lockups) (%)
People in Group quarters - Military disciplinary barracks (%)
People in Group quarters - State prisons (%)
People in Group quarters - Other types of correctional institutions (%)
People in Group quarters - Nursing homes (%)
People in Group quarters - Hospitals/wards, hospices, and schools for the handicapped (%)
People in Group quarters - Hospitals/wards and hospices for chronically ill (%)
People in Group quarters - Hospices or homes for chronically ill (%)
People in Group quarters - Military hospitals or wards for chronically ill (%)
People in Group quarters - Other hospitals or wards for chronically ill (%)
People in Group quarters - Hospitals or wards for drug/alcohol abuse (%)
People in Group quarters - Mental (Psychiatric) hospitals or wards (%)
People in Group quarters - Schools, hospitals, or wards for the mentally retarded (%)
People in Group quarters - Schools, hospitals, or wards for the physically handicapped (%)
People in Group quarters - Institutions for the deaf (%)
People in Group quarters - Institutions for the blind (%)
People in Group quarters - Orthopedic wards and institutions for the physically handicapped (%)
People in Group quarters - Wards in general hospitals for patients who have no usual home elsewhere (%)
People in Group quarters - Wards in military hospitals for patients who have no usual home elsewhere (%)
People in Group quarters - Juvenile institutions (%)
People in Group quarters - Long-term care (%)
People in Group quarters - Homes for abused, dependent, and neglected children (%)
People in Group quarters - Residential treatment centers for emotionally disturbed children (%)
People in Group quarters - Training schools for juvenile delinquents (%)
People in Group quarters - Short-term care, detention or diagnostic centers for delinquent children (%)
People in Group quarters - Type of juvenile institution unknown (%)
People in Group quarters - Noninstitutionalized population (%)
People in Group quarters - College dormitories (includes college quarters off campus) (%)
People in Group quarters - Military quarters (%)
People in Group quarters - On base (%)
People in Group quarters - Barracks, unaccompanied personnel housing (UPH), (Enlisted/Officer), ;and similar group living quarters for military personnel (%)
People in Group quarters - Transient quarters for temporary residents (%)
People in Group quarters - Military ships (%)
People in Group quarters - Group homes (%)
People in Group quarters - Homes or halfway houses for drug/alcohol abuse (%)
People in Group quarters - Homes for the mentally ill (%)
People in Group quarters - Homes for the mentally retarded (%)
People in Group quarters - Homes for the physically handicapped (%)
People in Group quarters - Other group homes (%)
People in Group quarters - Religious group quarters (%)
People in Group quarters - Dormitories (%)
People in Group quarters - Agriculture workers' dormitories on farms (%)
People in Group quarters - Job Corps and vocational training facilities (%)
People in Group quarters - Other workers' dormitories (%)
People in Group quarters - Crews of maritime vessels (%)
People in Group quarters - Other nonhousehold living situations (%)
People in Group quarters - Other noninstitutional group quarters (%)
Residents speaking English at home (%)
Residents speaking English at home - Born in the United States (%)
Residents speaking English at home - Native, born elsewhere (%)
Residents speaking English at home - Foreign born (%)
Residents speaking Spanish at home (%)
Residents speaking Spanish at home - Born in the United States (%)
Residents speaking Spanish at home - Native, born elsewhere (%)
Residents speaking Spanish at home - Foreign born (%)
Residents speaking other language at home (%)
Residents speaking other language at home - Born in the United States (%)
Residents speaking other language at home - Native, born elsewhere (%)
Residents speaking other language at home - Foreign born (%)
Class of Workers - Employee of private company (%)
Class of Workers - Self-employed in own incorporated business (%)
Class of Workers - Private not-for-profit wage and salary workers (%)
Class of Workers - Local government workers (%)
Class of Workers - State government workers (%)
Class of Workers - Federal government workers (%)
Class of Workers - Self-employed workers in own not incorporated business and Unpaid family workers (%)
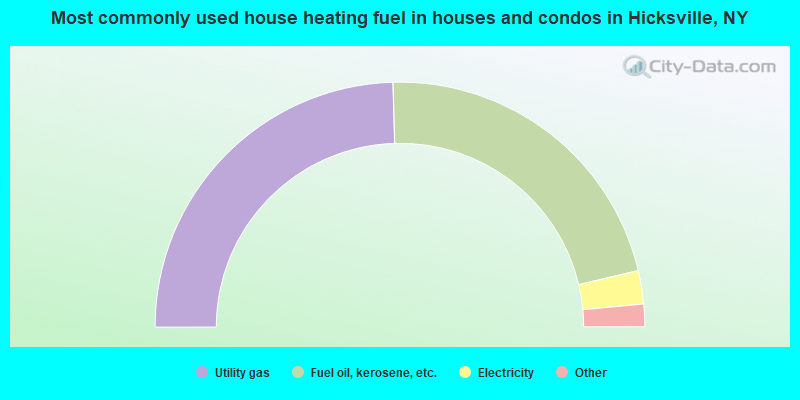
House heating fuel used in houses and condos - Utility gas (%)
House heating fuel used in houses and condos - Bottled, tank, or LP gas (%)
House heating fuel used in houses and condos - Electricity (%)
House heating fuel used in houses and condos - Fuel oil, kerosene, etc. (%)
House heating fuel used in houses and condos - Coal or coke (%)
House heating fuel used in houses and condos - Wood (%)
House heating fuel used in houses and condos - Solar energy (%)
House heating fuel used in houses and condos - Other fuel (%)
House heating fuel used in houses and condos - No fuel used (%)
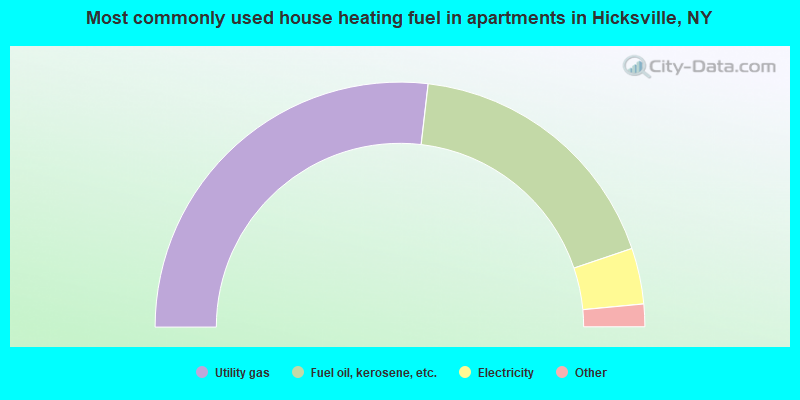
House heating fuel used in apartments - Utility gas (%)
House heating fuel used in apartments - Bottled, tank, or LP gas (%)
House heating fuel used in apartments - Electricity (%)
House heating fuel used in apartments - Fuel oil, kerosene, etc. (%)
House heating fuel used in apartments - Coal or coke (%)
House heating fuel used in apartments - Wood (%)
House heating fuel used in apartments - Solar energy (%)
House heating fuel used in apartments - Other fuel (%)
House heating fuel used in apartments - No fuel used (%)
Armed forces status - In Armed Forces (%)
Armed forces status - Civilian (%)
Armed forces status - Civilian - Veteran (%)
Armed forces status - Civilian - Nonveteran (%)
Fatal accidents locations in years 2005-2021
Fatal accidents locations in 2005
Fatal accidents locations in 2006
Fatal accidents locations in 2007
Fatal accidents locations in 2008
Fatal accidents locations in 2009
Fatal accidents locations in 2010
Fatal accidents locations in 2011
Fatal accidents locations in 2012
Fatal accidents locations in 2013
Fatal accidents locations in 2014
Fatal accidents locations in 2015
Fatal accidents locations in 2016
Fatal accidents locations in 2017
Fatal accidents locations in 2018
Fatal accidents locations in 2019
Fatal accidents locations in 2020
Fatal accidents locations in 2021
Alcohol use - People drinking some alcohol every month (%)
Alcohol use - People not drinking at all (%)
Alcohol use - Average days/month drinking alcohol
Alcohol use - Average drinks/week
Alcohol use - Average days/year people drink much
Audiometry - Average condition of hearing (%)
Audiometry - People that can hear a whisper from across a quiet room (%)
Audiometry - People that can hear normal voice from across a quiet room (%)
Audiometry - Ears ringing, roaring, buzzing (%)
Audiometry - Had a job exposure to loud noise (%)
Audiometry - Had off-work exposure to loud noise (%)
Blood Pressure & Cholesterol - Has high blood pressure (%)
Blood Pressure & Cholesterol - Checking blood pressure at home (%)
Blood Pressure & Cholesterol - Frequently checking blood cholesterol (%)
Blood Pressure & Cholesterol - Has high cholesterol level (%)
Consumer Behavior - Money monthly spent on food at supermarket/grocery store
Consumer Behavior - Money monthly spent on food at other stores
Consumer Behavior - Money monthly spent on eating out
Consumer Behavior - Money monthly spent on carryout/delivered foods
Consumer Behavior - Income spent on food at supermarket/grocery store (%)
Consumer Behavior - Income spent on food at other stores (%)
Consumer Behavior - Income spent on eating out (%)
Consumer Behavior - Income spent on carryout/delivered foods (%)
Current Health Status - General health condition (%)
Current Health Status - Blood donors (%)
Current Health Status - Has blood ever tested for HIV virus (%)
Current Health Status - Left-handed people (%)
Dermatology - People using sunscreen (%)
Diabetes - Diabetics (%)
Diabetes - Had a blood test for high blood sugar (%)
Diabetes - People taking insulin (%)
Diet Behavior & Nutrition - Diet health (%)
Diet Behavior & Nutrition - Milk product consumption (# of products/month)
Diet Behavior & Nutrition - Meals not home prepared (#/week)
Diet Behavior & Nutrition - Meals from fast food or pizza place (#/week)
Diet Behavior & Nutrition - Ready-to-eat foods (#/month)
Diet Behavior & Nutrition - Frozen meals/pizza (#/month)
Drug Use - People that ever used marijuana or hashish (%)
Drug Use - Ever used hard drugs (%)
Drug Use - Ever used any form of cocaine (%)
Drug Use - Ever used heroin (%)
Drug Use - Ever used methamphetamine (%)
Health Insurance - People covered by health insurance (%)
Kidney Conditions-Urology - Avg. # of times urinating at night
Medical Conditions - People with asthma (%)
Medical Conditions - People with anemia (%)
Medical Conditions - People with psoriasis (%)
Medical Conditions - People with overweight (%)
Medical Conditions - Elderly people having difficulties in thinking or remembering (%)
Medical Conditions - People who ever received blood transfusion (%)
Medical Conditions - People having trouble seeing even with glass/contacts (%)
Medical Conditions - People with arthritis (%)
Medical Conditions - People with gout (%)
Medical Conditions - People with congestive heart failure (%)
Medical Conditions - People with coronary heart disease (%)
Medical Conditions - People with angina pectoris (%)
Medical Conditions - People who ever had heart attack (%)
Medical Conditions - People who ever had stroke (%)
Medical Conditions - People with emphysema (%)
Medical Conditions - People with thyroid problem (%)
Medical Conditions - People with chronic bronchitis (%)
Medical Conditions - People with any liver condition (%)
Medical Conditions - People who ever had cancer or malignancy (%)
Mental Health - People who have little interest in doing things (%)
Mental Health - People feeling down, depressed, or hopeless (%)
Mental Health - People who have trouble sleeping or sleeping too much (%)
Mental Health - People feeling tired or having little energy (%)
Mental Health - People with poor appetite or overeating (%)
Mental Health - People feeling bad about themself (%)
Mental Health - People who have trouble concentrating on things (%)
Mental Health - People moving or speaking slowly or too fast (%)
Mental Health - People having thoughts they would be better off dead (%)
Oral Health - Average years since last visit a dentist
Oral Health - People embarrassed because of mouth (%)
Oral Health - People with gum disease (%)
Oral Health - General health of teeth and gums (%)
Oral Health - Average days a week using dental floss/device
Oral Health - Average days a week using mouthwash for dental problem
Oral Health - Average number of teeth
Pesticide Use - Households using pesticides to control insects (%)
Pesticide Use - Households using pesticides to kill weeds (%)
Physical Activity - People doing vigorous-intensity work activities (%)
Physical Activity - People doing moderate-intensity work activities (%)
Physical Activity - People walking or bicycling (%)
Physical Activity - People doing vigorous-intensity recreational activities (%)
Physical Activity - People doing moderate-intensity recreational activities (%)
Physical Activity - Average hours a day doing sedentary activities
Physical Activity - Average hours a day watching TV or videos
Physical Activity - Average hours a day using computer
Physical Functioning - People having limitations keeping them from working (%)
Physical Functioning - People limited in amount of work they can do (%)
Physical Functioning - People that need special equipment to walk (%)
Physical Functioning - People experiencing confusion/memory problems (%)
Physical Functioning - People requiring special healthcare equipment (%)
Prescription Medications - Average number of prescription medicines taking
Preventive Aspirin Use - Adults 40+ taking low-dose aspirin (%)
Reproductive Health - Vaginal deliveries (%)
Reproductive Health - Cesarean deliveries (%)
Reproductive Health - Deliveries resulted in a live birth (%)
Reproductive Health - Pregnancies resulted in a delivery (%)
Reproductive Health - Women breastfeeding newborns (%)
Reproductive Health - Women that had a hysterectomy (%)
Reproductive Health - Women that had both ovaries removed (%)
Reproductive Health - Women that have ever taken birth control pills (%)
Reproductive Health - Women taking birth control pills (%)
Reproductive Health - Women that have ever used Depo-Provera or injectables (%)
Reproductive Health - Women that have ever used female hormones (%)
Sexual Behavior - People 18+ that ever had sex (vaginal, anal, or oral) (%)
Sexual Behavior - Males 18+ that ever had vaginal sex with a woman (%)
Sexual Behavior - Males 18+ that ever performed oral sex on a woman (%)
Sexual Behavior - Males 18+ that ever had anal sex with a woman (%)
Sexual Behavior - Males 18+ that ever had any sex with a man (%)
Sexual Behavior - Females 18+ that ever had vaginal sex with a man (%)
Sexual Behavior - Females 18+ that ever performed oral sex on a man (%)
Sexual Behavior - Females 18+ that ever had anal sex with a man (%)
Sexual Behavior - Females 18+ that ever had any kind of sex with a woman (%)
Sexual Behavior - Average age people first had sex
Sexual Behavior - Average number of female sex partners in lifetime (males 18+)
Sexual Behavior - Average number of female vaginal sex partners in lifetime (males 18+)
Sexual Behavior - Average age people first performed oral sex on a woman (18+)
Sexual Behavior - Average number of woman performed oral sex on in lifetime (18+)
Sexual Behavior - Average number of male sex partners in lifetime (males 18+)
Sexual Behavior - Average number of male anal sex partners in lifetime (males 18+)
Sexual Behavior - Average age people first performed oral sex on a man (18+)
Sexual Behavior - Average number of male oral sex partners in lifetime (18+)
Sexual Behavior - People using protection when performing oral sex (%)
Sexual Behavior - Average number of times people have vaginal or anal sex a year
Sexual Behavior - People having sex without condom (%)
Sexual Behavior - Average number of male sex partners in lifetime (females 18+)
Sexual Behavior - Average number of male vaginal sex partners in lifetime (females 18+)
Sexual Behavior - Average number of female sex partners in lifetime (females 18+)
Sexual Behavior - Circumcised males 18+ (%)
Sleep Disorders - Average hours sleeping at night
Sleep Disorders - People that has trouble sleeping (%)
Smoking-Cigarette Use - People smoking cigarettes (%)
Taste & Smell - People 40+ having problems with smell (%)
Taste & Smell - People 40+ having problems with taste (%)
Taste & Smell - People 40+ that ever had wisdom teeth removed (%)
Taste & Smell - People 40+ that ever had tonsils teeth removed (%)
Taste & Smell - People 40+ that ever had a loss of consciousness because of a head injury (%)
Taste & Smell - People 40+ that ever had a broken nose or other serious injury to face or skull (%)
Taste & Smell - People 40+ that ever had two or more sinus infections (%)
Weight - Average height (inches)
Weight - Average weight (pounds)
Weight - Average BMI
Weight - People that are obese (%)
Weight - People that ever were obese (%)
Weight - People trying to lose weight (%)
According to our research of New York and other state lists, there were 8 registered sex offenders living in Hicksville, New York as of May 21, 2024 . The ratio of all residents to sex offenders in Hicksville is 5,376 to 1.The ratio of registered sex offenders to all residents in this city is much lower than the state average.
Latest news from Hicksville, NY collected exclusively by city-data.com from local newspapers, TV, and radio stations
Hicksville, NY City Guides: Ancestries: Italian (11.3%), Irish (4.5%), American (4.4%), German (2.8%), Afghan (2.7%), Polish (2.1%).
Current Local Time:
Land area: 6.81 square miles.
Population density: 6,099 people per square mile (high).
14,915 residents are foreign born (20.3% Asia , 10.2% Latin America ).
This place:
34.0%New York:
22.6%
Median real estate property taxes paid for housing units with mortgages in 2022: $10,001 (1.6%)Median real estate property taxes paid for housing units with no mortgage in 2022: $9,631 (1.7%)
Nearest city with pop. 50,000+: Levittown, NY
Nearest city with pop. 200,000+: North Hempstead, NY
Nearest city with pop. 1,000,000+: Queens, NY
Nearest cities:
Latitude: 40.76 N, Longitude: 73.52 W
Daytime population change due to commuting: -358 (-0.8%)Workers who live and work in this place: 5,875 (25.2%)
Hicksville tourist attractions:
Unemployment in December 2023:
Most common occupations in Hicksville, NY (%)
Both Males Females
Other office and administrative support workers, including supervisors (5.6%)
Other sales and related occupations, including supervisors (4.2%)
Secretaries and administrative assistants (4.1%)
Retail sales workers, except cashiers (3.7%)
Law enforcement workers, including supervisors (3.1%)
Other management occupations, except farmers and farm managers (3.0%)
Sales representatives, services, wholesale and manufacturing (3.0%)
Other sales and related occupations, including supervisors (5.3%)
Law enforcement workers, including supervisors (5.2%)
Material recording, scheduling, dispatching, and distributing workers (4.1%)
Building and grounds cleaning and maintenance occupations (3.9%)
Sales representatives, services, wholesale and manufacturing (3.5%)
Other management occupations, except farmers and farm managers (3.4%)
Other production occupations, including supervisors (3.3%)
Secretaries and administrative assistants (9.3%)
Other office and administrative support workers, including supervisors (9.1%)
Registered nurses (5.0%)
Preschool, kindergarten, elementary, and middle school teachers (4.4%)
Retail sales workers, except cashiers (4.2%)
Information and record clerks, except customer service representatives (4.0%)
Other teachers, instructors, education, training, and library occupations (3.5%)
Tornado activity:
Hicksville-area historical tornado activity is slightly above New York state average. It is 52% smaller than the overall U.S. average.
On 7/10/1989, a category F4 (max. wind speeds 207-260 mph) tornado 49.7 miles away from the Hicksville place center injured 40 people and caused between $50,000,000 and $500,000,000 in damages.
On 9/27/1970, a category F2 (max. wind speeds 113-157 mph) tornado 4.5 miles away from the place center caused between $50,000 and $500,000 in damages.
Earthquake activity:
Hicksville-area historical earthquake activity is significantly above New York state average. It is 70% smaller than the overall U.S. average. On 8/23/2011 at 17:51:04, a magnitude 5.8 (5.8 MW, Depth: 3.7 mi, Class: Moderate, Intensity: VI - VII) earthquake occurred 307.7 miles away from the city center On 10/7/1983 at 10:18:46, a magnitude 5.3 (5.1 MB, 5.3 LG, 5.1 ML) earthquake occurred 224.5 miles away from the city center On 4/20/2002 at 10:50:47, a magnitude 5.3 (5.3 ML, Depth: 3.0 mi) earthquake occurred 259.5 miles away from Hicksville center On 1/16/1994 at 01:49:16, a magnitude 4.6 (4.6 MB, 4.6 LG, Depth: 3.1 mi, Class: Light, Intensity: IV - V) earthquake occurred 135.5 miles away from Hicksville center On 4/20/2002 at 10:50:47, a magnitude 5.2 (5.2 MB, 4.2 MS, 5.2 MW, 5.0 MW) earthquake occurred 257.7 miles away from Hicksville center On 8/22/1992 at 12:20:32, a magnitude 4.8 (4.8 MB, 3.8 MS, 4.7 LG, Depth: 6.2 mi) earthquake occurred 205.0 miles away from Hicksville center Magnitude types: regional Lg-wave magnitude (LG), body-wave magnitude (MB), local magnitude (ML), surface-wave magnitude (MS), moment magnitude (MW) Natural disasters: The number of natural disasters in Nassau County (25) is a lot greater than the US average (15).Major Disasters (Presidential) Declared: 17Emergencies Declared: 7Hurricanes: 8, Storms: 7, Floods: 6, Blizzards: 2, Snowstorms: 2, Heavy Rain: 1, Power Outage: 1, Tropical Depression: 1, Tropical Storm: 1, Water Shortage: 1, Winter Storm: 1, Other: 3 (Note: some incidents may be assigned to more than one category). Main business address for: KEYSPAN CORP NATURAL GAS DISTRIBUTION ), COLONIAL COMMERCIAL CORP WHOLESALE-HARDWARE & PLUMBING & HEATING EQUIPMENT & SUPPLIES ).
Hospitals and medical centers in Hicksville: EPILEPSY FOUNDATION OF LONG ISLAND, INC (12 VIOLET AVENUE) ABLE HEALTH CARE SERVICES INC CHHA (76 NORTH BROADWAY, SUITE 4000)
FAMILY CARE CERTIFIED SERVICES NASSAU CHHA (120 WEST JOHN STREET)
STAFF BUILDERS HOME HEALTH HICKSVILLE (99 RAILROAD STATION PLAZA SUITE 100)
Amtrak stations near Hicksville: 16 miles: KENNEDY AIRPORT NEW YORK (QUEENS, ) - Bus Station Services: enclosed waiting area, public restrooms, public payphones, snack bar and vending machines, ATM, paid short-term parking, paid long-term parking, car rental agency, taxi stand.
18 miles: NEW ROCHELLE (DEPOT PLAZA NORTH) Services: enclosed waiting area, public restrooms, public payphones, paid short-term parking, paid long-term parking, call for car rental service, taxi stand, public transit connection.
19 miles: LA GUARDIA AIRPORT (QUEENS, ) - Bus Station Services: enclosed waiting area, public restrooms, public payphones, snack bar and vending machines, ATM, paid short-term parking, paid long-term parking, car rental agency, taxi stand.
Colleges/universities with over 2000 students nearest to Hicksville:
Briarcliffe College (about 2 miles; Bethpage, NY ; Full-time enrollment: 2,134)
SUNY College at Old Westbury (about 4 miles; Old Westbury, NY ; FT enrollment: 4,096)
Nassau Community College (about 5 miles; Garden City, NY ; FT enrollment: 18,552)
Farmingdale State College (about 6 miles; Farmingdale, NY ; FT enrollment: 6,956)
Hofstra University (about 6 miles; Hempstead, NY ; FT enrollment: 9,429)
LIU Post (about 6 miles; Brookville, NY ; FT enrollment: 6,854)
New York Institute of Technology (about 6 miles; Old Westbury, NY ; FT enrollment: 5,745)
Public high school in Hicksville:
Private high school in Hicksville:
Public elementary/middle schools in Hicksville: HICKSVILLE MIDDLE SCHOOL Students: 1,273, Location: 215 JERUSALEM AVE, Grades: 6-8)LEE AVENUE SCHOOL Students: 452, Location: 1 7TH ST, Grades: KG-5)EAST STREET SCHOOL Students: 370, Location: 50 EAST ST, Grades: KG-5)WOODLAND AVENUE SCHOOL Students: 367, Location: 85 KETCHAM RD, Grades: KG-5)OLD COUNTRY ROAD SCHOOL Students: 342, Location: 49 RHODES LN, Grades: KG-5)DUTCH LANE SCHOOL Students: 311, Location: 50 STEWART AVE, Grades: KG-5)FORK LANE SCHOOL Students: 276, Location: 4 FORK LN, Grades: KG-5)BURNS AVENUE SCHOOL Students: 272, Location: 40 BURNS AVE, Grades: KG-5)Private elementary/middle schools in Hicksville: TRINITY LUTHERAN SCHOOL Students: 406, Location: 40 W NICHOLAI ST, Grades: PK-8)OUR LADY OF MERCY SCHOOL Students: 371, Location: 520 S OYSTER BAY RD, Grades: PK-8)
HOLY FAMILY SCHOOL Students: 254, Location: 25 FORDHAM AVE, Grades: PK-8)ST IGNATIUS LOYOLA SCHOOL Students: 226, Location: 30 E CHERRY ST, Grades: PK-8)CAROUSEL DAY SCHOOL Students: 71, Location: 9 WEST AVE, Grades: PK-1)See full list of schools located in Hicksville Library in Hicksville: HICKSVILLE FREE PUBLIC LIBRARY Operating income: $4,608,315; Location: 169 JERUSALEM AVENUE; 253,975 books ; 428 e-books ; 8,687 audio materials ; 8,927 video materials ; 33 local licensed databases ; 14 state licensed databases ; 3 other licensed databases ; 381 print serial subscriptions ; 1 electronic serial subscriptions )
User-submitted facts and corrections:
Billy Joel, Musician, and Lorraine Bracco, Actress, were both raised in Hicksville
Notable locations in Hicksville: (A) , Hicksville Industrial Park (B) , Hicksville Station (C) , Hicksville Public Library (D) , Hicksville Gregory Museum (E) , Heitz Place Courthouse (F) , Hicksville Fire Department (G) , Hicksville Medical Arts Building (H) , Play House Theatre (I) . Display/hide their locations on the map
Shopping Center: (1) . Display/hide its location on the map
Main business address in Hicksville include: (A) , COLONIAL COMMERCIAL CORP (B) . Display/hide their locations on the map
Churches in Hicksville include: (A) , New York Evergreen Presbyterian Church (B) , Our Lady of Mercy Church (C) , Holy Trinity Greek Orthodox Church (D) , Afghan Hindu Temple (E) , Saint Ignatius Loyola Roman Catholic Church (F) , Hicksville Christian Church (G) , Long Island Abundant Life Church (H) , Holy Spirit Christian Church (I) . Display/hide their locations on the map
Cemetery: (1) . Display/hide its location on the map
Parks in Hicksville include: (1) , Cantiague Park (2) , West Village Green (3) . Display/hide their locations on the map
Hotel:
Birthplace of: Dennis M. Lynch - Businessman, Michael Collins (soccer) - Soccer player, Mitch Kupchak - Basketball player, Paul Eibeler - Chief executive, Dave Smyth - Soccer player-coach, Larry Eisenhauer - Football player, Sean Corrigan - College basketball player (Loyola MD Greyhounds).
Nassau County has a predicted average indoor radon screening level less than 2 pCi/L (pico curies per liter) - Low Potential Average household size: This place:
3.1 peopleNew York:
2.6 people
Percentage of family households: This place:
78.7%Whole state:
63.5%
Percentage of households with unmarried partners: This place:
3.4%Whole state:
6.8%
Likely homosexual households (counted as self-reported same-sex unmarried-partner households)
Lesbian couples: 0.4% of all households Gay men: 0.2% of all households
People in group quarters in Hicksville in 2010:
41 people in other noninstitutional facilities
39 people in group homes intended for adults
4 people in residential treatment centers for adults
People in group quarters in Hicksville in 2000:
48 people in religious group quarters
38 people in other noninstitutional group quarters
33 people in homes for the mentally ill
16 people in homes for the mentally retarded
8 people in homes or halfway houses for drug/alcohol abuse
Banks with most branches in Hicksville (2011 data):
JPMorgan Chase Bank, National Association: Hicksville Branch, Mid Island Plaza Branch, Hicksville Branch. Info updated 2011/11/10: Bank assets: $1,811,678.0 mil, Deposits: $1,190,738.0 mil, headquarters in Columbus, OH, positive income , International Specialization, 5577 total offices , Holding Company: Jpmorgan Chase & Co.
Ridgewood Savings Bank: Hicksville Branch at 220 Old Country Rd, branch established on 1921/01/01; Hicksville Branch at 169 Old Country Road, branch established on 1999/09/13. Info updated 2012/01/27: Bank assets: $4,804.0 mil, Deposits: $3,951.9 mil, headquarters in Ridgewood, NY, positive income , Mortgage Lending Specialization, 37 total offices
The First National Bank of Long Island: Hicksville Branch at 106 Old Country Road, branch established on 1988/01/19. Info updated 2006/07/13: Bank assets: $2,021.9 mil, Deposits: $1,503.5 mil, headquarters in Glen Head, NY, positive income , Mortgage Lending Specialization, 34 total offices , Holding Company: First Of Long Island Corporation, The
Bank of America, National Association: Hicksville Branch at 20 Jerusalem Avenue, branch established on 1954/12/20. Info updated 2009/11/18: Bank assets: $1,451,969.3 mil, Deposits: $1,077,176.8 mil, headquarters in Charlotte, NC, positive income , 5782 total offices , Holding Company: Bank Of America Corporation
Capital One, National Association: Hicksville Branch at 190 Broadway, branch established on 1987/01/06. Info updated 2011/07/01: Bank assets: $133,477.8 mil, Deposits: $97,063.7 mil, headquarters in Mclean, VA, positive income , 984 total offices , Holding Company: Capital One Financial Corporation
RBS Citizens, National Association: Hicksville S&S Branch at 530 W. Old Country Road, branch established on 2008/11/20. Info updated 2007/09/19: Bank assets: $106,940.6 mil, Deposits: $75,690.2 mil, headquarters in Providence, RI, positive income , 1135 total offices , Holding Company: Uk Financial Investments Limited
Indus American Bank: Hicksville Branch at 70 Broadway, branch established on 2008/12/08. Info updated 2011/12/19: Bank assets: $206.4 mil, Deposits: $157.9 mil, headquarters in Iselin, NJ, negative income in the last year , Commercial Lending Specialization, 4 total offices , Holding Company: Ia Bancorp, Inc.
New York Commercial Bank: Hicksville Branch at 265 North Broadway, branch established on 1997/03/15. Info updated 2010/12/14: Bank assets: $2,585.3 mil, Deposits: $1,896.7 mil, headquarters in Westbury, NY, positive income , Commercial Lending Specialization, 34 total offices , Holding Company: New York Community Bancorp, Inc.
People's United Bank: Hicksville Branch at 404 South Oyster Bay Road, branch established on 2010/11/08. Info updated 2012/02/16: Bank assets: $27,319.3 mil, Deposits: $20,835.4 mil, headquarters in Bridgeport, CT, positive income , Commercial Lending Specialization, 374 total offices
3 other banks with 3 local branches
For population 15 years and over in Hicksville:
Never married: 32.5%Now married: 54.1%Separated: 0.6%Widowed: 6.5%Divorced: 6.3% For population 25 years and over in Hicksville:
High school or higher: 91.0%Bachelor's degree or higher: 43.5%Graduate or professional degree: 17.1%Unemployed: 2.5%Mean travel time to work (commute): 30.6 minutes
Education Gini index (Inequality in education) Here:
14.0New York average:
13.9
Religion statistics for Hicksville, NY (based on Nassau County data)
Religion Adherents Congregations Catholic 677,149 73 Other 102,012 168 Mainline Protestant 50,181 184 Evangelical Protestant 39,923 251 Orthodox 16,758 22 Black Protestant 13,189 45 None 440,320 -
Source: Clifford Grammich, Kirk Hadaway, Richard Houseal, Dale E.Jones, Alexei Krindatch, Richie Stanley and Richard H.Taylor. 2012. 2010 U.S.Religion Census: Religious Congregations & Membership Study. Association of Statisticians of American Religious Bodies. Jones, Dale E., et al. 2002. Congregations and Membership in the United States 2000. Nashville, TN: Glenmary Research Center. Graphs represent county-level data
Food Environment Statistics: Number of grocery stores : 556This county :
4.11 / 10,000 pop.New York :
4.13 / 10,000 pop.
Number of supercenters and club stores : 7Here :
0.05 / 10,000 pop.New York :
0.06 / 10,000 pop.
Number of convenience stores (no gas) : 201Nassau County :
1.49 / 10,000 pop.New York :
0.92 / 10,000 pop.
Number of convenience stores (with gas) : 174Nassau County :
1.29 / 10,000 pop.New York :
1.68 / 10,000 pop.
Number of full-service restaurants : 1,219Nassau County :
9.01 / 10,000 pop.State :
8.82 / 10,000 pop.
Adult diabetes rate : Nassau County :
8.3%New York :
8.2%
Adult obesity rate : Nassau County :
20.9%State :
23.8%
Low-income preschool obesity rate : Health and Nutrition: Healthy diet rate : Hicksville:
52.1%New York:
50.1%
Average overall health of teeth and gums : Hicksville:
49.5%New York:
48.1%
Average BMI : Hicksville:
28.2State:
28.5
People feeling badly about themselves : Hicksville:
19.7%New York:
20.3%
People not drinking alcohol at all : Hicksville:
11.2%New York:
11.1%
Average hours sleeping at night : Hicksville:
6.9New York:
6.8
Overweight people : Hicksville:
33.1%State:
33.4%
General health condition : Hicksville:
57.6%State:
56.5%
Average condition of hearing : Hicksville:
78.9%New York:
80.2%
More about Health and Nutrition of Hicksville, NY Residents
4.70% of this county's 2021 resident taxpayers lived in other counties in 2020 ($121,726 average adjusted gross income )
Here:
4.70%New York average:
5.29%
0.01% of residents moved from foreign countries ($55 average AGI )Nassau County:
0.01%New York average:
0.01%
Top counties from which taxpayers relocated into this county between 2020 and 2021:
5.44% of this county's 2020 resident taxpayers moved to other counties in 2021 ($120,429 average adjusted gross income )
Here:
5.44%New York average:
6.93%
0.01% of residents moved to foreign countries ($114 average AGI )Nassau County:
0.01%New York average:
0.02%
Top counties to which taxpayers relocated from this county between 2020 and 2021:
Businesses in Hicksville, NY
Name Count Name Count
7-Eleven 8 Jones New York 1 AT&T 3 Journeys 1 Ace Hardware 1 Justice 1 Advance Auto Parts 1 Lowe's 1 Aeropostale 1 Macy's 1 American Eagle Outfitters 1 MasterBrand Cabinets 4 Applebee's 1 McDonald's 3 Arby's 1 Motherhood Maternity 1 Avenue 1 New Balance 2 Baskin-Robbins 3 New York & Co 1 Bath & Body Works 1 Nike 8 Blockbuster 1 Old Navy 1 Budget Car Rental 1 On The Border 1 CVS 2 Panera Bread 1 Charlotte Russe 1 Papa John's Pizza 1 Chevrolet 1 Payless 1 Chipotle 1 Penske 1 Chuck E. Cheese's 1 RadioShack 1 Decora Cabinetry 2 Red Lobster 1 Domino's Pizza 2 Sears 2 Dunkin Donuts 6 Spencer Gifts 1 Econo Lodge 1 Sprint Nextel 2 Express 1 Staples 1 Famous Footwear 1 Starbucks 2 FedEx 6 Stop & Shop 1 Foot Locker 1 Subaru 1 Forever 21 1 T.J.Maxx 1 Fredericks Of Hollywood 1 Taco Bell 2 GNC 1 Target 1 GameStop 3 Toys"R"Us 1 H&M 1 U-Haul 1 H&R Block 2 UPS 9 Hollister Co. 1 Vans 1 Hot Topic 1 Victoria's Secret 1 Hyundai 1 Volkswagen 1 IHOP 1 Walgreens 2 Johnny Rockets 1 Wendy's 1
Strongest AM radio stations in Hicksville:
WGSM (740 AM; 25 kW; HUNTINGTON, NY; Owner: K RADIO LICENSEE, INC.)
WFAN (660 AM; 50 kW; NEW YORK, NY; Owner: INFINITY BROADCASTING OPERATIONS, INC.)
WCBS (880 AM; 50 kW; NEW YORK, NY; Owner: INFINITY BROADCASTING OPERATIONS, INC.)
WHLI (1100 AM; daytime; 10 kW; HEMPSTEAD, NY)
WMCA (570 AM; 50 kW; NEW YORK, NY; Owner: SALEM MEDIA OF NEW YORK, LLC)
WOR (710 AM; 50 kW; NEW YORK, NY; Owner: BUCKLEY BROADCASTING CORPORATION)
WQEW (1560 AM; 50 kW; NEW YORK, NY; Owner: THE NEW YORK TIMES ELECTRONIC MEDIA COMPANY)
WABC (770 AM; 50 kW; NEW YORK, NY; Owner: WABC-AM RADIO, INC.)
WBBR (1130 AM; 50 kW; NEW YORK, NY; Owner: BLOOMBERG COMMUNICATIONS INC.)
WEPN (1050 AM; 50 kW; NEW YORK, NY; Owner: NEW YORK AM RADIO, LLC)
WINS (1010 AM; 50 kW; NEW YORK, NY; Owner: INFINITY BROADCASTING OPERATIONS, INC.)
WADO (1280 AM; 50 kW; NEW YORK, NY; Owner: WADO-AM LICENSE CORP.)
WLIB (1190 AM; 30 kW; NEW YORK, NY; Owner: ICBC BROADCAST HOLDINGS-NY, INC.)
Strongest FM radio stations in Hicksville:
WKWZ (88.5 FM; SYOSSET, NY; Owner: SYOSSET CENTRAL SCHOOL DISTRICT)
WPOB (88.5 FM; PLAINVIEW, NY; Owner: PLAINVIEW-OLD BETHPAGE CENT SCH DIST)
WHPC (90.3 FM; GARDEN CITY, NY; Owner: NASSAU COMMUNITY COLLEGE)
WLIR-FM (92.7 FM; GARDEN CITY, NY; Owner: JARAD BROADCASTING COMPANY INC.)
WKJY (98.3 FM; HEMPSTEAD, NY; Owner: LONG ISLAND BROADCASTING, INC.)
W217AF (91.3 FM; HUNTINGTON STATION, NY; Owner: SACRED HEART UNIVERSITY, INC.)
WKCR-FM (89.9 FM; NEW YORK, NY; Owner: TRUSTEES OF COLUMBIA UNIVERSITY IN NEW YORK)
WKTU (103.5 FM; LAKE SUCCESS, NY; Owner: AMFM RADIO LICENSES, LLC)
WCWP (88.1 FM; BROOKVILLE, NY; Owner: LONG ISLAND UNIVERSITY PUBLIC RADIO NETWORK)
WQCD (101.9 FM; NEW YORK, NY; Owner: EMMIS RADIO LICENSE CORPORATION)
WRHU (88.7 FM; HEMPSTEAD, NY; Owner: HOFSTRA UNIVERSITY)
WCAA (105.9 FM; NEWARK, NJ; Owner: WADO-AM LICENSE CORP. ("WADO"))
WBAI (99.5 FM; NEW YORK, NY; Owner: PACIFICA FOUNDATION, INC.)
WBLS (107.5 FM; NEW YORK, NY; Owner: ICBC BROADCAST HOLDINGS-NY, INC.)
WLTW (106.7 FM; NEW YORK, NY; Owner: AMFM NEW YORK LICENSES, LLC)
WQXR-FM (96.3 FM; NEW YORK, NY; Owner: THE NEW YORK TIMES ELECTRONIC MEDIA COMPANY)
WSKQ-FM (97.9 FM; NEW YORK, NY; Owner: WSKQ LICENSING, INC.)
WXRK (92.3 FM; NEW YORK, NY; Owner: INFINITY BROADCASTING OPERATIONS, INC.)
WAXQ (104.3 FM; NEW YORK, NY; Owner: AMFM NEW YORK LICENSES, LLC)
WHTZ (100.3 FM; NEWARK, NJ; Owner: AMFM RADIO LICENSES, L.L.C.)
TV broadcast stations around Hicksville:
WLIW (Channel 21; GARDEN CITY, NY; Owner: EDUCATIONAL BROADCASTING CORPORATION)
WNYW (Channel 5; NEW YORK, NY; Owner: FOX TELEVISION STATIONS, INC.)
WPXU-LP (Channel 38; AMITYVILLE, NY; Owner: PAXSON COMMUNICATIONS LPTV, INC.)
WLIG-LP (Channel 54; MINEOLA, NY; Owner: WLNY-TV, INC.)
WCBS-TV (Channel 2; NEW YORK, NY; Owner: CBS BROADCASTING INC.)
WABC-TV (Channel 7; NEW YORK, NY; Owner: AMERICAN BROADCASTING COMPANIES, INC)
WPIX (Channel 11; NEW YORK, NY; Owner: WPIX, INC.)
WWOR-TV (Channel 9; SECAUCUS, NJ; Owner: FOX TELEVISION STATIONS, INC.)
WXNY-LP (Channel 32; NEW YORK, NY; Owner: ISLAND BROADCASTING COMPANY)
W27CB (Channel 27; HEMPSTEAD, NY; Owner: K LICENSEE INC.)
WNJU (Channel 47; LINDEN, NJ; Owner: WNJU LICENSE CORPORATION)
WPXN-TV (Channel 31; NEW YORK, NY; Owner: PAXSON COMMUNICATIONS LICENSE COMPANY, LLC)
WFUT (Channel 68; NEWARK, NJ; Owner: UNIVISION NEW YORK LLC)
WNBC (Channel 4; NEW YORK, NY; Owner: NATIONAL BROADCASTING COMPANY, INC.)
WNET (Channel 13; NEWARK, NJ; Owner: EDUCATIONAL BROADCASTING CORPORATION)
WXTV (Channel 41; PATERSON, NJ; Owner: WXTV LICENSE PARTNERSHIP, G.P.)
WNYE-TV (Channel 25; NEW YORK, NY; Owner: NEW YORK CITY BOARD OF EDUCATION)
WKOB-LP (Channel 53; NEW YORK, NY; Owner: WKOB COMMUNICATIONS, INC.)
WEBR-CA (Channel 17; MANHATTAN, NY; Owner: K LICENSEE INC.)
WRNN-LP (Channel 57; NYACK, NY; Owner: LP NYACK LIMITED PARTNERSHIP)
W60AI (Channel 60; NEW YORK, NY; Owner: VENTANA TELEVISION, INC.)
W38CL (Channel 38; BRONX, NY; Owner: RENARD COMMUNICATIONS CORP.)
WNYX-LP (Channel 35; NEW YORK, NY; Owner: ISLAND BROADCASTING COMPANY)
W33BS (Channel 33; DARIEN, CT; Owner: CT&T BROADCASTING, INC.)
WNYN-LP (Channel 39; NEW YORK, NY; Owner: ISLAND BROADCASTING COMPANY)
National Bridge Inventory (NBI) Statistics 10 Number of bridges13ft / 4.1m Total length $8,565,000 Total costs253,731 Total average daily traffic129 Total average daily truck traffic
New bridges - historical statistics
2 1930-1939 2 1940-1949 5 1960-1969 1 1970-1979
See full National Bridge Inventory statistics for Hicksville, NY
Home Mortgage Disclosure Act Aggregated Statistics For Year 2009(Based on 7 full tracts) A) FHA, FSA/RHS & VA B) Conventional C) Refinancings D) Home Improvement Loans E) Loans on Dwellings For 5+ Families F) Non-occupant Loans on Number Average Value Number Average Value Number Average Value Number Average Value Number Average Value Number Average Value
LOANS ORIGINATED 73 $351,315 198 $296,566 434 $254,749 43 $167,884 2 $467,000 19 $223,263 APPLICATIONS APPROVED, NOT ACCEPTED 8 $323,125 29 $295,552 79 $271,203 9 $68,333 0 $0 4 $252,750 APPLICATIONS DENIED 12 $364,667 39 $282,077 232 $311,530 29 $108,931 0 $0 9 $195,556 APPLICATIONS WITHDRAWN 15 $367,733 17 $288,824 132 $294,424 12 $122,583 1 $203,000 5 $273,000 FILES CLOSED FOR INCOMPLETENESS 1 $340,000 14 $292,286 45 $326,533 3 $279,667 0 $0 2 $169,000
Aggregated Statistics For Year 2008(Based on 7 full tracts) A) FHA, FSA/RHS & VA B) Conventional C) Refinancings D) Home Improvement Loans F) Non-occupant Loans on Number Average Value Number Average Value Number Average Value Number Average Value Number Average Value
LOANS ORIGINATED 29 $397,897 216 $319,824 256 $255,707 65 $79,015 22 $254,182 APPLICATIONS APPROVED, NOT ACCEPTED 1 $406,000 58 $307,172 88 $280,784 15 $112,600 4 $236,250 APPLICATIONS DENIED 6 $436,833 108 $348,796 250 $308,224 93 $82,452 20 $251,200 APPLICATIONS WITHDRAWN 7 $331,286 25 $308,800 97 $284,412 10 $95,300 4 $205,250 FILES CLOSED FOR INCOMPLETENESS 4 $428,500 23 $339,609 30 $413,333 5 $65,000 1 $315,000
Aggregated Statistics For Year 2007(Based on 7 full tracts) A) FHA, FSA/RHS & VA B) Conventional C) Refinancings D) Home Improvement Loans E) Loans on Dwellings For 5+ Families F) Non-occupant Loans on G) Loans On Manufactured Number Average Value Number Average Value Number Average Value Number Average Value Number Average Value Number Average Value Number Average Value
LOANS ORIGINATED 4 $333,500 450 $290,027 486 $265,700 111 $131,631 1 $401,000 39 $312,615 1 $49,000 APPLICATIONS APPROVED, NOT ACCEPTED 1 $404,000 125 $295,392 119 $257,756 36 $90,000 0 $0 11 $349,455 0 $0 APPLICATIONS DENIED 1 $250,000 168 $326,863 340 $313,247 75 $121,173 0 $0 22 $340,364 0 $0 APPLICATIONS WITHDRAWN 0 $0 68 $287,500 133 $283,850 20 $139,000 0 $0 4 $226,000 0 $0 FILES CLOSED FOR INCOMPLETENESS 0 $0 29 $285,690 63 $306,349 7 $151,000 0 $0 1 $355,000 0 $0
Aggregated Statistics For Year 2006(Based on 7 full tracts) A) FHA, FSA/RHS & VA B) Conventional C) Refinancings D) Home Improvement Loans F) Non-occupant Loans on Number Average Value Number Average Value Number Average Value Number Average Value Number Average Value
LOANS ORIGINATED 1 $354,000 600 $279,967 668 $258,757 189 $114,333 61 $281,393 APPLICATIONS APPROVED, NOT ACCEPTED 0 $0 103 $260,835 154 $247,831 44 $74,545 10 $275,400 APPLICATIONS DENIED 0 $0 186 $304,984 371 $280,210 86 $107,965 23 $274,435 APPLICATIONS WITHDRAWN 0 $0 109 $304,294 288 $279,837 20 $140,200 26 $328,038 FILES CLOSED FOR INCOMPLETENESS 0 $0 32 $275,344 123 $309,846 11 $199,273 10 $272,100
Aggregated Statistics For Year 2005(Based on 7 full tracts) B) Conventional C) Refinancings D) Home Improvement Loans F) Non-occupant Loans on G) Loans On Manufactured Number Average Value Number Average Value Number Average Value Number Average Value Number Average Value
LOANS ORIGINATED 587 $298,121 740 $263,466 143 $117,301 70 $293,743 0 $0 APPLICATIONS APPROVED, NOT ACCEPTED 97 $276,093 129 $254,217 38 $94,342 12 $254,333 1 $5,000 APPLICATIONS DENIED 175 $299,657 341 $291,924 101 $110,139 26 $290,692 4 $246,000 APPLICATIONS WITHDRAWN 108 $284,435 329 $265,143 44 $183,614 16 $291,375 1 $205,000 FILES CLOSED FOR INCOMPLETENESS 48 $266,979 183 $293,219 13 $104,000 3 $312,667 0 $0
Aggregated Statistics For Year 2004(Based on 7 full tracts) A) FHA, FSA/RHS & VA B) Conventional C) Refinancings D) Home Improvement Loans E) Loans on Dwellings For 5+ Families F) Non-occupant Loans on G) Loans On Manufactured Number Average Value Number Average Value Number Average Value Number Average Value Number Average Value Number Average Value Number Average Value
LOANS ORIGINATED 2 $218,500 552 $289,455 893 $229,297 163 $99,865 1 $6,000,000 69 $249,855 2 $34,000 APPLICATIONS APPROVED, NOT ACCEPTED 1 $106,000 85 $311,329 168 $217,625 46 $87,087 0 $0 10 $255,500 0 $0 APPLICATIONS DENIED 0 $0 114 $300,018 262 $248,256 90 $84,344 1 $430,000 19 $263,579 1 $85,000 APPLICATIONS WITHDRAWN 0 $0 66 $286,621 357 $232,658 31 $112,419 0 $0 9 $257,222 0 $0 FILES CLOSED FOR INCOMPLETENESS 0 $0 32 $292,719 142 $273,014 10 $125,700 0 $0 3 $188,333 0 $0
Aggregated Statistics For Year 2003(Based on 7 full tracts) A) FHA, FSA/RHS & VA B) Conventional C) Refinancings D) Home Improvement Loans F) Non-occupant Loans on Number Average Value Number Average Value Number Average Value Number Average Value Number Average Value
LOANS ORIGINATED 9 $229,000 481 $268,380 1,843 $190,795 88 $69,955 95 $215,558 APPLICATIONS APPROVED, NOT ACCEPTED 0 $0 72 $275,917 367 $197,518 28 $82,857 15 $243,400 APPLICATIONS DENIED 1 $285,000 97 $264,402 453 $209,722 90 $56,311 34 $210,735 APPLICATIONS WITHDRAWN 2 $127,500 47 $267,447 499 $207,749 34 $56,412 10 $254,300 FILES CLOSED FOR INCOMPLETENESS 1 $193,000 29 $251,483 102 $208,647 7 $72,857 4 $136,750
Aggregated Statistics For Year 2002(Based on 7 full tracts) A) FHA, FSA/RHS & VA B) Conventional C) Refinancings D) Home Improvement Loans E) Loans on Dwellings For 5+ Families F) Non-occupant Loans on Number Average Value Number Average Value Number Average Value Number Average Value Number Average Value Number Average Value
LOANS ORIGINATED 7 $239,286 476 $233,645 1,254 $173,351 122 $58,434 0 $0 52 $173,750 APPLICATIONS APPROVED, NOT ACCEPTED 1 $150,000 78 $231,013 254 $173,031 37 $44,324 0 $0 4 $151,750 APPLICATIONS DENIED 0 $0 64 $243,906 337 $176,220 58 $64,517 1 $195,000 10 $157,400 APPLICATIONS WITHDRAWN 3 $229,000 56 $245,268 370 $168,246 51 $51,059 1 $225,000 7 $183,429 FILES CLOSED FOR INCOMPLETENESS 0 $0 18 $229,500 98 $174,786 8 $61,750 0 $0 4 $179,000
Aggregated Statistics For Year 2001(Based on 7 full tracts) A) FHA, FSA/RHS & VA B) Conventional C) Refinancings D) Home Improvement Loans F) Non-occupant Loans on Number Average Value Number Average Value Number Average Value Number Average Value Number Average Value
LOANS ORIGINATED 26 $214,846 410 $203,980 1,003 $153,463 124 $52,597 32 $165,062 APPLICATIONS APPROVED, NOT ACCEPTED 1 $361,000 49 $198,041 235 $131,694 38 $48,105 13 $178,846 APPLICATIONS DENIED 0 $0 54 $209,333 300 $141,123 65 $44,169 20 $211,250 APPLICATIONS WITHDRAWN 0 $0 47 $204,617 250 $144,064 68 $46,074 6 $122,000 FILES CLOSED FOR INCOMPLETENESS 0 $0 10 $213,100 64 $162,359 8 $49,375 0 $0
Aggregated Statistics For Year 2000(Based on 7 full tracts) A) FHA, FSA/RHS & VA B) Conventional C) Refinancings D) Home Improvement Loans F) Non-occupant Loans on Number Average Value Number Average Value Number Average Value Number Average Value Number Average Value
LOANS ORIGINATED 23 $197,826 402 $180,296 302 $112,894 117 $43,513 31 $112,871 APPLICATIONS APPROVED, NOT ACCEPTED 2 $193,000 51 $182,471 82 $115,549 61 $39,164 5 $232,600 APPLICATIONS DENIED 4 $184,000 84 $189,405 202 $117,129 74 $43,257 15 $128,533 APPLICATIONS WITHDRAWN 6 $172,500 29 $177,690 231 $152,203 33 $42,879 8 $136,375 FILES CLOSED FOR INCOMPLETENESS 1 $180,000 12 $168,417 43 $174,256 8 $53,125 5 $159,200
Aggregated Statistics For Year 1999(Based on 7 full tracts) A) FHA, FSA/RHS & VA B) Conventional C) Refinancings D) Home Improvement Loans F) Non-occupant Loans on Number Average Value Number Average Value Number Average Value Number Average Value Number Average Value
LOANS ORIGINATED 25 $177,815 372 $158,016 549 $115,066 126 $31,676 28 $117,674 APPLICATIONS APPROVED, NOT ACCEPTED 2 $173,525 35 $169,883 134 $111,041 35 $30,047 10 $179,719 APPLICATIONS DENIED 3 $189,763 54 $169,311 220 $98,021 83 $36,845 10 $115,830 APPLICATIONS WITHDRAWN 6 $166,108 35 $164,039 198 $104,672 43 $66,341 5 $131,574 FILES CLOSED FOR INCOMPLETENESS 2 $151,710 21 $157,495 50 $139,401 5 $38,590 3 $120,207
Detailed HMDA statistics for the following Tracts:
5189.00
, 5190.00 , 5191.00 , 5192.00 , 5193.00 , 5194.00 , 5195.00
Private Mortgage Insurance Companies Aggregated Statistics For Year 2009(Based on 7 full tracts) A) Conventional B) Refinancings Number Average Value Number Average Value
LOANS ORIGINATED 39 $337,128 12 $339,333 APPLICATIONS APPROVED, NOT ACCEPTED 19 $319,158 8 $386,500 APPLICATIONS DENIED 6 $398,667 8 $340,250 APPLICATIONS WITHDRAWN 9 $350,222 4 $345,250 FILES CLOSED FOR INCOMPLETENESS 3 $297,000 0 $0
Aggregated Statistics For Year 2008(Based on 7 full tracts) A) Conventional B) Refinancings C) Non-occupant Loans on Number Average Value Number Average Value Number Average Value
LOANS ORIGINATED 69 $362,000 19 $377,053 3 $324,000 APPLICATIONS APPROVED, NOT ACCEPTED 37 $395,162 16 $444,062 3 $292,333 APPLICATIONS DENIED 19 $338,526 5 $394,000 5 $372,000 APPLICATIONS WITHDRAWN 3 $423,333 1 $480,000 0 $0 FILES CLOSED FOR INCOMPLETENESS 2 $365,500 3 $390,667 0 $0
Aggregated Statistics For Year 2007(Based on 7 full tracts) A) Conventional B) Refinancings C) Non-occupant Loans on Number Average Value Number Average Value Number Average Value
LOANS ORIGINATED 61 $394,459 21 $427,048 4 $333,000 APPLICATIONS APPROVED, NOT ACCEPTED 12 $400,333 4 $441,500 2 $333,000 APPLICATIONS DENIED 3 $457,667 0 $0 0 $0 APPLICATIONS WITHDRAWN 3 $384,333 1 $378,000 0 $0 FILES CLOSED FOR INCOMPLETENESS 0 $0 0 $0 0 $0
Aggregated Statistics For Year 2006(Based on 7 full tracts) A) Conventional B) Refinancings C) Non-occupant Loans on Number Average Value Number Average Value Number Average Value
LOANS ORIGINATED 22 $372,727 2 $386,000 0 $0 APPLICATIONS APPROVED, NOT ACCEPTED 9 $406,111 5 $412,400 1 $405,000 APPLICATIONS DENIED 0 $0 0 $0 0 $0 APPLICATIONS WITHDRAWN 5 $336,600 1 $410,000 1 $313,000 FILES CLOSED FOR INCOMPLETENESS 0 $0 0 $0 0 $0
Aggregated Statistics For Year 2005(Based on 7 full tracts) A) Conventional B) Refinancings C) Non-occupant Loans on Number Average Value Number Average Value Number Average Value
LOANS ORIGINATED 40 $366,550 8 $396,750 4 $344,250 APPLICATIONS APPROVED, NOT ACCEPTED 14 $431,929 1 $427,000 1 $383,000 APPLICATIONS DENIED 1 $310,000 0 $0 0 $0 APPLICATIONS WITHDRAWN 1 $360,000 2 $378,000 0 $0 FILES CLOSED FOR INCOMPLETENESS 0 $0 0 $0 0 $0
Aggregated Statistics For Year 2004(Based on 7 full tracts) A) Conventional B) Refinancings C) Non-occupant Loans on Number Average Value Number Average Value Number Average Value
LOANS ORIGINATED 68 $326,662 8 $330,125 2 $328,000 APPLICATIONS APPROVED, NOT ACCEPTED 26 $326,115 6 $318,667 2 $338,000 APPLICATIONS DENIED 1 $352,000 1 $353,000 2 $352,500 APPLICATIONS WITHDRAWN 11 $326,818 0 $0 1 $212,000 FILES CLOSED FOR INCOMPLETENESS 0 $0 1 $322,000 0 $0
Aggregated Statistics For Year 2003(Based on 7 full tracts) A) Conventional B) Refinancings C) Non-occupant Loans on Number Average Value Number Average Value Number Average Value
LOANS ORIGINATED 110 $300,164 34 $276,676 4 $262,500 APPLICATIONS APPROVED, NOT ACCEPTED 39 $299,667 16 $273,188 2 $184,000 APPLICATIONS DENIED 2 $356,500 3 $327,667 0 $0 APPLICATIONS WITHDRAWN 11 $340,000 2 $291,000 1 $384,000 FILES CLOSED FOR INCOMPLETENESS 0 $0 1 $360,000 0 $0
Aggregated Statistics For Year 2002(Based on 7 full tracts) A) Conventional B) Refinancings C) Non-occupant Loans on Number Average Value Number Average Value Number Average Value
LOANS ORIGINATED 128 $264,938 24 $258,208 3 $208,667 APPLICATIONS APPROVED, NOT ACCEPTED 54 $252,519 20 $239,000 2 $160,500 APPLICATIONS DENIED 1 $249,000 0 $0 0 $0 APPLICATIONS WITHDRAWN 10 $249,300 9 $237,333 1 $353,000 FILES CLOSED FOR INCOMPLETENESS 1 $230,000 0 $0 0 $0
Aggregated Statistics For Year 2001(Based on 7 full tracts) A) Conventional B) Refinancings C) Non-occupant Loans on Number Average Value Number Average Value Number Average Value
LOANS ORIGINATED 144 $229,257 35 $223,629 3 $238,667 APPLICATIONS APPROVED, NOT ACCEPTED 40 $217,275 18 $232,278 2 $232,000 APPLICATIONS DENIED 4 $278,750 2 $224,500 0 $0 APPLICATIONS WITHDRAWN 1 $171,000 8 $252,000 0 $0 FILES CLOSED FOR INCOMPLETENESS 1 $238,000 0 $0 0 $0
Aggregated Statistics For Year 2000(Based on 7 full tracts) A) Conventional B) Refinancings C) Non-occupant Loans on Number Average Value Number Average Value Number Average Value
LOANS ORIGINATED 126 $203,619 15 $214,933 3 $188,333 APPLICATIONS APPROVED, NOT ACCEPTED 31 $198,710 2 $188,500 0 $0 APPLICATIONS DENIED 5 $202,200 2 $183,000 0 $0 APPLICATIONS WITHDRAWN 6 $202,333 0 $0 0 $0 FILES CLOSED FOR INCOMPLETENESS 0 $0 0 $0 0 $0
Aggregated Statistics For Year 1999(Based on 7 full tracts) A) Conventional B) Refinancings C) Non-occupant Loans on Number Average Value Number Average Value Number Average Value
LOANS ORIGINATED 142 $175,887 31 $164,429 3 $137,727 APPLICATIONS APPROVED, NOT ACCEPTED 16 $166,384 8 $159,654 0 $0 APPLICATIONS DENIED 9 $175,037 0 $0 1 $184,570 APPLICATIONS WITHDRAWN 5 $202,432 0 $0 0 $0 FILES CLOSED FOR INCOMPLETENESS 1 $201,000 1 $161,250 0 $0
Detailed PMIC statistics for the following Tracts:
5189.00
, 5190.00 , 5191.00 , 5192.00 , 5193.00 , 5194.00 , 5195.00
Most common first names in Hicksville, NY among deceased individuals Name Count Lived (average)
John 437 74.1 years Mary 320 79.7 years William 307 72.8 years Joseph 299 73.6 years James 208 70.7 years Anna 188 80.7 years Margaret 184 78.6 years Frank 159 75.9 years Robert 156 68.8 years George 155 75.2 years
Most common last names in Hicksville, NY among deceased individuals Last name Count Lived (average)
Smith 52 76.9 years Kelly 34 72.3 years Miller 30 72.9 years Klein 20 73.8 years Murray 19 71.7 years Obrien 19 71.8 years Collins 19 75.4 years Reilly 18 83.0 years Murphy 18 70.3 years Cohen 18 76.0 years
Hicksville compared to New York state average:
Median household income above state average. Median house value above state average. Unemployed percentage significantly below state average. Black race population percentage significantly below state average. Foreign-born population percentage above state average. Renting percentage significantly below state average. Length of stay since moving in significantly above state average. Number of rooms per house above state average. Percentage of population with a bachelor's degree or higher above state average. Hicksville on our top lists :
#1 on the list of "Top 101 cities where residents moved in more then 10 years ago (10,000+ households)"
#9 on the list of "Top 101 cities with the largest racial income disparity between any two races with at least 200 householders"
#15 on the list of "Top 101 cities with the most residents born in Afghanistan (population 500+)"
#65 on the list of "Top 101 cities with the most residents born in South Central Asia (population 500+)"
#84 on the list of "Top 101 cities with the most residents born in India (population 500+)"
#46 (11791) on the list of "Top 101 zip codes with the largest percentage of Greek first ancestries (pop 5,000+)"
#64 (11791) on the list of "Top 101 zip codes with the largest percentage of taxpayers reporting taxable interest in 2012 (pop 5,000+)"
#93 (11791) on the list of "Top 101 zip codes with the largest percentage of Russian first ancestries (pop 5,000+)"
#8 on the list of "Top 101 counties with the most Orthodox adherents"
#9 on the list of "Top 101 counties with the most Catholic adherents"
#11 on the list of "Top 101 counties with the lowest percentage of residents that keep firearms around their homes"
#13 on the list of "Top 101 counties with the highest ground withdrawal of fresh water for public supply"
#13 on the list of "Top 101 counties with the most Orthodox congregations"
Top Patent Applicants
Zafar Ali (14)
Parijat Dube (13)
Kalpendu R. Pasad (8)
Clive S. Lu (7)
Anthony L. Scoca (5)
Syed Zaki Hossain (4)
Michelle Hyers (3)
Robert A. Quan (3)
Andrew Pappas (3)
Joseph Georgiano (3)
Total of 134 patent applications in 2008-2024.

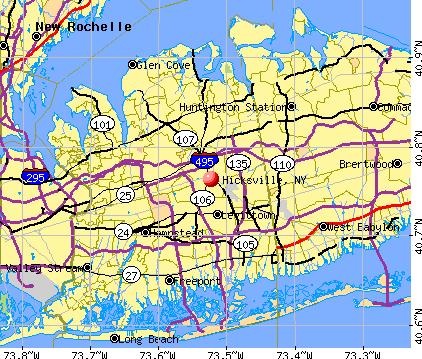


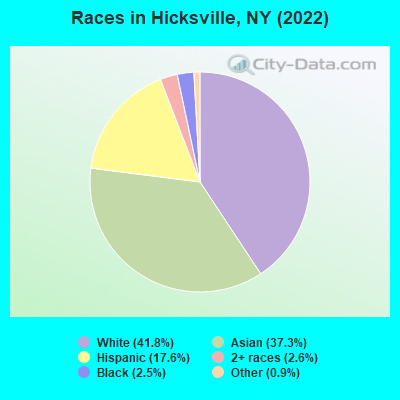
 Recent articles from our blog. Our writers, many of them Ph.D. graduates or candidates, create easy-to-read articles on a wide variety of topics.


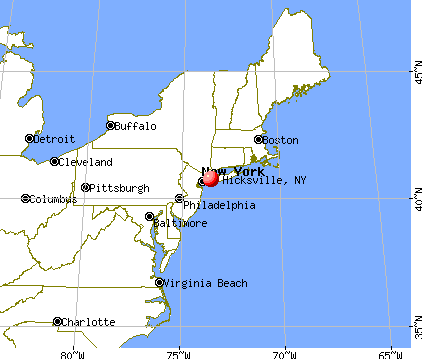
 (2.8 miles
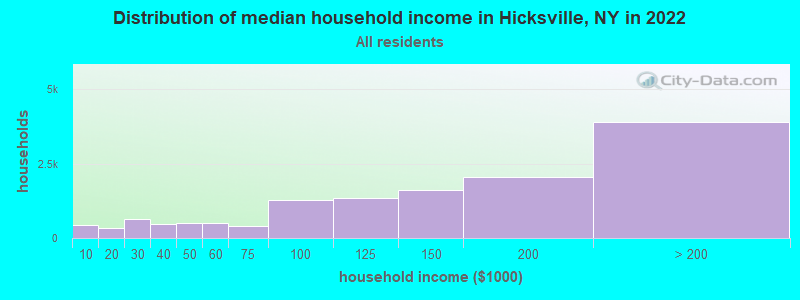
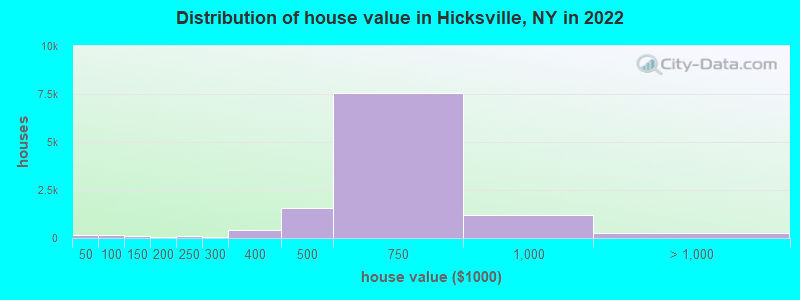
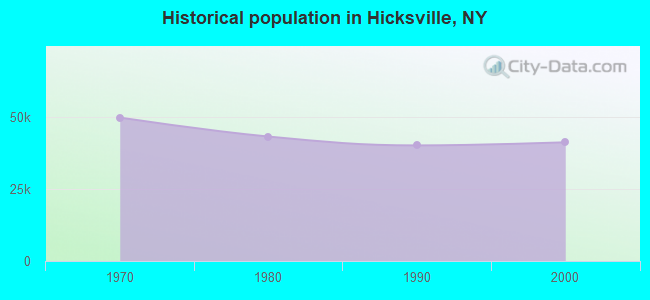
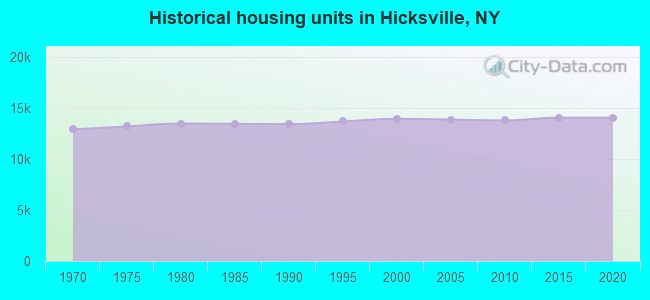
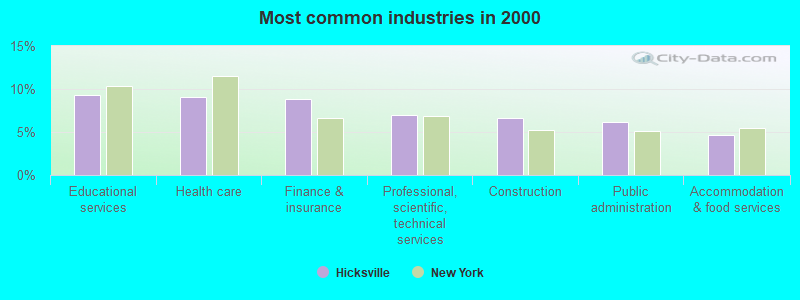
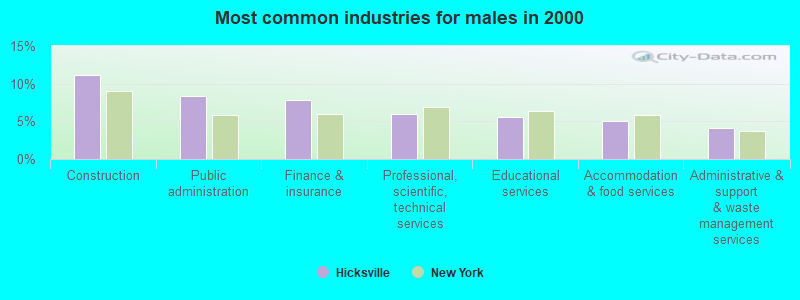
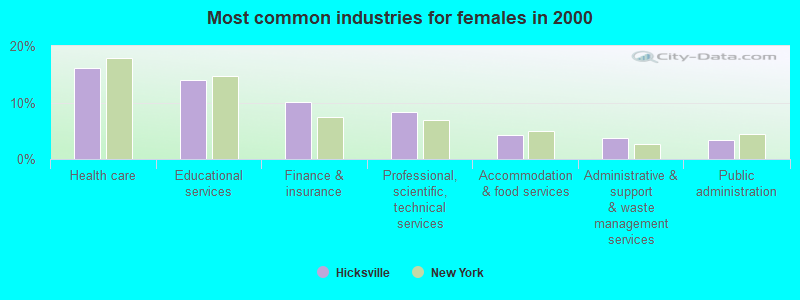
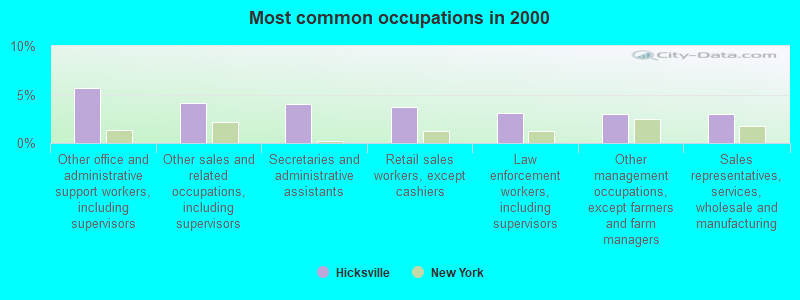
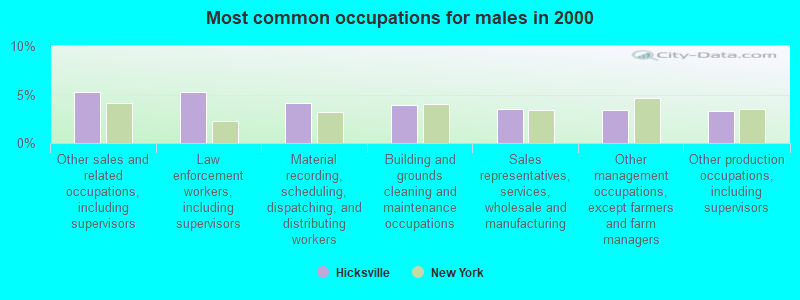
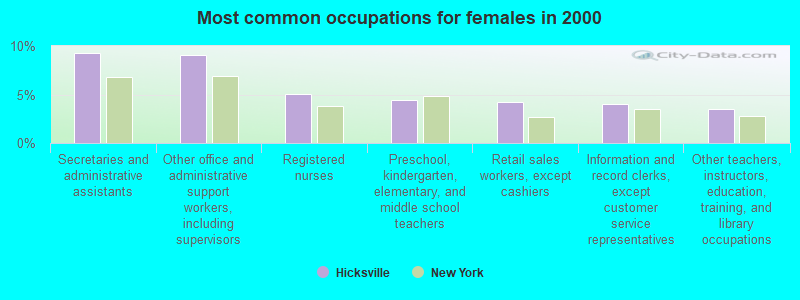
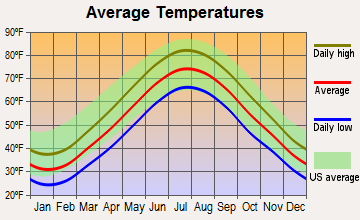
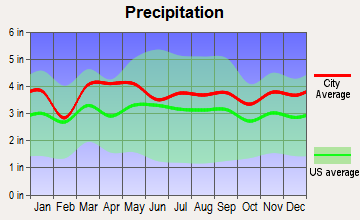
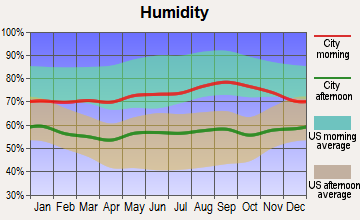
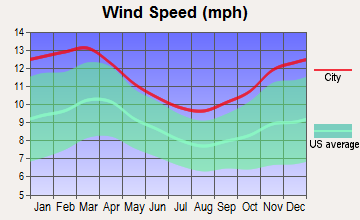
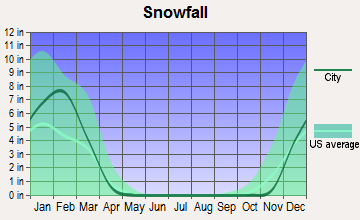
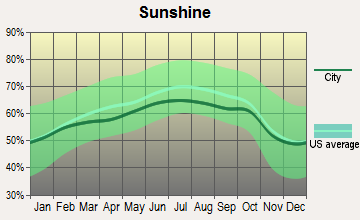
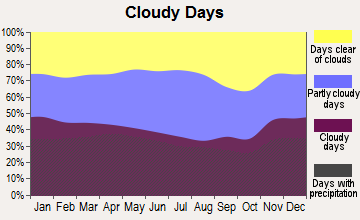


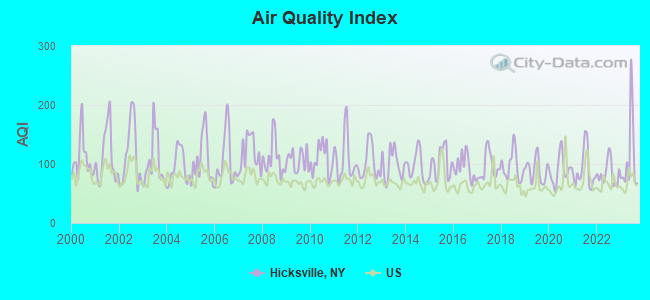
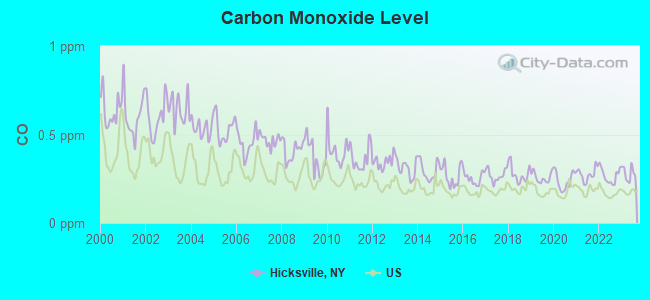
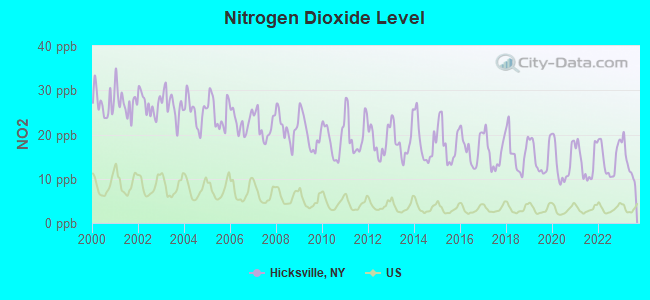
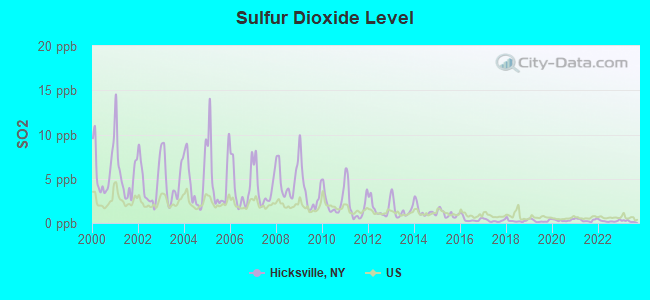
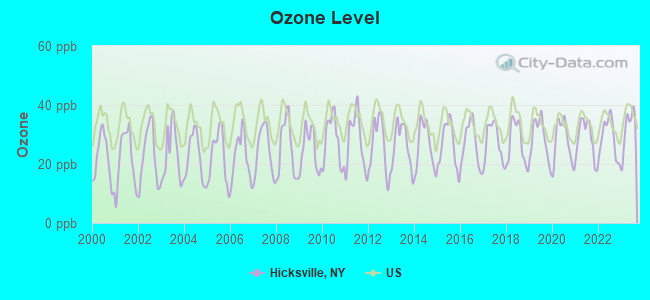
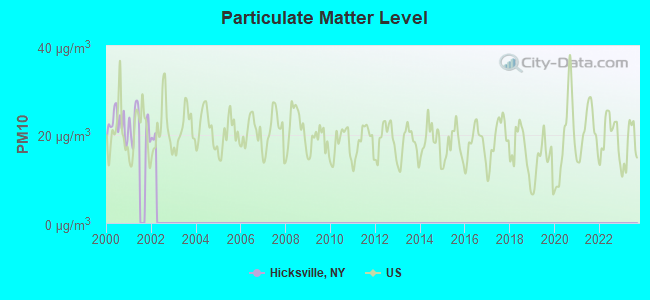
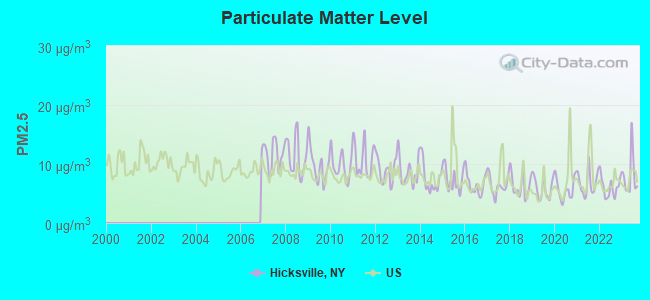
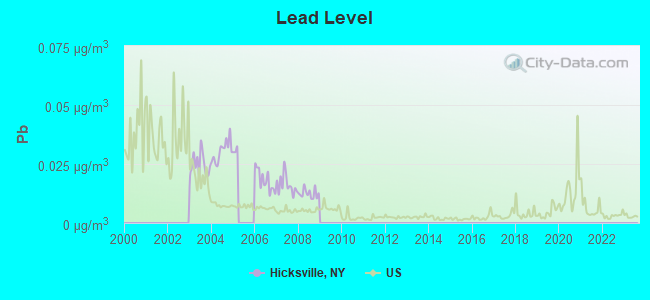
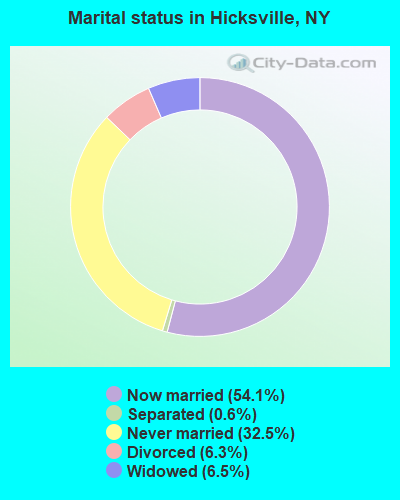
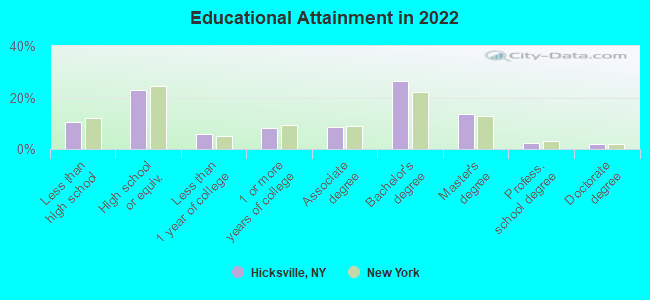
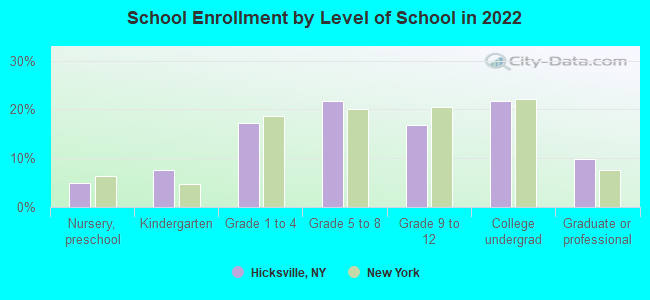
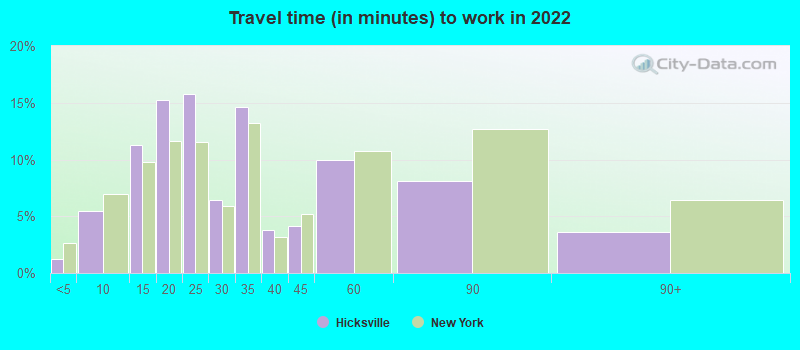
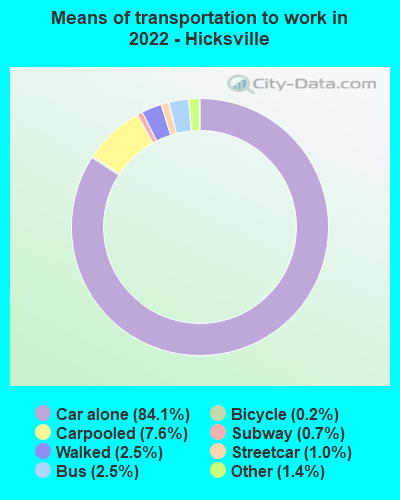
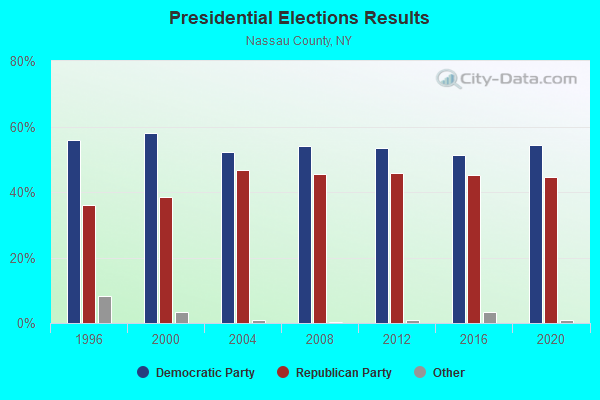
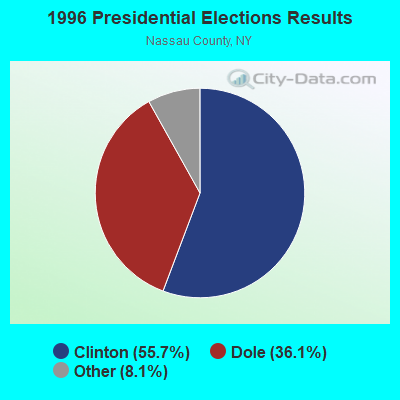
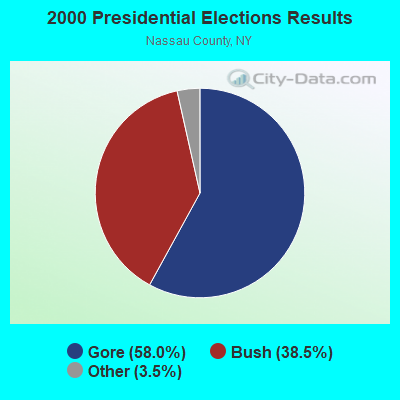
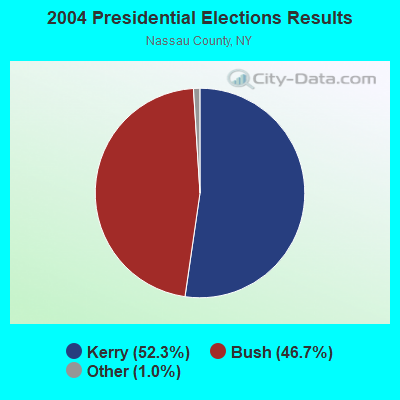
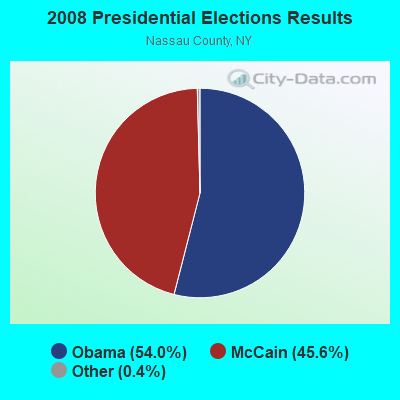
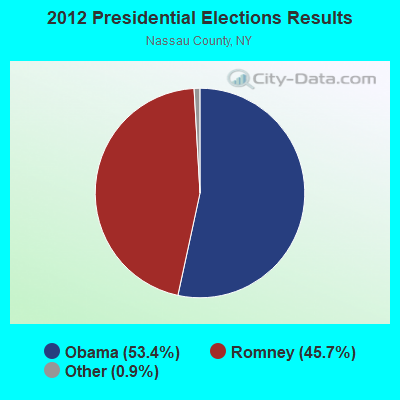
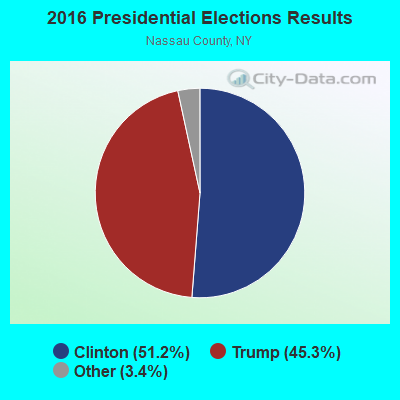
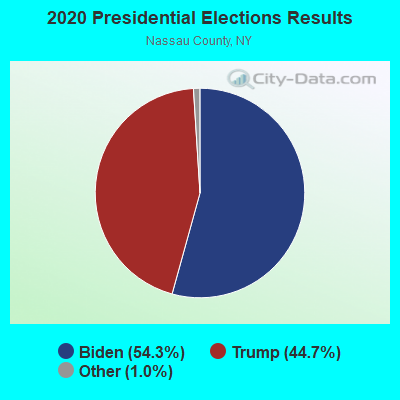
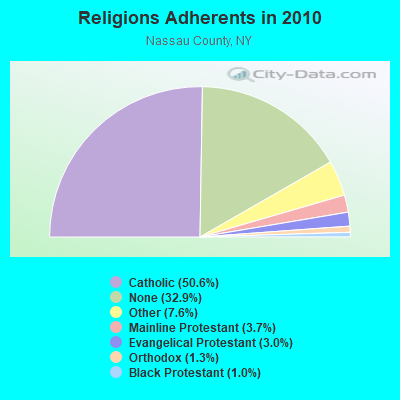
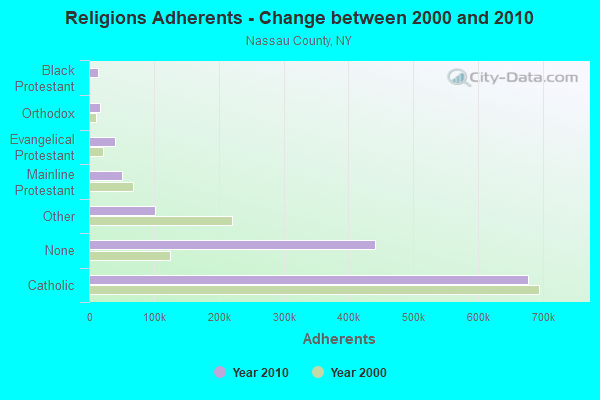
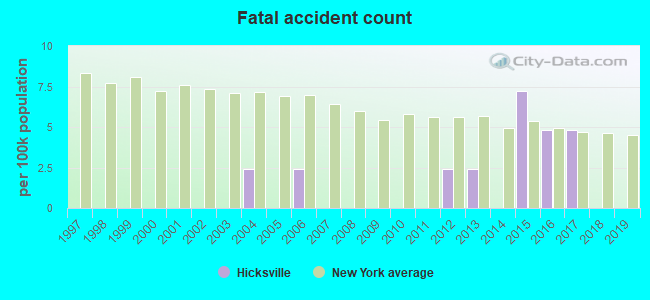
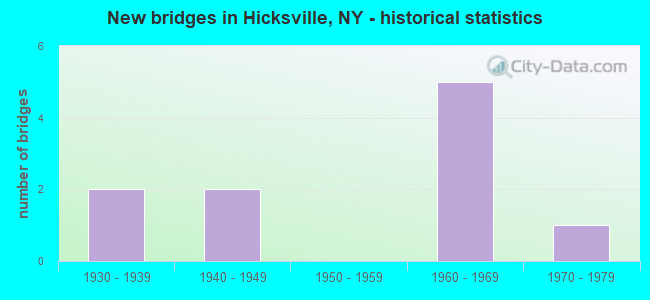
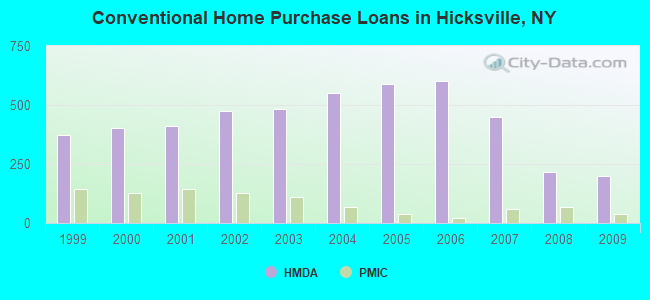
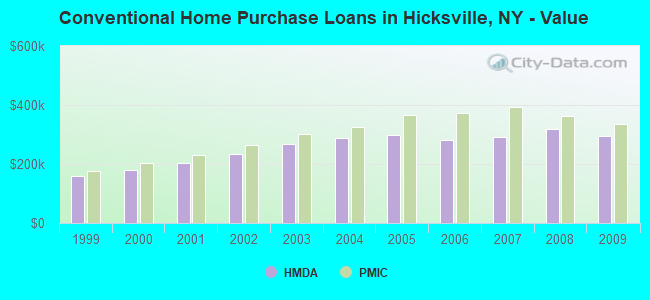
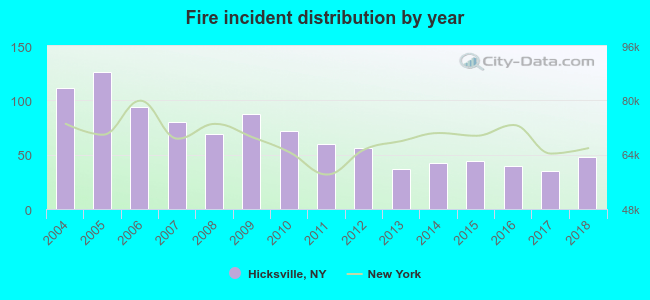 Based on the data from the years 2004 - 2018 the average number of fire incidents per year is 67. The highest number of fire incidents - 126 took place in 2005, and the least - 35 in 2017. The data has a dropping trend.
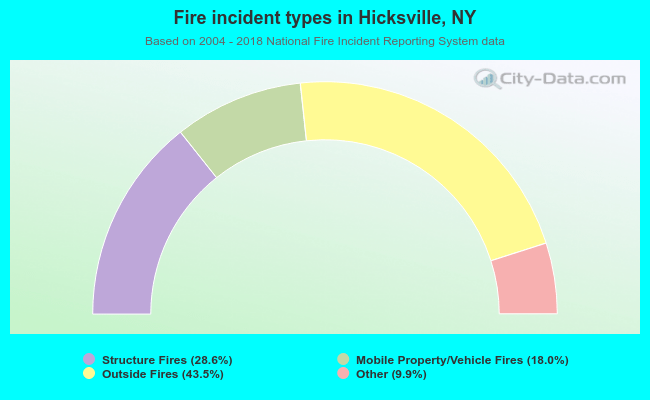 When looking into fire subcategories, the most reports belonged to: Outside Fires (43.5%), and Structure Fires (28.6%).