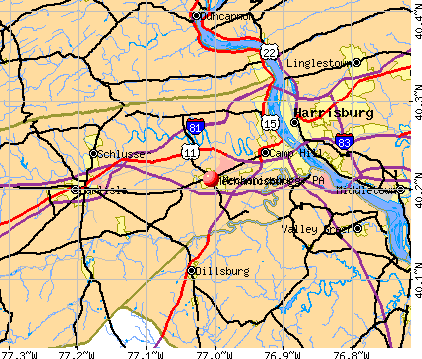
Mechanicsburg, Pennsylvania
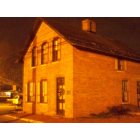
Mechanicsburg: This two-story building, listed on the National Register of Historic Places, was built in 1863 for $5,044 by the Cumberland Valley Railroad for stationmaster George Zacharias and his family.
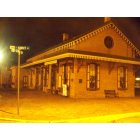
Mechanicsburg: The Cumberland Valley Railroad was originally incorporated on April 2, 1831. The railroad was finished within a half mile of Harrisburg and within one mile of Carlisle by August 1837. Adam Riegel, Henry Ford and Lewis Zearing of Mechanicsburg and nine other men acted as commissioners and took subscriptions for stock at $50 a share.
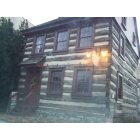
Mechanicsburg: One of Mechanicsburg's first residents was George Frankeberger, who in 1801 applied for a license to open his newly built log home for the "convenience" of travelers. In exchange for a small fee, Mr. Frankeberger offered cattle drovers a warm meal and a place to sleep. The tavern has a rustic charm that transports visitors back in time.
- add
your


Submit your own pictures of this borough and show them to the world
- OSM Map
- General Map
- Google Map
- MSN Map
Population change since 2000: +6.5%
 |
| Males: 5,172 | |
| Females: 4,462 |
| Median resident age: | 37.5 years |
| Pennsylvania median age: | 40.9 years |
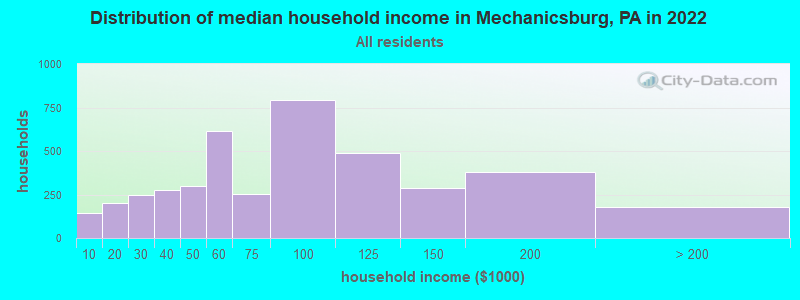
| Mechanicsburg: | $74,046 |
| PA: | $71,798 |
Estimated per capita income in 2022: $40,247 (it was $22,812 in 2000)
Mechanicsburg borough income, earnings, and wages data
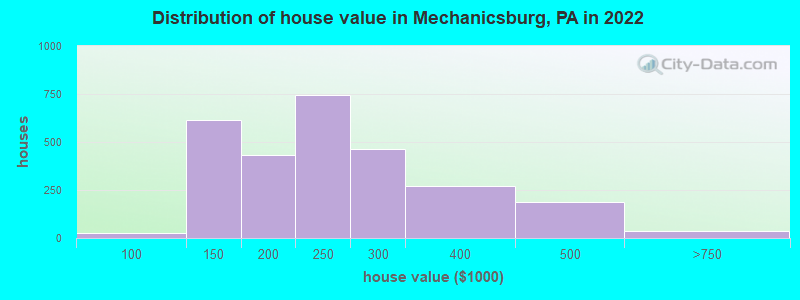
Estimated median house or condo value in 2022: $227,826 (it was $109,600 in 2000)
| Mechanicsburg: | $227,826 |
| PA: | $245,500 |
Mean prices in 2022: all housing units: $301,412; detached houses: $330,280; townhouses or other attached units: $225,259; in 2-unit structures: $188,903; in 3-to-4-unit structures: $125,870; in 5-or-more-unit structures: $430,522; mobile homes: $48,821
Median gross rent in 2022: $1,004.
(4.6% for White Non-Hispanic residents, 20.4% for Hispanic or Latino residents)
Detailed information about poverty and poor residents in Mechanicsburg, PA

Compare current foreclosures in Mechanicsburg, PA:
| Photo | Address | Area | Beds / Baths | Price | Details |
|---|---|---|---|---|---|

|
#1
Apple Dr
Mechanicsburg, PA 17055
|
1,610 sq. feet
|
2 baths 4 beds |
show details | |

|
#2
Nixon Dr
Mechanicsburg, PA 17055
|
2,020 sq. feet
|
1 baths 3 beds |
show details | |

|
#3
Rye Cir
Mechanicsburg, PA 17055
|
2,006 sq. feet
|
- baths - beds |
show details | |

|
#4
Hemlock Dr
Mechanicsburg, PA 17055
|
2,170 sq. feet
|
- baths - beds |
show details | |

|
#5
Apple Cir Apt 188
Mechanicsburg, PA 17055
|
- sq. feet
|
- baths - beds |
show details | |

|
#6
Mallard Ct
Mechanicsburg, PA 17055
|
- sq. feet
|
- baths - beds |
show details | |

|
#7
John King Ln
Mechanicsburg, PA 17050
|
- sq. feet
|
- baths - beds |
show details | |

|
#8
Adeline Dr
Mechanicsburg, PA 17050
|
4,911 sq. feet
|
- baths - beds |
show details | |

|
#9
W Keller St
Mechanicsburg, PA 17055
|
- sq. feet
|
- baths - beds |
show details | |

|
#10
Nantucket Dr
Mechanicsburg, PA 17050
|
- sq. feet
|
- baths - beds |
show details |
| Photo | Address | Area | Beds / Baths | Price | Details |
|---|---|---|---|---|---|

|
#11
Garden Dr
Mechanicsburg, PA 17055
|
- sq. feet
|
- baths - beds |
show details | |

|
#12
Warwick Cir
Mechanicsburg, PA 17050
|
- sq. feet
|
- baths - beds |
show details | |

|
#13
Allenview Dr
Mechanicsburg, PA 17055
|
1,152 sq. feet
|
- baths - beds |
show details | |

|
#14
Stonehedge Ln
Mechanicsburg, PA 17055
|
1,540 sq. feet
|
- baths - beds |
show details | |

|
#15
Brook Cir
Mechanicsburg, PA 17050
|
- sq. feet
|
- baths - beds |
show details | |

|
#16
S Sporting Hill Rd
Mechanicsburg, PA 17050
|
- sq. feet
|
- baths - beds |
show details | |

|
#17
Hogestown Rd
Mechanicsburg, PA 17050
|
1,328 sq. feet
|
- baths - beds |
show details | |

|
#18
Ellesmere Ln
Mechanicsburg, PA 17055
|
- sq. feet
|
- baths - beds |
show details | |

|
#19
Carmella Dr
Mechanicsburg, PA 17050
|
- sq. feet
|
- baths - beds |
show details | |

|
#20
Allenview Dr
Mechanicsburg, PA 17055
|
1,152 sq. feet
|
- baths - beds |
show details |
| Photo | Address | Area | Beds / Baths | Price | Details |
|---|---|---|---|---|---|

|
#21
Franklin Ave
Mechanicsburg, PA 17050
|
1,520 sq. feet
|
- baths - beds |
show details | |

|
#22
White Birch Ave
Mechanicsburg, PA 17050
|
1,120 sq. feet
|
- baths - beds |
show details | |

|
#23
Allenview Dr
Mechanicsburg, PA 17055
|
1,360 sq. feet
|
- baths - beds |
show details | |

|
#24
Mountain View Rd
Mechanicsburg, PA 17050
|
1,914 sq. feet
|
- baths - beds |
show details | |

|
#25
Independence Ct
Mechanicsburg, PA 17050
|
- sq. feet
|
- baths - beds |
show details | |

|
#26
Pinnacle Ridge Dr, Apt 204
Mechanicsburg, PA 17055
|
- sq. feet
|
- baths - beds |
show details | |

|
#27
Allenview Dr
Mechanicsburg, PA 17055
|
1,088 sq. feet
|
- baths - beds |
show details | |

|
#28
W Simpson St
Mechanicsburg, PA 17055
|
1,640 sq. feet
|
- baths - beds |
show details | |

|
#29
York Cir
Mechanicsburg, PA 17050
|
1,725 sq. feet
|
- baths - beds |
show details | |

|
#30
Stonehedge Ln
Mechanicsburg, PA 17055
|
1,540 sq. feet
|
- baths - beds |
show details |
| Photo | Address | Area | Beds / Baths | Price | Details |
|---|---|---|---|---|---|

|
#31
Valley View Dr
Mechanicsburg, PA 17050
|
1,690 sq. feet
|
- baths - beds |
show details | |

|
#32
S Market St
Mechanicsburg, PA 17055
|
1,169 sq. feet
|
- baths - beds |
show details | |

|
#33
W Schoolside Dr
Mechanicsburg, PA 17055
|
2,256 sq. feet
|
- baths - beds |
show details | |

|
#34
S Market St
Mechanicsburg, PA 17055
|
2,525 sq. feet
|
- baths - beds |
show details | |

|
#35
Melbourne Ln
Mechanicsburg, PA 17055
|
- sq. feet
|
- baths - beds |
show details | |

|
#36
Line Rd
Mechanicsburg, PA 17050
|
- sq. feet
|
- baths - beds |
show details | |

|
#37
Peace Dr
Mechanicsburg, PA 17055
|
2,592 sq. feet
|
- baths - beds |
show details | |

|
#38
E Coover St
Mechanicsburg, PA 17055
|
1,860 sq. feet
|
- baths - beds |
show details | |

|
#39
Admirals Quay Dr
Mechanicsburg, PA 17050
|
- sq. feet
|
- baths - beds |
show details | |

|
#40
Lucinda Ln
Mechanicsburg, PA 17055
|
3,474 sq. feet
|
- baths - beds |
show details |
| Photo | Address | Area | Beds / Baths | Price | Details |
|---|---|---|---|---|---|

|
#41
Berkshire Rd
Mechanicsburg, PA 17055
|
1,456 sq. feet
|
- baths - beds |
show details | |

|
#42
Cedar Ridge Ln
Mechanicsburg, PA 17055
|
1,576 sq. feet
|
- baths - beds |
show details | |

|
#43
State Rd
Mechanicsburg, PA 17050
|
- sq. feet
|
- baths - beds |
show details | |

|
#44
Kim Acres Dr
Mechanicsburg, PA 17055
|
1,792 sq. feet
|
- baths - beds |
show details | |

|
#45
Joshua Rd
Mechanicsburg, PA 17050
|
3,332 sq. feet
|
- baths - beds |
show details | |

|
#46
Grandon Way
Mechanicsburg, PA 17050
|
2,761 sq. feet
|
- baths - beds |
show details | |

|
#47
Thompson Ln
Mechanicsburg, PA 17055
|
- sq. feet
|
- baths - beds |
show details | |

|
#48
Mountain View Rd
Mechanicsburg, PA 17050
|
- sq. feet
|
- baths - beds |
show details | |

|
#49
Ellesmere Ln
Mechanicsburg, PA 17055
|
- sq. feet
|
- baths - beds |
show details | |

|
Check over 1 million property listings on Foreclosure.com!
|
browse all offers | |||


- 7,99282.7%White alone
- 6556.8%Two or more races
- 6436.7%Hispanic
- 1952.0%Black alone
- 1431.5%Asian alone
- 1341.4%Other race alone
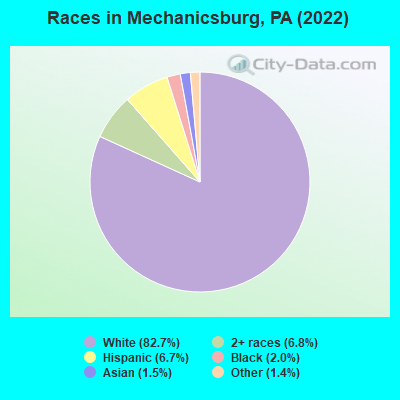
Races in Mechanicsburg detailed stats: ancestries, foreign born residents, place of birth
According to our research of Pennsylvania and other state lists, there were 55 registered sex offenders living in Mechanicsburg, Pennsylvania as of May 21, 2024.
The ratio of all residents to sex offenders in Mechanicsburg is 163 to 1.
Type |
2009 |
2010 |
2011 |
2012 |
2013 |
2014 |
2015 |
2016 |
2017 |
2018 |
2019 |
2020 |
2021 |
2022 |
|---|---|---|---|---|---|---|---|---|---|---|---|---|---|---|
| Murders (per 100,000) | 0 (0.0) | 0 (0.0) | 0 (0.0) | 0 (0.0) | 0 (0.0) | 0 (0.0) | 0 (0.0) | 0 (0.0) | 0 (0.0) | 0 (0.0) | 0 (0.0) | 0 (0.0) | 0 (0.0) | 0 (0.0) |
| Rapes (per 100,000) | 0 (0.0) | 2 (22.3) | 0 (0.0) | 0 (0.0) | 2 (22.3) | 1 (11.1) | 0 (0.0) | 0 (0.0) | 0 (0.0) | 4 (44.3) | 5 (55.6) | 0 (0.0) | 1 (11.1) | 0 (0.0) |
| Robberies (per 100,000) | 4 (46.0) | 1 (11.1) | 6 (66.6) | 4 (44.2) | 6 (66.9) | 4 (44.5) | 6 (66.9) | 2 (22.2) | 4 (44.4) | 3 (33.3) | 1 (11.1) | 4 (44.5) | 0 (0.0) | 0 (0.0) |
| Assaults (per 100,000) | 50 (575.5) | 30 (334.0) | 51 (566.0) | 1 (11.0) | 2 (22.3) | 2 (22.3) | 9 (100.4) | 4 (44.4) | 2 (22.2) | 1 (11.1) | 7 (77.8) | 9 (100.1) | 0 (0.0) | 1 (10.3) |
| Burglaries (per 100,000) | 27 (310.8) | 25 (278.4) | 35 (388.5) | 37 (408.4) | 24 (267.8) | 19 (211.6) | 20 (223.0) | 15 (166.6) | 14 (155.3) | 10 (110.9) | 10 (111.2) | 14 (155.7) | 2 (22.2) | 9 (92.8) |
| Thefts (per 100,000) | 184 (2,118) | 212 (2,361) | 196 (2,175) | 206 (2,274) | 149 (1,663) | 138 (1,537) | 149 (1,662) | 124 (1,377) | 127 (1,409) | 144 (1,596) | 131 (1,457) | 120 (1,335) | 25 (277.0) | 41 (422.9) |
| Auto thefts (per 100,000) | 3 (34.5) | 5 (55.7) | 2 (22.2) | 2 (22.1) | 2 (22.3) | 3 (33.4) | 1 (11.2) | 1 (11.1) | 4 (44.4) | 1 (11.1) | 3 (33.4) | 2 (22.2) | 0 (0.0) | 4 (41.3) |
| Arson (per 100,000) | 4 (46.0) | 4 (44.5) | 4 (44.4) | 1 (11.0) | 10 (111.6) | 0 (0.0) | 10 (111.5) | 3 (33.3) | 0 (0.0) | 5 (55.4) | 0 (0.0) | 2 (22.2) | 0 (0.0) | 0 (0.0) |
| City-Data.com crime index | 238.1 | 206.3 | 249.2 | 136.8 | 129.4 | 105.7 | 123.1 | 83.2 | 88.5 | 120.2 | 132.1 | 99.4 | 21.5 | 28.8 |
The City-Data.com crime index weighs serious crimes and violent crimes more heavily. Higher means more crime, U.S. average is 246.1. It adjusts for the number of visitors and daily workers commuting into cities.
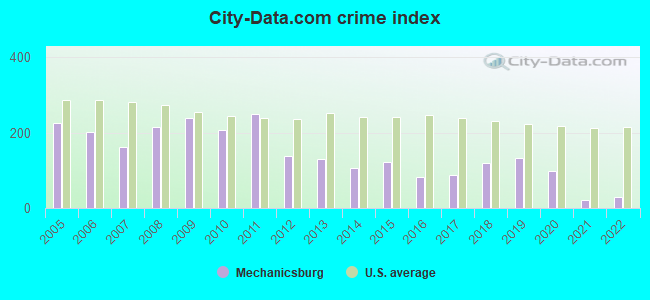
Crime rate in Mechanicsburg detailed stats: murders, rapes, robberies, assaults, burglaries, thefts, arson
Full-time law enforcement employees in 2021, including police officers: 17 (15 officers - 14 male; 1 female).
| Officers per 1,000 residents here: | 1.66 |
| Pennsylvania average: | 2.55 |
 Recent articles from our blog. Our writers, many of them Ph.D. graduates or candidates, create easy-to-read articles on a wide variety of topics.


 | Moving to Mechanicsburg from Houston. (2 replies) |
| Camp Hill, Mechanicsburg, or ??? (2 replies) |
| Walkable areas - PA small to mid sized cities (19 replies) |
| Questions about Mechanicsburg, Camp Hill and Carlisle (24 replies) |
| Air quality and pollution index: Camp Hill, Mechanicsburg (5 replies) |
| Thinking about relocating to the Mechanicsburg area (7 replies) |
Latest news from Mechanicsburg, PA collected exclusively by city-data.com from local newspapers, TV, and radio stations
Ancestries: German (19.2%), American (14.9%), Pennsylvania German (6.4%), Eastern European (6.0%), English (5.7%), Irish (5.7%).
Current Local Time: EST time zone
Incorporated on 04/12/1828
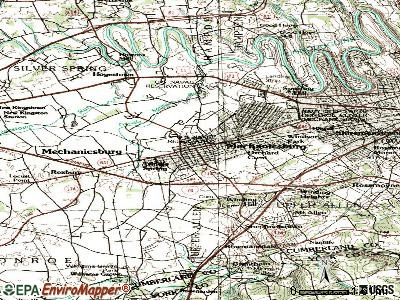
Elevation: 456 feet
Land area: 2.59 square miles.
Population density: 3,723 people per square mile (average).
222 residents are foreign born (1.6% Asia, 0.3% Europe).
| This borough: | 2.3% |
| Pennsylvania: | 7.3% |
Median real estate property taxes paid for housing units with mortgages in 2022: $3,796 (1.6%)
Median real estate property taxes paid for housing units with no mortgage in 2022: $2,535 (1.3%)
Nearest city with pop. 50,000+: Lancaster, PA  (39.0 miles , pop. 56,348).
Nearest city with pop. 200,000+: Baltimore, MD (65.9 miles , pop. 651,154).
Nearest city with pop. 1,000,000+: Philadelphia, PA (99.6 miles , pop. 1,517,550).
Nearest cities:
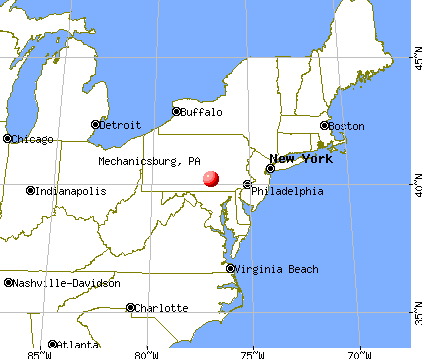
), ), ), ), ), )Latitude: 40.21 N, Longitude: 77.01 W
Daytime population change due to commuting: +1,194 (+12.4%)
Workers who live and work in this borough: 1,483 (27.9%)
| Here: | 2.2% |
| Pennsylvania: | 2.9% |

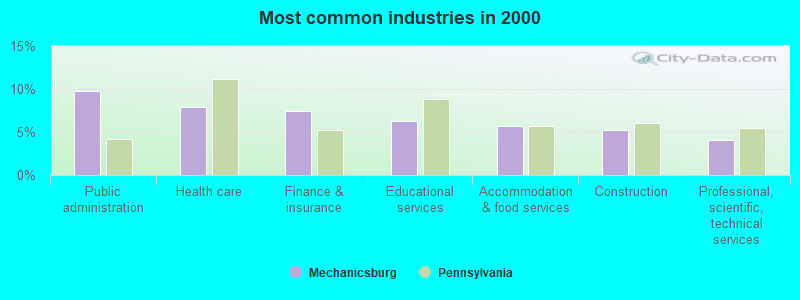
- Public administration (9.8%)
- Health care (8.0%)
- Finance & insurance (7.5%)
- Educational services (6.2%)
- Accommodation & food services (5.7%)
- Construction (5.2%)
- Professional, scientific, technical services (4.1%)
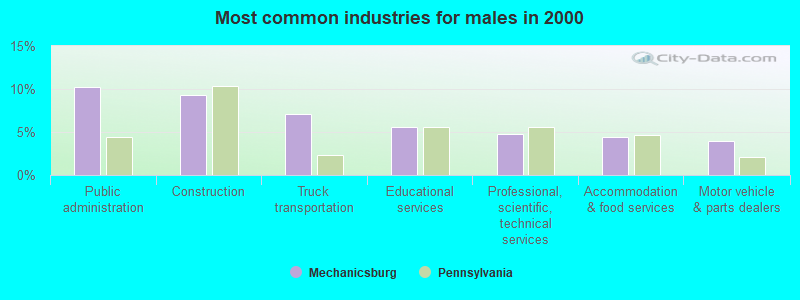
- Public administration (10.3%)
- Construction (9.3%)
- Truck transportation (7.1%)
- Educational services (5.5%)
- Professional, scientific, technical services (4.7%)
- Accommodation & food services (4.5%)
- Motor vehicle & parts dealers (4.0%)
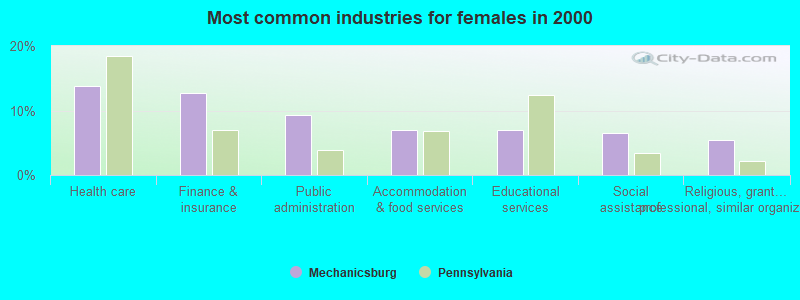
- Health care (13.9%)
- Finance & insurance (12.7%)
- Public administration (9.3%)
- Accommodation & food services (7.0%)
- Educational services (7.0%)
- Social assistance (6.5%)
- Religious, grantmaking, civic, professional, similar organizations (5.4%)
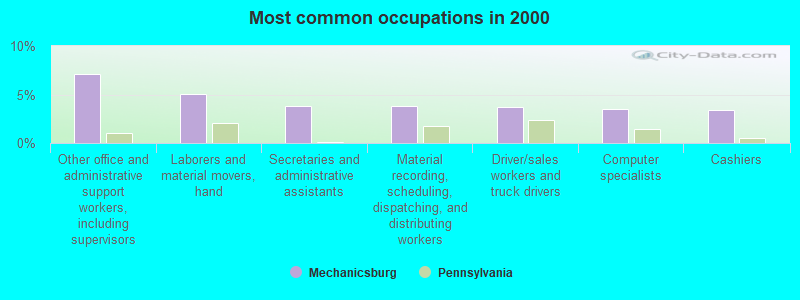
- Other office and administrative support workers, including supervisors (7.1%)
- Laborers and material movers, hand (5.1%)
- Secretaries and administrative assistants (3.9%)
- Material recording, scheduling, dispatching, and distributing workers (3.8%)
- Driver/sales workers and truck drivers (3.8%)
- Computer specialists (3.5%)
- Cashiers (3.4%)
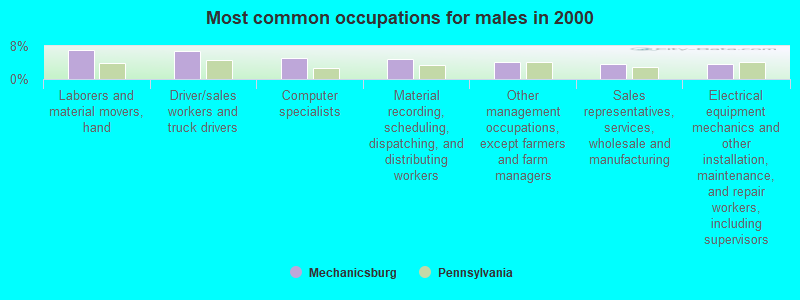
- Laborers and material movers, hand (7.1%)
- Driver/sales workers and truck drivers (6.9%)
- Computer specialists (5.1%)
- Material recording, scheduling, dispatching, and distributing workers (4.9%)
- Other management occupations, except farmers and farm managers (4.2%)
- Sales representatives, services, wholesale and manufacturing (3.7%)
- Electrical equipment mechanics and other installation, maintenance, and repair workers, including supervisors (3.7%)
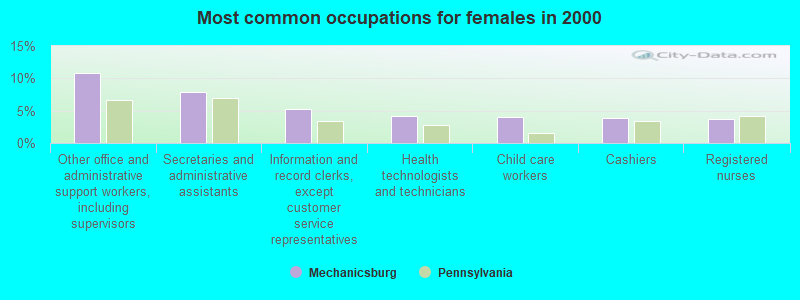
- Other office and administrative support workers, including supervisors (10.8%)
- Secretaries and administrative assistants (7.8%)
- Information and record clerks, except customer service representatives (5.3%)
- Health technologists and technicians (4.2%)
- Child care workers (4.0%)
- Cashiers (3.8%)
- Registered nurses (3.7%)
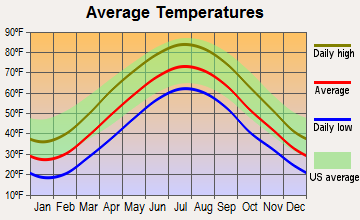
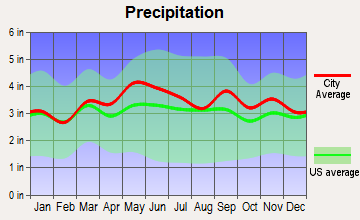
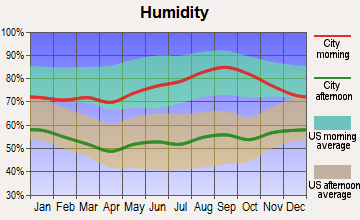
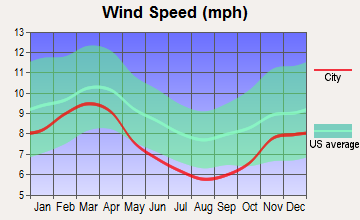
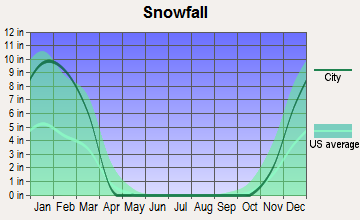
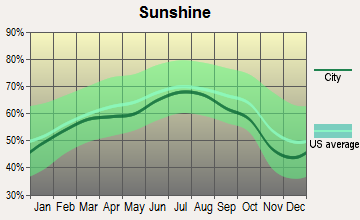
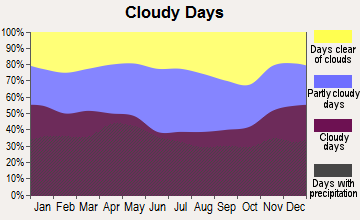
Average climate in Mechanicsburg, Pennsylvania
Based on data reported by over 4,000 weather stations
|
|

(lower is better)
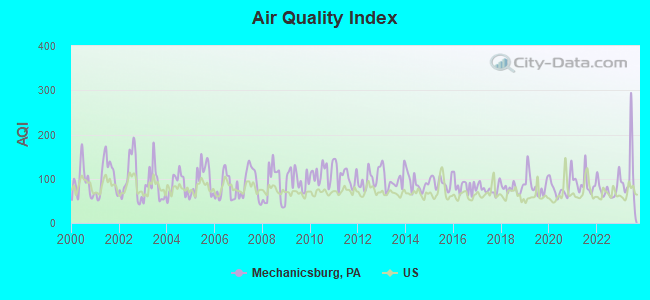
Air Quality Index (AQI) level in 2023 was 106. This is significantly worse than average.
| City: | 106 |
| U.S.: | 73 |
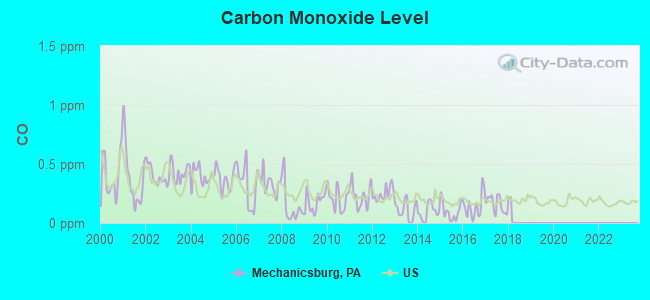
Carbon Monoxide (CO) [ppm] level in 2017 was 0.157. This is significantly better than average. Closest monitor was 7.4 miles away from the city center.
| City: | 0.157 |
| U.S.: | 0.251 |
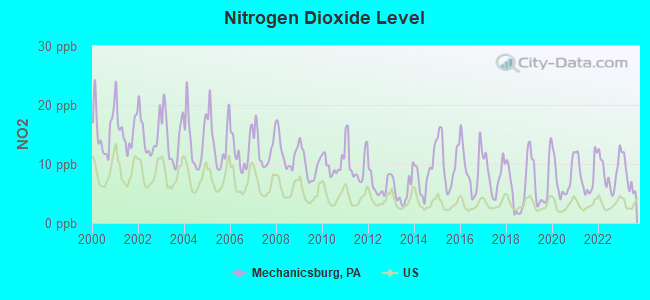
Nitrogen Dioxide (NO2) [ppb] level in 2023 was 7.94. This is significantly worse than average. Closest monitor was 7.5 miles away from the city center.
| City: | 7.94 |
| U.S.: | 5.11 |
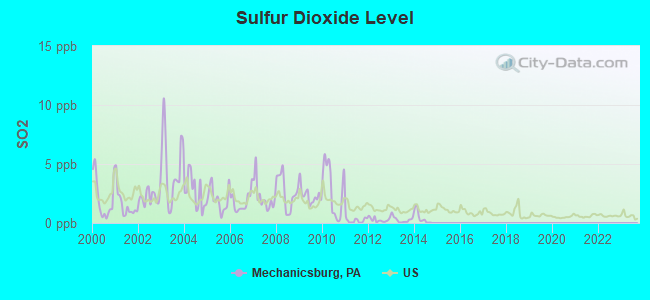
Sulfur Dioxide (SO2) [ppb] level in 2014 was 0.468. This is significantly better than average. Closest monitor was 7.5 miles away from the city center.
| City: | 0.468 |
| U.S.: | 1.515 |
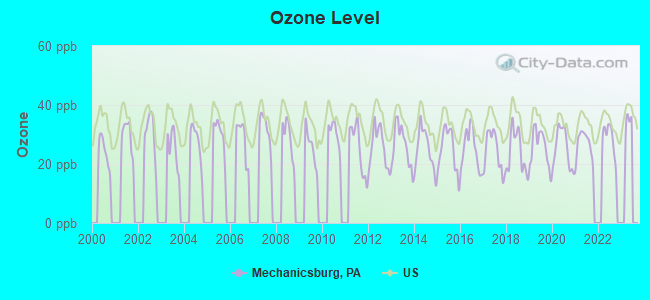
Ozone [ppb] level in 2022 was 28.6. This is about average. Closest monitor was 7.5 miles away from the city center.
| City: | 28.6 |
| U.S.: | 33.3 |
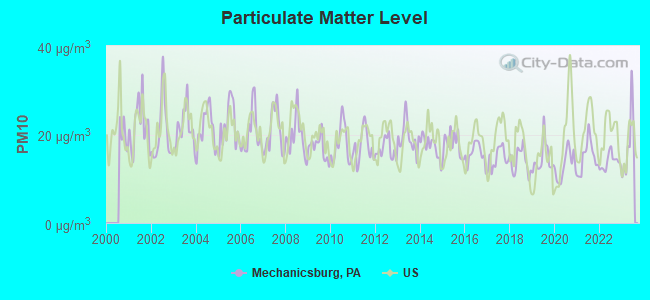
Particulate Matter (PM10) [µg/m3] level in 2023 was 17.9. This is about average. Closest monitor was 8.7 miles away from the city center.
| City: | 17.9 |
| U.S.: | 19.2 |
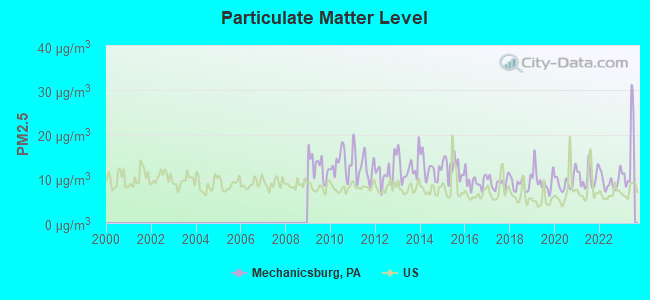
Particulate Matter (PM2.5) [µg/m3] level in 2023 was 15.0. This is significantly worse than average. Closest monitor was 7.6 miles away from the city center.
| City: | 15.0 |
| U.S.: | 8.1 |
Tornado activity:
Mechanicsburg-area historical tornado activity is slightly above Pennsylvania state average. It is 3% greater than the overall U.S. average.
On 6/7/1980, a category F3 (max. wind speeds 158-206 mph) tornado 19.5 miles away from the Mechanicsburg borough center caused between $50,000 and $500,000 in damages.
On 7/14/2004, a category F3 tornado 23.0 miles away from the borough center caused $18 million in damages.
Earthquake activity:
Mechanicsburg-area historical earthquake activity is significantly above Pennsylvania state average. It is 63% smaller than the overall U.S. average.On 8/23/2011 at 17:51:04, a magnitude 5.8 (5.8 MW, Depth: 3.7 mi, Class: Moderate, Intensity: VI - VII) earthquake occurred 166.9 miles away from Mechanicsburg center
On 1/16/1994 at 01:49:16, a magnitude 4.6 (4.6 MB, 4.6 LG, Depth: 3.1 mi, Class: Light, Intensity: IV - V) earthquake occurred 51.8 miles away from Mechanicsburg center
On 9/25/1998 at 19:52:52, a magnitude 5.2 (4.8 MB, 4.3 MS, 5.2 LG, 4.5 MW, Depth: 3.1 mi) earthquake occurred 198.2 miles away from the city center
On 1/16/1994 at 00:42:43, a magnitude 4.2 (4.2 MB, 4.0 LG, Depth: 3.1 mi) earthquake occurred 53.3 miles away from the city center
On 10/7/1983 at 10:18:46, a magnitude 5.3 (5.1 MB, 5.3 LG, 5.1 ML) earthquake occurred 292.6 miles away from Mechanicsburg center
On 1/31/1986 at 16:46:43, a magnitude 5.0 (5.0 MB) earthquake occurred 237.4 miles away from the city center
Magnitude types: regional Lg-wave magnitude (LG), body-wave magnitude (MB), local magnitude (ML), surface-wave magnitude (MS), moment magnitude (MW)
Natural disasters:
The number of natural disasters in Cumberland County (17) is near the US average (15).Major Disasters (Presidential) Declared: 13
Emergencies Declared: 4
Causes of natural disasters: Winter Storms: 4, Floods: 3, Hurricanes: 3, Snowstorms: 3, Storms: 3, Tropical Storms: 3, Blizzard: 1, Heavy Rain: 1, Snowfall: 1, Tropical Depression: 1, Other: 1 (Note: some incidents may be assigned to more than one category).
Main business address for: SELECT MEDICAL CORP (SERVICES-SPECIALTY OUTPATIENT FACILITIES, NEC).
Hospitals and medical centers in Mechanicsburg:
- HEALTHSOUTH REHAB HOSPITAL OF MECHANICSBURG (175 LANCASTER BOULEVARD)
- SEIDLE MEMORIAL HOSPITAL (FILBERT & SIMPSON STS)
- WEST SHORE SURGERY CENTER (2015 TECHNOLOGY PARKWAY)
- BETHANY VILLAGE RETIREMENT CENTER (5225 WILSON LANE)
- FOX SUBACUTE AT MECHANICSBURG (120 SOUTH FILBERT ST)
- HEALTHSOUTH MECHANICSBURG REHAB SYSTEM (4950 WILSON LANE)
- HEALTHSOUTH TRANSITIONAL REHABILITATION CENTER (4950 WILSON AVENUE)
- MESSIAH LIFEWAYS AT MESSIAH VILLAGE (100 MOUNT ALLEN DRIVE)
- PINNACLE HEALTH SNU - SEIDLE (120 SOUTH FILBERT STREET)
- US RENAL CARE MECHANICSBURG (120 SOUTH FILBERT STREET)
Heliports located in Mechanicsburg:
Amtrak station near Mechanicsburg:
- 8 miles: HARRISBURG (4TH & CHESTNUT STS.) . Services: ticket office, fully wheelchair accessible, enclosed waiting area, public restrooms, public payphones, snack bar, ATM, paid short-term parking, paid long-term parking, call for car rental service, taxi stand, intercity bus service, public transit connection.
Colleges/Universities in Mechanicsburg:
- Messiah College (Full-time enrollment: 3,035; Location: One College Ave; Private, not-for-profit; Website: www.messiah.edu; Offers Master's degree)
- YTI Career Institute-Capital Region (Full-time enrollment: 308; Location: 401 East Winding Hill Road Suite 101; Private, for-profit; Website: www.yti.edu)
Other colleges/universities with over 2000 students near Mechanicsburg:
- Harrisburg Area Community College-Harrisburg (about 9 miles; Harrisburg, PA; Full-time enrollment: 13,276)
- Dickinson College (about 11 miles; Carlisle, PA; FT enrollment: 2,505)
- Pennsylvania State University-Penn State Harrisburg (about 14 miles; Middletown, PA; FT enrollment: 3,797)
- York College Pennsylvania (about 24 miles; York, PA; FT enrollment: 5,140)
- YTI Career Institute-York (about 24 miles; York, PA; FT enrollment: 2,212)
- Gettysburg College (about 29 miles; Gettysburg, PA; FT enrollment: 2,772)
- Shippensburg University of Pennsylvania (about 30 miles; Shippensburg, PA; FT enrollment: 7,051)
Public high schools in Mechanicsburg:
- CUMBERLAND VALLEY HS (Students: 2,569, Location: 6746 CARLISLE PIKE, Grades: 9-12)
- MECHANICSBURG AREA SHS (Students: 1,229, Location: 500 S BROAD ST, Grades: 9-12)
- CUMBERLAND PERRY AVTS (Students: 1,014, Location: 110 OLD WILLOW MILL ROAD, Grades: 9-12)
Biggest public elementary/middle schools in Mechanicsburg:
- EAGLE VIEW MS (Students: 1,034, Location: 6746 CARLISLE PIKE, Grades: 6-8)
- MECHANICSBURG MS (Students: 894, Location: 1750 SOUTH MARKET STREET, Grades: 6-8)
- GOOD HOPE MS (Students: 796, Location: 451 SKYPORT RD, Grades: 6-8)
- HAMPDEN EL SCH (Students: 642, Location: 441 SKYPORT RD, Grades: KG-5)
- GREEN RIDGE EL SCH (Students: 528, Location: 1 GREEN RIDGE RD, Grades: KG-5)
- SILVER SPRING EL SCH (Students: 478, Location: 6746 CARLISLE PIKE, Grades: KG-5)
- UPPER ALLEN EL SCH (Students: 317, Location: 1790 S MARKET ST, Grades: 3-5)
- SHEPHERDSTOWN EL SCH (Students: 309, Location: 1849 S YORK ST, Grades: 1-2)
- BROAD STREET EL SCH (Students: 276, Location: 200 S BROAD ST, Grades: 1-5)
- ROSSMOYNE EL SCH (Students: 167, Location: 1225 ROSSMOYNE RD, Grades: 3-5)
Private elementary/middle school in Mechanicsburg:
User-submitted facts and corrections:
- Under "Private primary/middle schools in Mechanicsburg" you are missing: The Montessori School & Children's House, Inc., 5020 Ritter Road, Mechanicsburg, PA 17055, 717-766-4221. The school educates children from preK to 3rd grade added by Kathy
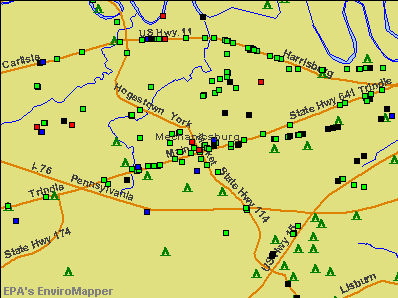
Points of interest:
Notable locations in Mechanicsburg: Washington Fire Company 1 Station 28 (A), Citizens Fire and Rescue Company 2 Station 27 (B). Display/hide their locations on the map
Main business address in Mechanicsburg: SELECT MEDICAL CORP (A). Display/hide its location on the map
Park in Mechanicsburg: Soldier and Sailor Memorial Park (1). Display/hide its location on the map
Hotels: Econo Lodge Mechanicsburg (650 Gettysburg Road), Best Western Plantation Inn (381 Cumberland Parkway), Comfort Inn West (6325 Carlisle Pike (US 11)), Cold Springs Inn (Park Place Lane), Comfort Inn Capital City (1012 Wesley Drive), Homewood Suites by Hilton Harrisburg (5001 Ritter Rd), Amber Inn (1032 Audubon Road), Days Inn Mechanicsburg (1012 Wesley Drive), Hampton Inn Harrisburg - West (4950 Ritter Rd).
Court: Pennsylvania Commonwealth - Supreme Court- Civil Procedural Rules Commi (5035 Ritter Road).
Birthplace of: Bobby Warshaw - Soccer player, Christian L. Poorman - Ohio politician and publisher, Jon Ritchie - 2005 NFL player (Philadelphia Eagles, born: Sep 4, 1974), Abner Carroll Binder - Journalist, Andrew Welker - Footballer, Del Beshore - Basketball player-coach, Dustin Bixler - Soccer player, Jerry L. Nailor - Politician, Jon Howard - Guitarist, Joshua Gros - Major League Soccer player (DC United, born: Jun 25, 1982).
Drinking water stations with addresses in Mechanicsburg and their reported violations in the past:
GREEN HILLS CAMP (Population served: 200, Groundwater):Past monitoring violations:SILVER SPRING GC (Population served: 150, Groundwater):
- 4 routine major monitoring violations
- 2 regular monitoring violations
Past health violations:CASTLE HILL MHP (Population served: 120, Groundwater):Past monitoring violations:
- MCL, Monthly (TCR) - Between OCT-2009 and DEC-2009, Contaminant: Coliform. Follow-up actions: St Public Notif received (DEC-22-2009), St Compliance achieved (DEC-22-2009), St Violation/Reminder Notice (DEC-22-2009)
- 3 routine major monitoring violations
Past monitoring violations:MOES BAR & GRILL INC (Population served: 100, Groundwater):
- Monitoring and Reporting (DBP) - Between APR-2010 and JUN-2010, Contaminant: Chlorine. Follow-up actions: St Compliance achieved (JUL-29-2010)
- One routine major monitoring violation
Past monitoring violations:ECONOLODGE (Population served: 80, Groundwater):
- 2 routine major monitoring violations
- One minor monitoring violation
- 2 regular monitoring violations
Past monitoring violations:COUNTRYSIDE MHP (Population served: 60, Groundwater):
- 3 routine major monitoring violations
Past monitoring violations:MONROE TWP FIRE CO (Population served: 50, Groundwater):
- Monitoring, Source Water (GWR) - Between SEP-20-2011 and OCT-20-2011, Contaminant: E. COLI. Follow-up actions: St Formal NOV issued (NOV-03-2011), St Compliance achieved (DEC-09-2011)
Past monitoring violations:STONEY RIDGE PARK (Population served: 25, Groundwater):
- 4 routine major monitoring violations
- 4 regular monitoring violations
Past monitoring violations:
- One routine major monitoring violation
- 2 regular monitoring violations
Drinking water stations with addresses in Mechanicsburg that have no violations reported:
- WILLIAMS GROVE SPEEDWAY (Population served: 500, Primary Water Source Type: Groundwater)
| This borough: | 2.2 people |
| Pennsylvania: | 2.5 people |
| This borough: | 57.8% |
| Whole state: | 65.0% |
| This borough: | 8.0% |
| Whole state: | 6.6% |
Likely homosexual households (counted as self-reported same-sex unmarried-partner households)
- Lesbian couples: 0.6% of all households
- Gay men: 0.2% of all households
People in group quarters in Mechanicsburg in 2010:
- 22 people in nursing facilities/skilled-nursing facilities
- 6 people in group homes intended for adults
- 3 people in other noninstitutional facilities
People in group quarters in Mechanicsburg in 2000:
- 42 people in nursing homes
- 15 people in homes for the mentally retarded
- 5 people in religious group quarters
Banks with most branches in Mechanicsburg (2011 data):
- PNC Bank, National Association: 8 branches. Info updated 2012/03/20: Bank assets: $263,309.6 mil, Deposits: $197,343.0 mil, headquarters in Wilmington, DE, positive income, Commercial Lending Specialization, 3085 total offices, Holding Company: Pnc Financial Services Group, Inc., The
- Fulton Bank, National Association: Silver Spring Commons Branch at 6520 Carlisle Pike, branch established on 1985/12/02; Cumberland Parkway Branch at 1423 S Market St, branch established on 1999/11/08. Info updated 2010/12/30: Bank assets: $9,041.7 mil, Deposits: $6,700.3 mil, headquarters in Lancaster, PA, positive income, Commercial Lending Specialization, 122 total offices, Holding Company: Fulton Financial Corporation
- Citizens Bank of Pennsylvania: Mechanicsburg Branch at Two West Main Street, branch established on 1957/07/01; Mechanicsburg Giant Eagle Branch at 255 Cumberland Parkway, branch established on 1999/01/15. Info updated 2010/09/24: Bank assets: $32,316.9 mil, Deposits: $25,297.1 mil, headquarters in Philadelphia, PA, positive income, 396 total offices, Holding Company: Uk Financial Investments Limited
- Metro Bank: Hampden Township Branch at 4860 Carlisle Pike, branch established on 1988/10/24; Simpson Ferry Branch at 5032 Simpson Ferry Road, branch established on 1997/09/27. Info updated 2009/09/09: Bank assets: $2,417.8 mil, Deposits: $2,091.3 mil, headquarters in Lemoyne, PA, positive income, Commercial Lending Specialization, 33 total offices, Holding Company: Metro Bancorp, Inc.
- Orrstown Bank: Simpson Street Office at 1110 East Simpson Street, branch established on 2004/10/27; Silver Spring Branch at 3 Baden Powell Lane, branch established on 2000/06/29. Info updated 2007/06/29: Bank assets: $1,449.8 mil, Deposits: $1,220.6 mil, headquarters in Shippensburg, PA, negative income in the last year, Commercial Lending Specialization, 22 total offices, Holding Company: Orrstown Financial Services, Inc.
- Manufacturers and Traders Trust Company: Hampden Branch at 5528 Carlisle Pike, branch established on 1966/01/19; Mechanicsburg Branch at 5219 Simpson Ferry Road, branch established on 1979/10/01. Info updated 2011/08/08: Bank assets: $76,887.1 mil, Deposits: $60,064.2 mil, headquarters in Buffalo, NY, positive income, Commercial Lending Specialization, 808 total offices, Holding Company: M&T Bank Corporation
- Woodforest National Bank: Mechanicsburg Wal-Mart Branch at 6520 Carlisle Pike, Suite 550, branch established on 2007/05/19. Info updated 2011/05/10: Bank assets: $3,488.9 mil, Deposits: $3,097.6 mil, headquarters in Houston, TX, positive income, Commercial Lending Specialization, 766 total offices, Holding Company: Woodforest Financial Group Employee Stock Ownership Plan (With 401(K) Provisions)
- Mid Penn Bank: Carlisle Pike Branch at 4622 Carlisle Pike, branch established on 1995/09/25. Info updated 2007/03/02: Bank assets: $715.4 mil, Deposits: $634.1 mil, headquarters in Millersburg, PA, positive income, Commercial Lending Specialization, 14 total offices, Holding Company: Mid Penn Bancorp, Inc.
- Sovereign Bank, National Association: Mechanicsburg Branch at 798 E Simpson St, branch established on 1955/11/17. Info updated 2012/01/31: Bank assets: $78,146.9 mil, Deposits: $48,042.9 mil, headquarters in Wilmington, DE, positive income, Commercial Lending Specialization, 718 total offices, Holding Company: Banco Santander, S.A.
- 2 other banks with 2 local branches
For population 15 years and over in Mechanicsburg:
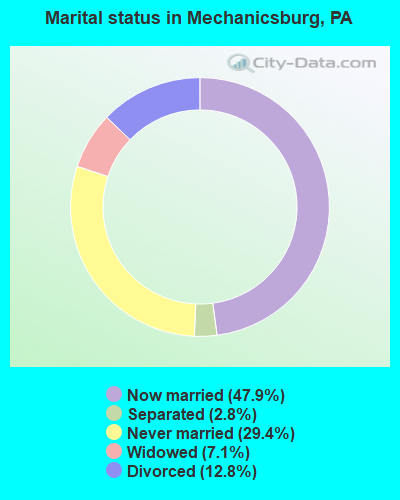
- Never married: 29.4%
- Now married: 47.9%
- Separated: 2.8%
- Widowed: 7.1%
- Divorced: 12.8%
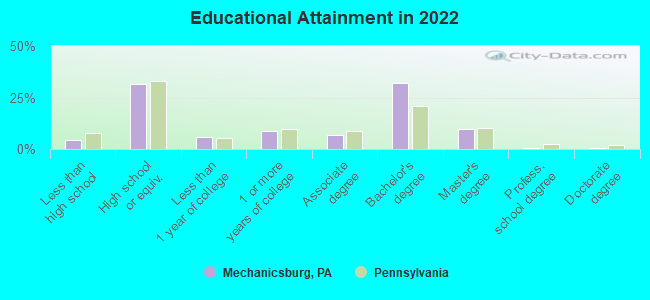
For population 25 years and over in Mechanicsburg:
- High school or higher: 96.1%
- Bachelor's degree or higher: 41.9%
- Graduate or professional degree: 8.6%
- Unemployed: 2.3%
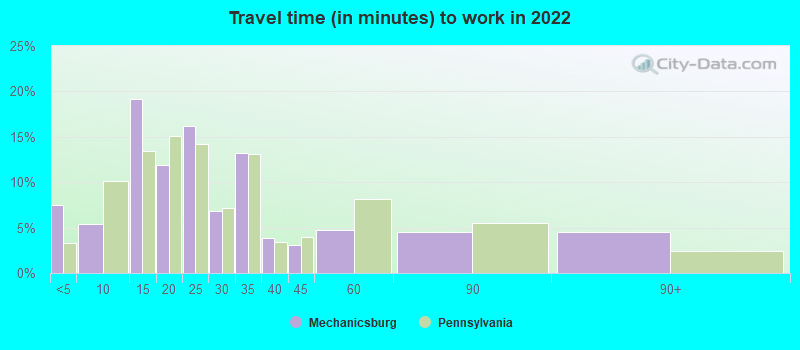
- Mean travel time to work (commute): 18.6 minutes
| Here: | 8.8 |
| Pennsylvania average: | 11.4 |
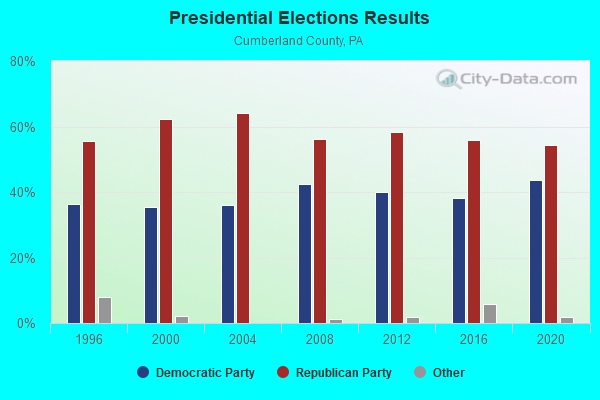
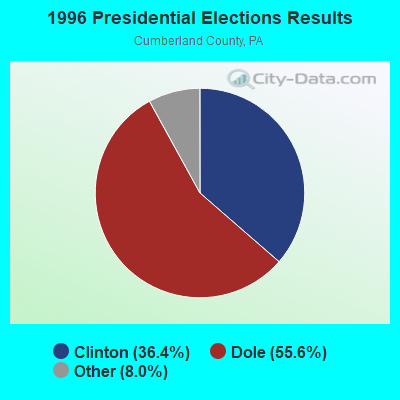

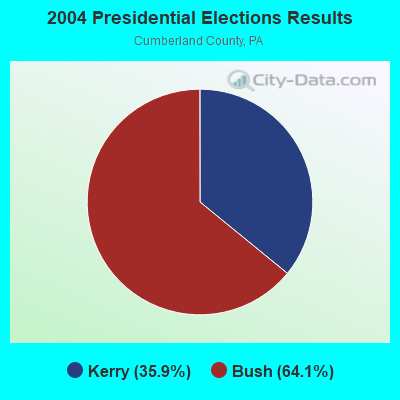
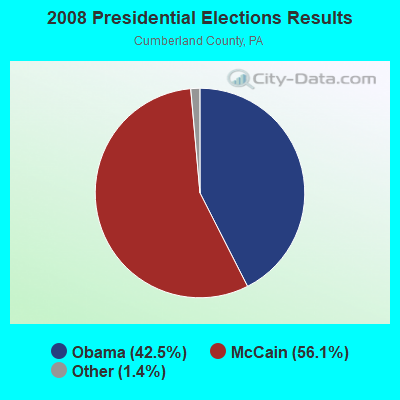
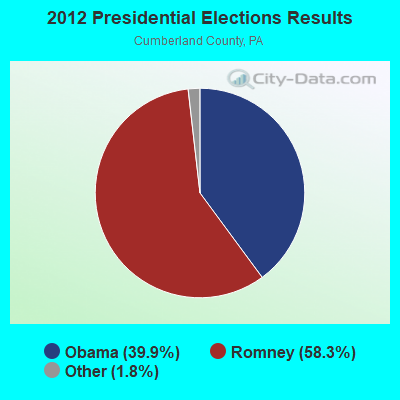
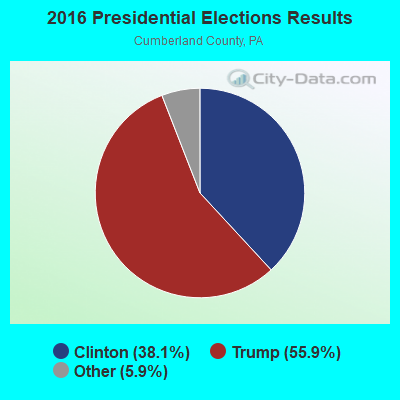
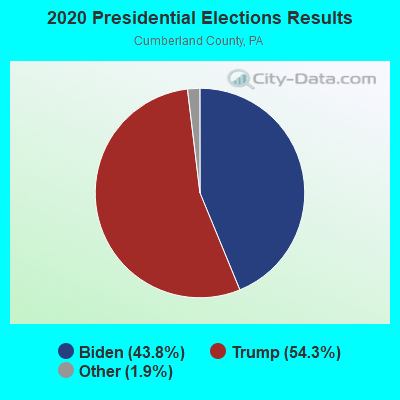
Graphs represent county-level data. Detailed 2008 Election Results
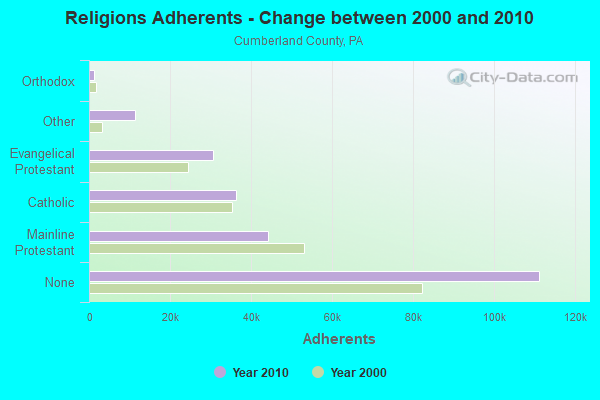
Religion statistics for Mechanicsburg, PA (based on Cumberland County data)
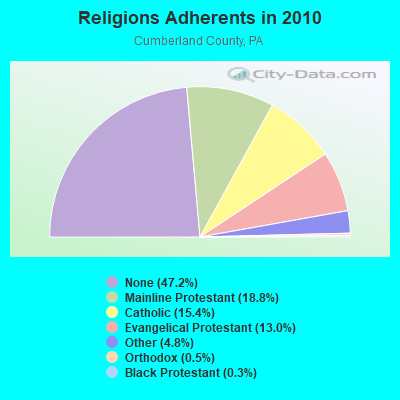
| Religion | Adherents | Congregations |
|---|---|---|
| Mainline Protestant | 44,228 | 106 |
| Catholic | 36,186 | 8 |
| Evangelical Protestant | 30,598 | 148 |
| Other | 11,324 | 17 |
| Orthodox | 1,241 | 4 |
| Black Protestant | 605 | 5 |
| None | 111,224 | - |
Food Environment Statistics:
| Cumberland County: | 1.80 / 10,000 pop. |
| Pennsylvania: | 2.04 / 10,000 pop. |
| This county: | 0.13 / 10,000 pop. |
| Pennsylvania: | 0.09 / 10,000 pop. |
| Cumberland County: | 0.53 / 10,000 pop. |
| State: | 0.88 / 10,000 pop. |
| Here: | 2.64 / 10,000 pop. |
| Pennsylvania: | 2.52 / 10,000 pop. |
| This county: | 7.75 / 10,000 pop. |
| Pennsylvania: | 7.12 / 10,000 pop. |
| This county: | 10.1% |
| State: | 9.1% |
| This county: | 25.6% |
| Pennsylvania: | 27.2% |
| Cumberland County: | 12.8% |
| State: | 11.5% |
Health and Nutrition:
| Mechanicsburg: | 54.4% |
| State: | 50.2% |
| Mechanicsburg: | 53.1% |
| Pennsylvania: | 47.1% |
| This city: | 28.2 |
| Pennsylvania: | 28.7 |
| Mechanicsburg: | 18.6% |
| Pennsylvania: | 20.8% |
| This city: | 8.9% |
| State: | 10.9% |
| Mechanicsburg: | 7.0 |
| State: | 6.8 |
| Here: | 33.1% |
| State: | 34.3% |
| This city: | 61.3% |
| Pennsylvania: | 56.2% |
| Here: | 79.7% |
| Pennsylvania: | 78.3% |
More about Health and Nutrition of Mechanicsburg, PA Residents
| Local government employment and payroll (March 2022) | |||||
| Function | Full-time employees | Monthly full-time payroll | Average yearly full-time wage | Part-time employees | Monthly part-time payroll |
|---|---|---|---|---|---|
| Police Protection - Officers | 14 | $101,765 | $87,227 | 0 | $0 |
| Streets and Highways | 7 | $57,003 | $97,719 | 0 | $0 |
| Solid Waste Management | 5 | $27,775 | $66,660 | 0 | $0 |
| Financial Administration | 4 | $14,353 | $43,059 | 2 | $2,428 |
| Other Government Administration | 3 | $13,666 | $54,664 | 0 | $0 |
| Sewerage | 2 | $9,701 | $58,206 | 0 | $0 |
| Police - Other | 0 | $0 | 3 | $12,847 | |
| Totals for Government | 35 | $224,263 | $76,890 | 5 | $15,275 |
Mechanicsburg government finances - Expenditure in 2018 (per resident):
- Construction - Sewerage: $154,000 ($15.99)
- Current Operations - Sewerage: $1,811,000 ($187.98)
Police Protection: $1,522,000 ($157.98)
Regular Highways: $876,000 ($90.93)
Solid Waste Management: $681,000 ($70.69)
General - Other: $549,000 ($56.99)
Parks and Recreation: $355,000 ($36.85)
Local Fire Protection: $317,000 ($32.90)
Central Staff Services: $194,000 ($20.14)
General Public Buildings: $164,000 ($17.02)
Protective Inspection and Regulation - Other: $98,000 ($10.17)
Financial Administration: $57,000 ($5.92)
Judicial and Legal Services: $37,000 ($3.84)
Housing and Community Development: $18,000 ($1.87)
Libraries: $8,000 ($0.83)
Miscellaneous Commercial Activities - Other: $1,000 ($0.10)
- General - Interest on Debt: $418,000 ($43.39)
- Other Capital Outlay - Police Protection: $63,000 ($6.54)
Parks and Recreation: $15,000 ($1.56)
- Total Salaries and Wages: $2,626,000 ($272.58)
Mechanicsburg government finances - Revenue in 2018 (per resident):
- Charges - Sewerage: $2,713,000 ($281.61)
Solid Waste Management: $715,000 ($74.22)
Parks and Recreation: $176,000 ($18.27)
Other: $101,000 ($10.48)
Parking Facilities: $9,000 ($0.93)
Regular Highways: $4,000 ($0.42)
- Federal Intergovernmental - Highways: $4,000 ($0.42)
- Local Intergovernmental - General Local Government Support: $50,000 ($5.19)
- Miscellaneous - Fines and Forfeits: $41,000 ($4.26)
Interest Earnings: $38,000 ($3.94)
Rents: $22,000 ($2.28)
Donations From Private Sources: $7,000 ($0.73)
General Revenue - Other: $2,000 ($0.21)
- State Intergovernmental - Other: $305,000 ($31.66)
Highways: $279,000 ($28.96)
General Local Government Support: $4,000 ($0.42)
- Tax - Property: $2,270,000 ($235.62)
Individual Income: $1,118,000 ($116.05)
Occupation and Business License - Other: $209,000 ($21.69)
Public Utility License: $181,000 ($18.79)
Documentary and Stock Transfer: $139,000 ($14.43)
Mechanicsburg government finances - Debt in 2018 (per resident):
- Long Term Debt - Beginning Outstanding - Unspecified Public Purpose: $13,145,000 ($1364.44)
Outstanding Unspecified Public Purpose: $12,515,000 ($1299.05)
Retired Unspecified Public Purpose: $630,000 ($65.39)
Mechanicsburg government finances - Cash and Securities in 2018 (per resident):
- Bond Funds - Cash and Securities: $656,000 ($68.09)
- Other Funds - Cash and Securities: $7,166,000 ($743.82)
7.10% of this county's 2021 resident taxpayers lived in other counties in 2020 ($59,936 average adjusted gross income)
| Here: | 7.10% |
| Pennsylvania average: | 5.27% |
0.04% of residents moved from foreign countries ($587 average AGI)
Cumberland County: 0.04% Pennsylvania average: 0.01%
Top counties from which taxpayers relocated into this county between 2020 and 2021:
| from Dauphin County, PA | |
| from York County, PA | |
| from Franklin County, PA |
6.20% of this county's 2020 resident taxpayers moved to other counties in 2021 ($69,359 average adjusted gross income)
| Here: | 6.20% |
| Pennsylvania average: | 5.44% |
0.05% of residents moved to foreign countries ($979 average AGI)
Cumberland County: 0.05% Pennsylvania average: 0.01%
Top counties to which taxpayers relocated from this county between 2020 and 2021:
| to Dauphin County, PA | |
| to York County, PA | |
| to Franklin County, PA |
| Businesses in Mechanicsburg, PA | ||||
| Name | Count | Name | Count | |
|---|---|---|---|---|
| 7-Eleven | 1 | Lane Furniture | 1 | |
| AT&T | 2 | Long John Silver's | 1 | |
| Advance Auto Parts | 2 | Lowe's | 1 | |
| Applebee's | 1 | Marriott | 1 | |
| Arby's | 1 | Marshalls | 1 | |
| Ashley Furniture | 1 | MasterBrand Cabinets | 1 | |
| Audi | 1 | Mazda | 1 | |
| AutoZone | 2 | McDonald's | 5 | |
| Avenue | 1 | New Balance | 1 | |
| BMW | 1 | Nike | 5 | |
| Bed Bath & Beyond | 1 | Nissan | 1 | |
| Best Western | 1 | OfficeMax | 1 | |
| Blockbuster | 1 | Old Country Buffet | 1 | |
| Burger King | 2 | Olive Garden | 1 | |
| CVS | 4 | Outback | 1 | |
| Chevrolet | 1 | Outback Steakhouse | 1 | |
| Chick-Fil-A | 1 | Panera Bread | 1 | |
| Comfort Inn | 2 | Papa John's Pizza | 1 | |
| Cracker Barrel | 1 | PetSmart | 1 | |
| Curves | 1 | Pizza Hut | 2 | |
| DHL | 2 | Quiznos | 1 | |
| Dairy Queen | 1 | RadioShack | 1 | |
| Dennys | 1 | Ramada | 1 | |
| Domino's Pizza | 1 | Red Lobster | 1 | |
| DressBarn | 1 | Red Robin | 1 | |
| Dressbarn | 1 | Rite Aid | 4 | |
| Dunkin Donuts | 1 | Sears | 1 | |
| Econo Lodge | 1 | Sprint Nextel | 1 | |
| FedEx | 13 | Staples | 1 | |
| Firestone Complete Auto Care | 1 | Starbucks | 1 | |
| Ford | 1 | Subaru | 1 | |
| GNC | 4 | Subway | 6 | |
| GameStop | 2 | T-Mobile | 4 | |
| Giant | 2 | T.G.I. Driday's | 1 | |
| Goodwill | 1 | T.J.Maxx | 1 | |
| H&R Block | 2 | Taco Bell | 1 | |
| Hilton | 2 | Target | 1 | |
| Holiday Inn | 1 | Toyota | 1 | |
| Home Depot | 1 | True Value | 1 | |
| Honda | 1 | U-Haul | 3 | |
| Hyundai | 1 | UPS | 16 | |
| Jones New York | 3 | Value City Furniture | 1 | |
| KFC | 1 | Verizon Wireless | 2 | |
| Kmart | 1 | Volkswagen | 1 | |
| Kohl's | 1 | Walmart | 1 | |
| Kroger | 4 | Wendy's | 3 | |
| Lane Bryant | 1 | |||
Strongest AM radio stations in Mechanicsburg:
- WWII (720 AM; daytime; 2 kW; SHIREMANSTOWN, PA; Owner: HENSLEY BROADCASTING)
- WHP (580 AM; 5 kW; HARRISBURG, PA; Owner: CLEAR CHANNEL BROADCASTING LICENSES, INC.)
- WTKT (1460 AM; 5 kW; HARRISBURG, PA; Owner: CLEAR CHANNEL BROADCASTING LICENSES, INC.)
- WHYL (960 AM; 5 kW; CARLISLE, PA; Owner: CITADEL BROADCASTING COMPANY)
- WCBM (680 AM; 50 kW; BALTIMORE, MD; Owner: WCBM MARYLAND, INC.)
- WSBA (910 AM; 5 kW; YORK, PA; Owner: WSBA LICO, INC.)
- WBAL (1090 AM; 50 kW; BALTIMORE, MD; Owner: HEARST RADIO, INC.)
- WTCY (1400 AM; 1 kW; HARRISBURG, PA; Owner: CUMULUS LICENSING CORP.)
- WGOP (700 AM; daytime; 25 kW; WALKERSVILLE, MD; Owner: BIRACH BROADCASTING CORPORATION)
- WIOO (1000 AM; daytime; 1 kW; CARLISLE, PA; Owner: WIOO RADIO INC.)
- WMET (1150 AM; 50 kW; GAITHERSBURG, MD; Owner: BELTWAY ACQUISITION CORPORATION)
- WVCH (740 AM; 50 kW; CHESTER, PA; Owner: WVCH COMMUNICATIONS, INC.)
- WWJZ (640 AM; 50 kW; MOUNT HOLLY, NJ; Owner: ABC, INC.)
Strongest FM radio stations in Mechanicsburg:
- WHKF (99.3 FM; HARRISBURG, PA; Owner: CLEAR CHANNEL BROADCASTING LICENSES, INC.)
- WJAZ (91.7 FM; SUMMERDALE, PA; Owner: TEMPLE UNIV. COMMWEALTH SYS. HGHR ED)
- WTPA (93.5 FM; MECHANICSBURG, PA; Owner: CUMULUS LICENSING CORP.)
- WITF-FM (89.5 FM; HARRISBURG, PA; Owner: WITF, INC.)
- WNNK-FM (104.1 FM; HARRISBURG, PA; Owner: CUMULUS LICENSING CORP.)
- WRBT (94.9 FM; HARRISBURG, PA; Owner: CLEAR CHANNEL BROADCASTING LICENSES, INC.)
- WRVV (97.3 FM; HARRISBURG, PA; Owner: CLEAR CHANNEL BROADCASTING LICENSES, INC.)
- WVMM (90.7 FM; GRANTHAM, PA; Owner: MESSIAH COLLEGE)
- WHBO (92.7 FM; STARVIEW, PA; Owner: HALL COMMUNICATIONS, INC.)
- WROZ (101.3 FM; LANCASTER, PA; Owner: HALL COMMUNICATIONS, INC.)
- WRKZ-FM (102.3 FM; CARLISLE, PA; Owner: CITADEL BROADCASTING COMPANY)
- WARM-FM (103.3 FM; YORK, PA; Owner: WSBA LICO, INC.)
- WJUN-FM (92.5 FM; MEXICO, PA; Owner: STARVIEW MEDIA, INC.)
- WQLV (98.9 FM; MILLERSBURG, PA; Owner: HEPCO COMMUNICATIONS, INC.)
- WCAT-FM (106.7 FM; HERSHEY, PA; Owner: CITADEL BROADCASTING COMPANY)
- WXPH (88.1 FM; HARRISBURG, PA; Owner: THE TRUSTEES OF THE UNIV. OF PA.)
- WYCR (98.5 FM; YORK-HANOVER, PA; Owner: RADIO HANOVER, INC.)
- WGTY (107.7 FM; GETTYSBURG, PA; Owner: TIMES AND NEWS PUBLISHING COMPANY)
- WQXA-FM (105.7 FM; YORK, PA; Owner: CITADEL BROADCASTING COMPANY)
- WLZS (106.1 FM; BEAVER SPRINGS, PA; Owner: STARVIEW MEDIA, INC)
TV broadcast stations around Mechanicsburg:
- WHTM-TV (Channel 27; HARRISBURG, PA; Owner: HARRISBURG TELEVISION, INC.)
- WITF-TV (Channel 33; HARRISBURG, PA; Owner: WITF, INC.)
- WHP-TV (Channel 21; HARRISBURG, PA; Owner: CLEAR CHANNEL BROADCASTING LICENSES, INC.)
- W40AF (Channel 40; DILLSBURG, PA; Owner: PENNSYLVANIA SPORTS ENTERTAINMENT NETWORK, LLC)
- WPMT (Channel 43; YORK, PA; Owner: TRIBUNE TELEVISION COMPANY)
- WLYH-TV (Channel 15; LANCASTER, PA; Owner: TELEVISION STATION GROUP LICENSE SUBSIDIARY, LLC)
- WGAL (Channel 8; LANCASTER, PA; Owner: WGAL HEARST-ARGYLE TELEVISION, INC.)
Medal of Honor Recipients
Medal of Honor Recipient born in Mechanicsburg: Joseph Witcome.
- National Bridge Inventory (NBI) Statistics
- 50Number of bridges
- 410ft / 125mTotal length
- $2,148,000Total costs
- 814,370Total average daily traffic
- 132,150Total average daily truck traffic
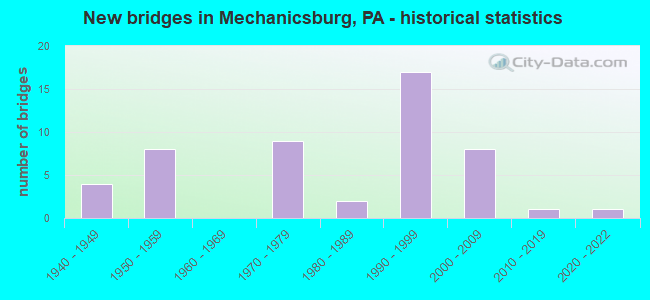
- New bridges - historical statistics
- 41940-1949
- 81950-1959
- 91970-1979
- 21980-1989
- 171990-1999
- 82000-2009
- 12010-2019
- 12020-2022
FCC Registered Antenna Towers: 86 (See the full list of FCC Registered Antenna Towers)
FCC Registered Commercial Land Mobile Towers: 1 (See the full list of FCC Registered Commercial Land Mobile Towers in Mechanicsburg, PA)
FCC Registered Broadcast Land Mobile Towers: 54 (See the full list of FCC Registered Broadcast Land Mobile Towers)
FCC Registered Microwave Towers: 103 (See the full list of FCC Registered Microwave Towers in this town)
FCC Registered Amateur Radio Licenses: 521 (See the full list of FCC Registered Amateur Radio Licenses in Mechanicsburg)
FAA Registered Aircraft Manufacturers and Dealers: 1 (See the full list of FAA Registered Manufacturers and Dealers in Mechanicsburg)
FAA Registered Aircraft: 53 (See the full list of FAA Registered Aircraft)
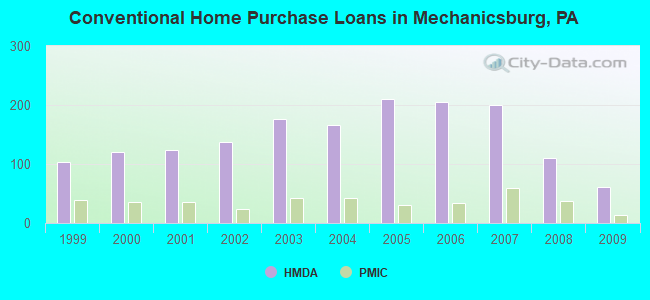
| Home Mortgage Disclosure Act Aggregated Statistics For Year 2009 (Based on 2 full tracts) | ||||||||||||||
| A) FHA, FSA/RHS & VA Home Purchase Loans | B) Conventional Home Purchase Loans | C) Refinancings | D) Home Improvement Loans | E) Loans on Dwellings For 5+ Families | F) Non-occupant Loans on < 5 Family Dwellings (A B C & D) | G) Loans On Manufactured Home Dwelling (A B C & D) | ||||||||
|---|---|---|---|---|---|---|---|---|---|---|---|---|---|---|
| Number | Average Value | Number | Average Value | Number | Average Value | Number | Average Value | Number | Average Value | Number | Average Value | Number | Average Value | |
| LOANS ORIGINATED | 76 | $151,816 | 61 | $131,311 | 210 | $138,229 | 27 | $43,185 | 1 | $250,000 | 15 | $107,733 | 0 | $0 |
| APPLICATIONS APPROVED, NOT ACCEPTED | 3 | $153,000 | 2 | $56,500 | 17 | $152,941 | 3 | $75,667 | 0 | $0 | 2 | $200,000 | 1 | $13,000 |
| APPLICATIONS DENIED | 11 | $166,182 | 5 | $44,400 | 57 | $145,175 | 12 | $38,333 | 0 | $0 | 4 | $70,750 | 2 | $20,000 |
| APPLICATIONS WITHDRAWN | 9 | $137,000 | 7 | $102,429 | 34 | $143,794 | 2 | $104,500 | 0 | $0 | 1 | $138,000 | 1 | $6,000 |
| FILES CLOSED FOR INCOMPLETENESS | 2 | $130,000 | 0 | $0 | 12 | $136,667 | 0 | $0 | 0 | $0 | 0 | $0 | 0 | $0 |
Detailed HMDA statistics for the following Tracts: 0114.00 , 0115.00
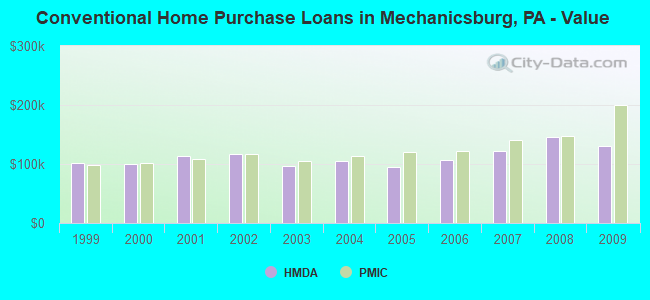
| Private Mortgage Insurance Companies Aggregated Statistics For Year 2009 (Based on 2 full tracts) | ||||
| A) Conventional Home Purchase Loans | B) Refinancings | |||
|---|---|---|---|---|
| Number | Average Value | Number | Average Value | |
| LOANS ORIGINATED | 14 | $200,786 | 9 | $183,222 |
| APPLICATIONS APPROVED, NOT ACCEPTED | 4 | $171,500 | 3 | $197,667 |
| APPLICATIONS DENIED | 0 | $0 | 2 | $167,000 |
| APPLICATIONS WITHDRAWN | 1 | $146,000 | 1 | $86,000 |
| FILES CLOSED FOR INCOMPLETENESS | 0 | $0 | 0 | $0 |
Detailed PMIC statistics for the following Tracts: 0114.00 , 0115.00
2003 - 2018 National Fire Incident Reporting System (NFIRS) incidents
- Fire incident types reported to NFIRS in Mechanicsburg, PA
- 2,19459.8%Structure Fires
- 65517.9%Outside Fires
- 46712.7%Mobile Property/Vehicle Fires
- 3519.6%Other
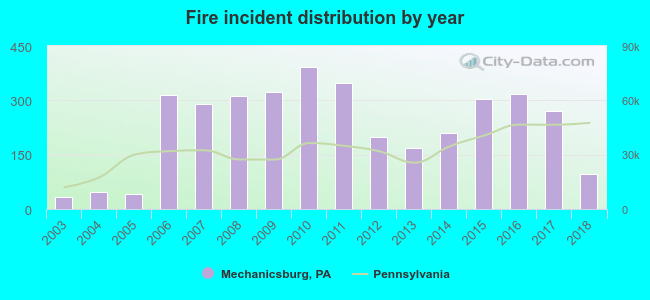 Based on the data from the years 2003 - 2018 the average number of fire incidents per year is 229. The highest number of reported fires - 393 took place in 2010, and the least - 34 in 2003. The data has a growing trend.
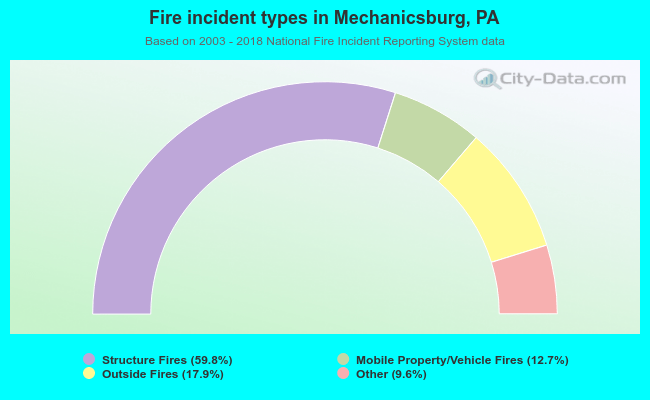 When looking into fire subcategories, the most reports belonged to: Structure Fires (59.8%), and Outside Fires (17.9%).
Fire-safe hotels and motels in Mechanicsburg, Pennsylvania:
- Holiday Inn Express Harrisburg SW-Mechaincsburg, 6325 Carlisle Pike, Mechanicsburg, Pennsylvania 17055 , Phone: (717) 790-0924, Fax: (717) 691-9385
- Hampton Inn, 4950 Ritter Rd, Mechanicsburg, Pennsylvania 17055 , Phone: (717) 691-1300, Fax: (717) 691-9692
- Park Inn Harrisburg West, 5401 Carlisle Pike, Mechanicsburg, Pennsylvania 17050 , Phone: (717) 697-0321, Fax: (717) 697-5917
- Wingate Inn, 385 Cumberland Pkwy, Mechanicsburg, Pennsylvania 17055 , Phone: (717) 766-2710, Fax: (717) 766-9735
- Comfort Inn Capital City, 1012 Wesley Dr, Mechanicsburg, Pennsylvania 17055 , Phone: (717) 766-3700, Fax: (717) 766-8380
- Homewood Suites By Hilton, 5001 Ritter Rd, Mechanicsburg, Pennsylvania 17055 , Phone: (717) 697-4900, Fax: (717) 697-9101
- Country Inn & Suites Harrisburg West, 4943 Gettysburg Rd, Mechanicsburg, Pennsylvania 17055 , Phone: (717) 796-0300, Fax: (717) 796-0800
- Econo Lodge, 650 Gettysburg Rd, Mechanicsburg, Pennsylvania 17055 , Phone: (717) 766-4728, Fax: (717) 766-4728
- 5 other hotels and motels
| Most common first names in Mechanicsburg, PA among deceased individuals | ||
| Name | Count | Lived (average) |
|---|---|---|
| Mary | 328 | 81.9 years |
| John | 302 | 75.4 years |
| Robert | 214 | 72.7 years |
| William | 213 | 74.7 years |
| Charles | 191 | 76.6 years |
| Helen | 177 | 81.5 years |
| Ruth | 163 | 82.1 years |
| George | 158 | 77.4 years |
| James | 152 | 72.6 years |
| Anna | 141 | 83.8 years |
| Most common last names in Mechanicsburg, PA among deceased individuals | ||
| Last name | Count | Lived (average) |
|---|---|---|
| Miller | 113 | 80.4 years |
| Smith | 84 | 78.6 years |
| Myers | 56 | 79.1 years |
| Martin | 41 | 77.5 years |
| Snyder | 40 | 76.3 years |
| Hoffman | 38 | 77.5 years |
| Baker | 36 | 79.6 years |
| Jones | 35 | 73.4 years |
| Thomas | 34 | 77.7 years |
| Brown | 32 | 78.7 years |
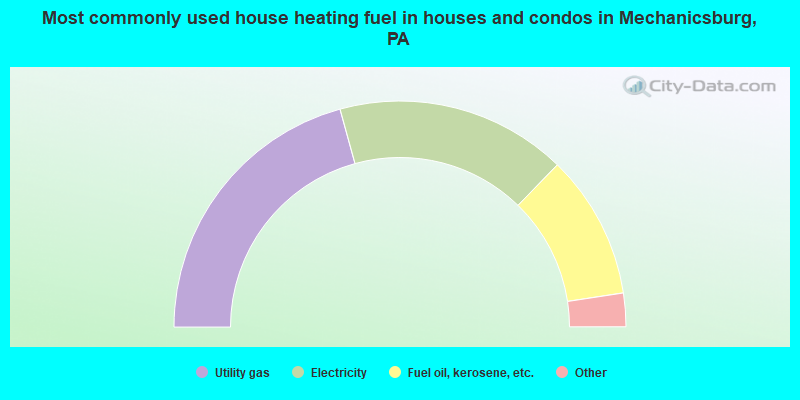
- 41.5%Utility gas
- 33.1%Electricity
- 20.7%Fuel oil, kerosene, etc.
- 3.0%Wood
- 1.1%Solar energy
- 0.7%Bottled, tank, or LP gas
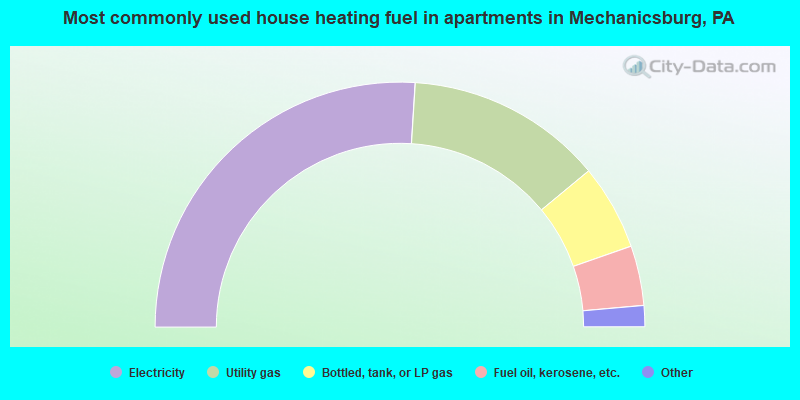
- 52.0%Electricity
- 26.0%Utility gas
- 11.3%Bottled, tank, or LP gas
- 7.9%Fuel oil, kerosene, etc.
- 1.9%Other fuel
- 0.8%No fuel used
Mechanicsburg compared to Pennsylvania state average:
- Unemployed percentage significantly below state average.
- Black race population percentage significantly below state average.
- Foreign-born population percentage significantly below state average.
- Length of stay since moving in above state average.
- Percentage of population with a bachelor's degree or higher above state average.
Mechanicsburg on our top lists:
- #48 on the list of "Top 101 cities with the largest city-data.com crime index decrease from 2011 to 2012 (population 5,000+)"
- #15 on the list of "Top 101 counties with the largest number of people without health insurance coverage in 2000 (pop. 50,000+)"
- #28 on the list of "Top 101 counties with the largest increase in the number of births per 1000 residents 2000-2006 to 2007-2013 (pop 50,000+)"
- #36 on the list of "Top 101 counties with the highest Particulate Matter (PM2.5) Annual air pollution readings in 2012 (µg/m3)"
- #81 on the list of "Top 101 counties with the lowest number of births per 1000 residents 2007-2013"
- #97 on the list of "Top 101 counties with the most Mainline Protestant adherents"

|
|
Total of 440 patent applications in 2008-2024.