Mechanicsburg: Fire Incidents, Pennsylvania (PA)
Where are fire incidents reported in Mechanicsburg, PA
Something went wrong! Please refresh the page.
| Fire incidents reported | |
|---|---|
| Sreet name | Count |
| MAIN ST | 238 |
| CARLISLE PIKE | 200 |
| TRINDLE RD | 184 |
| LISBURN RD | 114 |
| MARKET ST | 110 |
| SIMPSON ST | 102 |
| SIMPSON FERRY RD | 100 |
| 81 INT | 82 |
| ALLEN ST | 78 |
| CARLISLE PIKE, 6402-6691 | 70 |
| LOCUST ST | 70 |
| LOCUST POINT RD | 66 |
| GENEVA DR | 64 |
| I76 | 64 |
| FILBERT ST | 62 |
| WESLEY DR | 62 |
| ROUTE 81, MM 53.01-56.7 | 60 |
| YORK ST | 60 |
| WILLIAMS GROVE RD | 56 |
| 15 RT | 54 |
| SALEM CHURCH RD | 54 |
| CHURCH RD | 52 |
| HEINZ ST | 52 |
| WILSON LN | 50 |
| PENNSYLVANIA TPKE | 46 |
| LANCASTER BLVD | 42 |
| PLEASANT VIEW DR | 42 |
| WERTZVILLE RD | 42 |
| ALLENVIEW DR | 38 |
| GREEN ST | 38 |
| Other | 1,315 |
2003 - 2018 National Fire Incident Reporting System (NFIRS) incidents
- Incident types reported to NFIRS in Mechanicsburg, PA
- 3,66733.4%Fire
- 2,68124.4%Hazardous Condition
- 1,57014.3%Good Intent Call
- 1,26511.5%Rescue & EMS
- 1,11210.1%False Alarm
- 5354.9%Service Call
- 1151.0%Severe Weather
- 180.2%Special Incident
- 150.1%Overpressure Rupture
- Fire incident types reported to NFIRS in Mechanicsburg, PA
- 2,19459.8%Structure Fires
- 65517.9%Outside Fires
- 46712.7%Mobile Property/Vehicle Fires
- 3519.6%Other
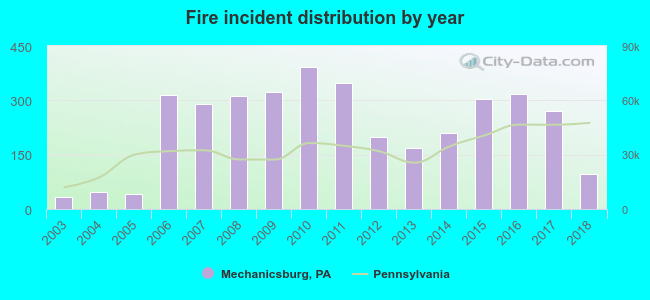 According to the data from the years 2003 - 2018 the average number of fire incidents per year is 229. The highest number of fires - 393 took place in 2010, and the least - 34 in 2003. The data has a rising trend.
The average number of yearly fire incidents per 10k residents in Mechanicsburg, PA compared to nearest cities:
(Note: Based on data for the last 3 years, including only cities with population 5,000 and above)
| Mechanicsburg: | 254.2 |
| Camp Hill: | 137.3 |
| Enola: | 148.4 |
| New Cumberland: | 60.1 |
| Harrisburg: | 188.7 |
| Steelton: | 64.1 |
| Carlisle: | 88.1 |
| Middletown: | 69.5 |
| Hershey: | 37.4 |
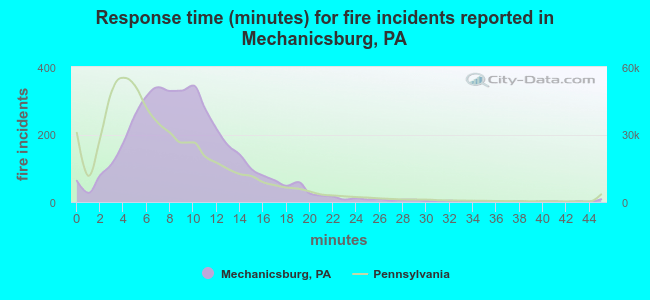 The median response time based on all reported fire incidents is 9 minutes. This is higher compared to the Pennsylvania median value.
The median response time in Mechanicsburg, PA compared to nearest cities:
(Note: Based on data for all years, including only cities with at least 500 fire incidents)
| Mechanicsburg: | 9 minutes |
| Camp Hill: | 8 minutes |
| Enola: | 8 minutes |
| New Cumberland: | 9 minutes |
| Dillsburg: | 10 minutes |
| Harrisburg: | 6 minutes |
| Steelton: | 7 minutes |
| Carlisle: | 7 minutes |
| Dauphin: | 12 minutes |
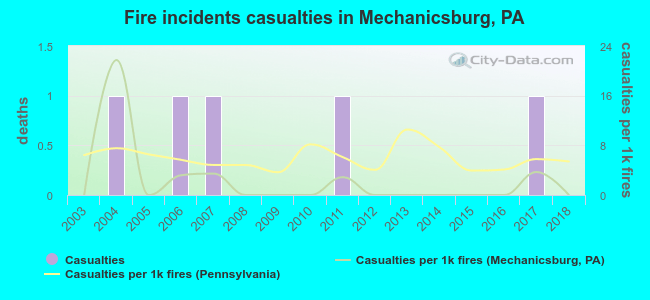 Based on the data from the years 2003 - 2018 the average number of fire-related yearly casualties is 0. The highest number of reported casualties - 1 took place in 2004, and the lowest - 0 in 2003. The data has a constant trend.
The average number of injuries per 1,000 fire incidents is 2. This indicator was the highest - 22 in 2004, and the lowest 0 in 2003. The trend for casualties per 1,000 fire incidents is constant. Compared to the Pennsylvania value the number of injuries per 1,000 fire incidents is much lower.
Based on the data from the years 2003 - 2018 the average number of fire-related yearly casualties is 0. The highest number of reported casualties - 1 took place in 2004, and the lowest - 0 in 2003. The data has a constant trend.
The average number of injuries per 1,000 fire incidents is 2. This indicator was the highest - 22 in 2004, and the lowest 0 in 2003. The trend for casualties per 1,000 fire incidents is constant. Compared to the Pennsylvania value the number of injuries per 1,000 fire incidents is much lower.Casualties per 1,000 incidents in Mechanicsburg, PA compared to nearest cities:
(Note: Based on data for all years, including only cities with at least 500 fire incidents)
| Mechanicsburg: | 1.4 |
| Camp Hill: | 2.0 |
| Enola: | 0.8 |
| New Cumberland: | 1.3 |
| Dillsburg: | 0.0 |
| Harrisburg: | 6.2 |
| Steelton: | 4.5 |
| Carlisle: | 1.7 |
| Dauphin: | 0.0 |
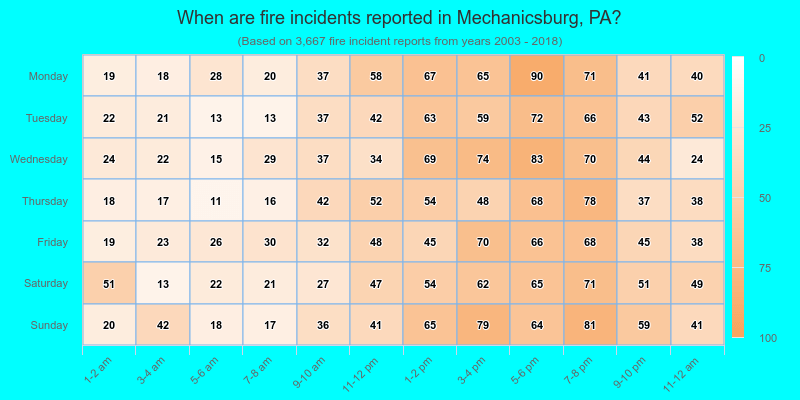
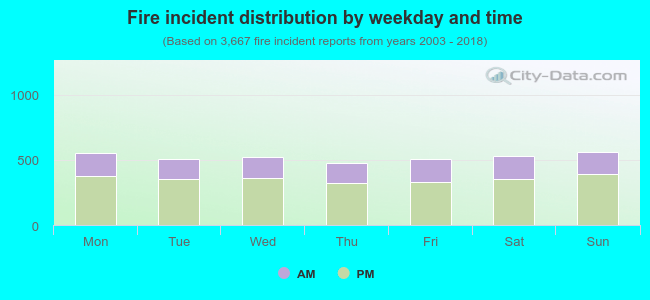 32.1% incidents where reported in the morning and 67.9% in the evening. The most fires (15.4%) took place on Sunday, and the least (13.1%) on Thursday.
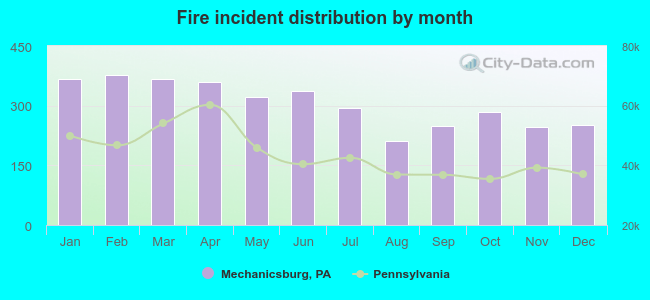 According to the 3,667 fire incident reports from years 2003 - 2018 most fires (10.3%) took place during February, and the least (5.8%) in August.
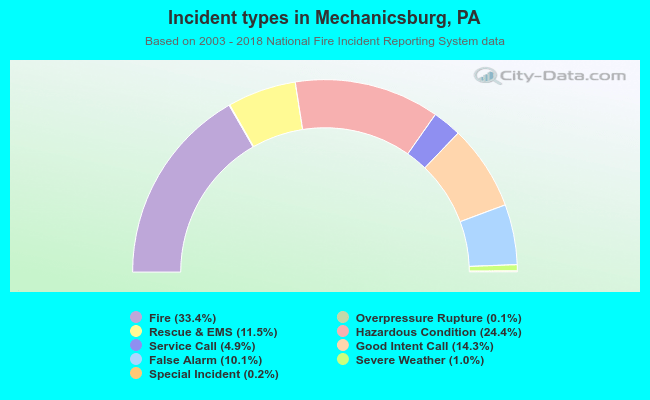 Out of all 10,978 cases reported during the years 2003 - 2018, the most belonged to the categories: Fire (33.4%), Hazardous Condition (24.4%), and Good Intent Call (14.3%).
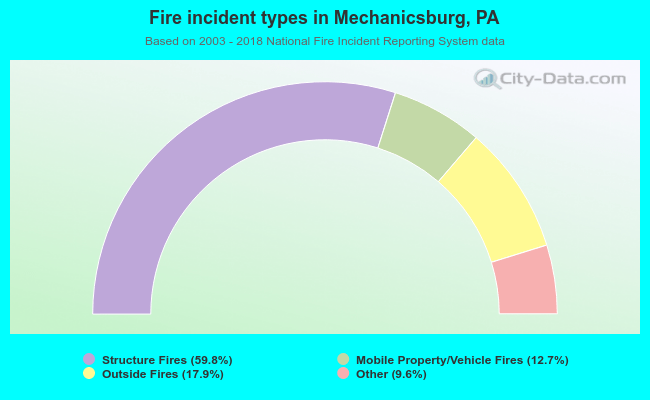 When looking into fire subcategories, the most reports belonged to: Structure Fires (59.8%), and Outside Fires (17.9%).