Races in Westford, Vermont (VT) Detailed Stats
Ancestries, Foreign-born residents, place of birth

Discuss Westford, Vermont races on our local forum with over 2,400,000 registered users
3.6% of Westford, VT residents are foreign-born (1.9% born in Europe, 0.7% born in North America, 0.6% born in Latin America, 0.4% born in Asia), which is 9.8% less than the foreign-born rate of 4.0% across the entire state of Vermont.
Race distribution in Westford

- 2,03297.4%White alone
- 211.0%Hispanic
- 170.8%Two or more races
- 90.4%Asian alone
- 50.2%Black alone
- 20.10%American Indian alone

2000
2022
-
- 585,43196.2%White alone
- 6,8091.1%Two or more races
- 5,5040.9%Hispanic
- 5,1600.8%Asian alone
- 2,9210.5%Black alone
- 2,3250.4%American Indian alone
- 5570.09%Other race alone
- 1200.02%Native Hawaiian and Other
Pacific Islander alone

-
- 583,54690.2%White alone
- 27,3404.2%Two or more races
- 14,7702.3%Hispanic
- 11,5121.8%Asian alone
- 6,2641.0%Black alone
- 2,5210.4%Other race alone
- 1,0520.2%American Indian alone
- 590.01%Native Hawaiian and Other
Pacific Islander alone

Income and house value in Westford
- Median household income in 2022
- $112,026White non-Hispanic householders
- $127,575Asian householders
- $35,681Some other race householders
- $133,591Two or more races householders
- $56,638Hispanic or Latino race householders
- Median 2022 house value
- $351,558White Non-Hispanic householders
- $425,897Asian householders
- $100,666Some other race householders
- $105,932Two or more races householders
- $100,666Hispanic or Latino householders
Household income for White non-Hispanic householders

Household income for Asian householders

Household income for Two or more races householders

Household income for Hispanic or Latino race householders

Foreign-born residents in Westford
76 residents are foreign born (1.9% Europe, 0.7% North America, 0.6% Latin America, 0.4% Asia).
| This city: | 3.6% |
| Vermont: | 3.8% |
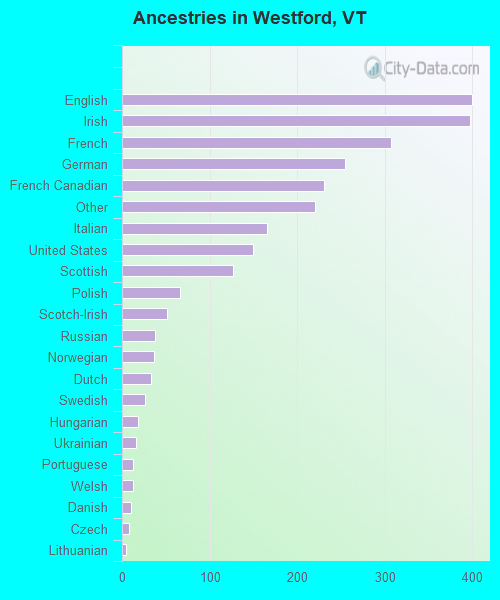
Ancestries in Westford

- 39915.4%English
- 39715.3%Irish
- 30711.8%French
- 2559.8%German
- 2318.9%French Canadian
- 2208.5%Other
- 1666.4%Italian
- 1505.8%United States
- 1274.9%Scottish
- 662.5%Polish
- 512.0%Scotch-Irish
- 381.5%Russian
- 371.4%Norwegian
- 331.3%Dutch
- 261.0%Swedish
- 180.7%Hungarian
- 160.6%Ukrainian
- 130.5%Portuguese
- 130.5%Welsh
- 100.4%Danish
- 80.3%Czech
- 50.2%Lithuanian
- 30.1%West Indian
- 20.08%Arab
- 20.08%Greek
- 20.08%Subsaharan African
- 20.08%Swiss
Zip codes: 05494.