Estimated zip code population in 2022: 4,281 Zip code population in 2010: 4,377 Zip code population in 2000: 3,896
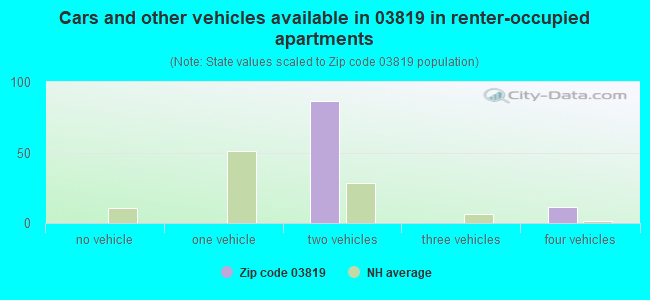
Houses and condos: 1,741 Renter-occupied apartments: 104
% of renters here:
6%
State:
28%
March 2022 cost of living index in zip code 03819: 131.5 (high, U.S. average is 100)
Land area: 11.7 sq. mi. Water area: 0.2 sq. mi.
Population density: 365 people per square mile
(very low).
OSM Map
Google Map
MSN Map
OSM Map
General Map
Google Map
MSN Map
OSM Map
Google Map
MSN Map
OSM Map
Google Map
MSN Map
Please wait while loading the map...
Real estate property taxes paid for housing units in 2022:
This zip code:
1.9% ($7,495)
New Hampshire:
1.6% ($6,209)
Median real estate property taxes paid for housing units with mortgages in 2022: $8,492 (1.8%) Median real estate property taxes paid for housing units with no mortgage in 2022: $5,219 (1.8%)
Business Search- 14 Million verified businesses
Males: 2,018
(47.1%)
Females: 2,263
(52.9%)
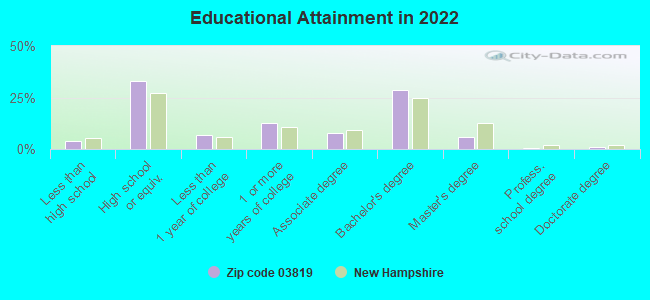
For population 25 years and over in 03819:
High school or higher: 95.6%
Bachelor's degree or higher: 35.7%
Graduate or professional degree: 7.4%
Unemployed: 1.4%
Mean travel time to work (commute): 38.9 minutes
For population 15 years and over in 03819:
Never married: 20.3%
Now married: 59.3%
Separated: 0.5%
Widowed: 7.5%
Divorced: 12.4%
Zip code 03819 compared to state average:
Unemployed percentage below state average.
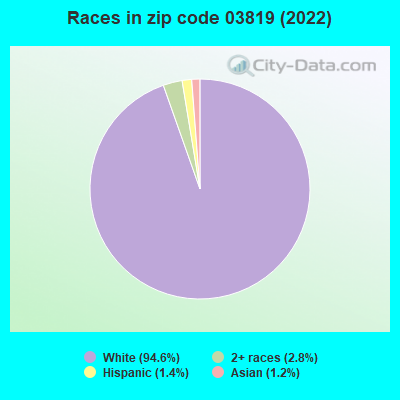
Black race population percentage significantly below state average.
Hispanic race population percentage significantly below state average.
Foreign-born population percentage significantly below state average.
Renting percentage significantly below state average.
House age below state average.
Number of college students significantly below state average.
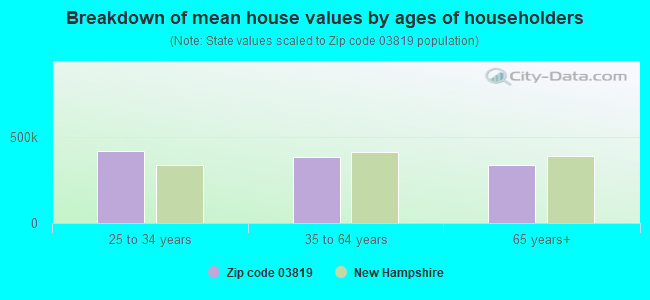
Estimated median house/condo value in 2022: $403,302
03819:
$403,302
New Hampshire:
$384,700
According to our research of New Hampshire and other state lists, there were 5 registered sex offenders living in 03819 zip code as of June 07, 2024. The ratio of all residents to sex offenders in zip code 03819 is 902 to 1. The ratio of registered sex offenders to all residents in this zip code is lower than the state average.
Median resident age:
This zip code:
45.1 years
New Hampshire median age:
43.3 years
Average household size:
This zip code:
2.5 people
New Hampshire:
2.4 people
Averages for the 2020 tax year for zip code 03819, filed in 2021:
Average Adjusted Gross Income (AGI) in 2020: $83,421 (Individual Income Tax Returns)
Here:
$83,421
State:
$88,845
Salary/wage: $75,260 (reported on 87.5% of returns)
Here:
$75,260
State:
$71,693
(% of AGI for various income ranges: 1233.7% for AGIs below $25k, 3565.7% for AGIs $25k-50k, 6694.2% for AGIs $50k-75k, 10545.3% for AGIs $75k-100k, 21071.9% for AGIs $100k-200k, 70648.0% for AGIs over 200k)
Taxable interest for individuals: $549 (reported on 33.2% of returns)
This zip code:
$549
New Hampshire:
$1,640
(% of AGI for various income ranges: 6.9% for AGIs below $25k, 17.1% for AGIs $25k-50k, 39.6% for AGIs $50k-75k, 42.4% for AGIs $75k-100k, 26.5% for AGIs $100k-200k, 164.0% for AGIs over 200k)
Ordinary dividends: $2,102 (reported on 17.2% of returns)
Here:
$2,102
State:
$8,258
(% of AGI for various income ranges: 11.1% for AGIs below $25k, 24.0% for AGIs $25k-50k, 34.6% for AGIs $50k-75k, 48.2% for AGIs $75k-100k, 99.0% for AGIs $100k-200k, 478.0% for AGIs over 200k)
Net capital gain/loss in AGI: +$9,997 (reported on 15.9% of returns)
Here:
+$9,997
State:
+$28,952
(% of AGI for various income ranges: 2.3% for AGIs below $25k, 14.3% for AGIs $25k-50k, 60.4% for AGIs $50k-75k, 109.4% for AGIs $75k-100k, 318.4% for AGIs $100k-200k, 4622.0% for AGIs over 200k)
Profit/loss from business: +$22,853 (reported on 12.9% of returns)
Here:
+$22,853
State:
+$24,424
(% of AGI for various income ranges: 106.0% for AGIs below $25k, 221.1% for AGIs $25k-50k, 273.1% for AGIs $50k-75k, 391.8% for AGIs $75k-100k, 614.5% for AGIs $100k-200k, 4860.0% for AGIs over 200k)
Taxable individual retirement arrangement distribution: $16,320 (reported on 8.6% of returns)
03819:
$16,320
New Hampshire:
$21,952
(% of AGI for various income ranges: 48.6% for AGIs below $25k, 102.6% for AGIs $25k-50k, 185.0% for AGIs $50k-75k, 407.1% for AGIs $75k-100k, 503.9% for AGIs $100k-200k)
Total itemized deductions: $26,573 (reported on 9.5% of returns)
Here:
$26,573
State:
$32,702
(% of AGI for various income ranges: 170.0% for AGIs below $25k, 310.4% for AGIs $50k-75k, 838.8% for AGIs $75k-100k, 615.2% for AGIs $100k-200k, 2222.0% for AGIs over 200k)
Charity contributions: $3,620 (reported on 6.5% of returns)
Here:
$3,620
State:
$9,866
(% of AGI for various income ranges: 14.2% for AGIs $50k-75k, 49.4% for AGIs $75k-100k, 73.5% for AGIs $100k-200k, 388.0% for AGIs over 200k)
Taxes paid: $9,123 (reported on 9.5% of returns)
03819:
$9,123
State:
$8,247
(% of AGI for various income ranges: 62.0% for AGIs below $25k, 121.2% for AGIs $50k-75k, 268.8% for AGIs $75k-100k, 226.5% for AGIs $100k-200k, 632.0% for AGIs over 200k)
Earned income credit: $1,438 (reported on 6.9% of returns)
Here:
$1,438
State:
$1,831
(% of AGI for various income ranges: 31.7% for AGIs below $25k, 34.0% for AGIs $25k-50k)
Percentage of individuals using paid preparers for their 2020 taxes: 92.2%
Here:
92%
State:
92%
(% for various income ranges: 90.6% for AGIs below $25k, 91.3% for AGIs $25k-50k, 94.4% for AGIs $50k-75k, 92.3% for AGIs $75k-100k, 92.7% for AGIs $100k-200k, 93.8% for AGIs over 200k)
Averages for the 2012 tax year for zip code 03819, filed in 2013:
Average Adjusted Gross Income (AGI) in 2012: $61,538 (Individual Income Tax Returns)
Here:
$61,538
State:
$66,185
Salary/wage: $56,301 (reported on 89.9% of returns)
Here:
$56,301
State:
$55,674
(% of AGI for various income ranges: 81.9% for AGIs below $25k, 79.1% for AGIs $25k-50k, 78.0% for AGIs $50k-75k, 81.0% for AGIs $75k-100k, 87.7% for AGIs $100k-200k, 74.0% for AGIs over 200k)
Taxable interest for individuals: $396 (reported on 34.1% of returns)
This zip code:
$396
New Hampshire:
$1,674
(% of AGI for various income ranges: 0.3% for AGIs below $25k, 0.4% for AGIs $25k-50k, 0.3% for AGIs $50k-75k, 0.2% for AGIs $75k-100k, 0.1% for AGIs $100k-200k, 0.2% for AGIs over 200k)
Ordinary dividends: $1,546 (reported on 18.8% of returns)
Here:
$1,546
State:
$6,774
(% of AGI for various income ranges: 1.3% for AGIs below $25k, 0.6% for AGIs $25k-50k, 0.6% for AGIs $50k-75k, 0.4% for AGIs $75k-100k, 0.2% for AGIs $100k-200k, 0.8% for AGIs over 200k)
Net capital gain/loss in AGI: +$2,136 (reported on 12.0% of returns)
Here:
+$2,136
State:
+$13,759
(% of AGI for various income ranges: 0.6% for AGIs $100k-200k, 2.0% for AGIs over 200k)
Profit/loss from business: +$14,480 (reported on 14.4% of returns)
Here:
+$14,480
State:
+$19,298
(% of AGI for various income ranges: 3.4% for AGIs below $25k, 7.8% for AGIs $25k-50k, 4.9% for AGIs $50k-75k, 3.3% for AGIs $75k-100k, 2.4% for AGIs $100k-200k)
Taxable individual retirement arrangement distribution: $12,463 (reported on 9.1% of returns)
03819:
$12,463
New Hampshire:
$16,908
(% of AGI for various income ranges: 2.9% for AGIs below $25k, 1.3% for AGIs $25k-50k, 2.4% for AGIs $50k-75k, 2.3% for AGIs $75k-100k, 2.0% for AGIs $100k-200k)
Total itemized deductions: $20,610 (21% of AGI, reported on 46.2% of returns)
Here:
$20,610
State:
$22,617
Here:
21.1% of AGI
State:
18.1% of AGI
(% of AGI for various income ranges: 10.1% for AGIs below $25k, 13.0% for AGIs $25k-50k, 17.5% for AGIs $50k-75k, 19.0% for AGIs $75k-100k, 16.1% for AGIs $100k-200k, 10.0% for AGIs over 200k)
Charity contributions: $1,605 (reported on 35.6% of returns)
Here:
$1,605
State:
$2,860
(% of AGI for various income ranges: 0.3% for AGIs below $25k, 0.7% for AGIs $25k-50k, 1.0% for AGIs $50k-75k, 1.0% for AGIs $75k-100k, 1.0% for AGIs $100k-200k, 1.1% for AGIs over 200k)
Taxes paid: $9,108 (reported on 46.2% of returns)
03819:
$9,108
State:
$8,830
(% of AGI for various income ranges: 3.8% for AGIs below $25k, 4.6% for AGIs $25k-50k, 7.3% for AGIs $50k-75k, 8.0% for AGIs $75k-100k, 7.7% for AGIs $100k-200k, 5.2% for AGIs over 200k)
Earned income credit: $1,632 (reported on 9.1% of returns)
Here:
$1,632
State:
$1,863
(% of AGI for various income ranges: 2.7% for AGIs below $25k, 0.7% for AGIs $25k-50k)
Percentage of individuals using paid preparers for their 2012 taxes: 49.5%
Here:
50%
State:
45%
(% for various income ranges: 36.9% for AGIs below $25k, 48.8% for AGIs $25k-50k, 60.0% for AGIs $50k-75k, 55.6% for AGIs $75k-100k, 57.9% for AGIs $100k-200k, 60.0% for AGIs over 200k)
Averages for the 2004 tax year for zip code 03819, filed in 2005:
Average Adjusted Gross Income (AGI) in 2004: $51,453 (Individual Income Tax Returns)
Here:
$51,453
State:
$54,348
Salary/wage: $48,206 (reported on 89.3% of returns)
Here:
$48,206
State:
$46,966
(% of AGI for various income ranges: 132.3% for AGIs below $10k, 72.7% for AGIs $10k-25k, 80.2% for AGIs $25k-50k, 85.4% for AGIs $50k-75k, 87.8% for AGIs $75k-100k, 81.8% for AGIs over 100k)
Taxable interest for individuals: $666 (reported on 50.9% of returns)
This zip code:
$666
New Hampshire:
$1,634
(% of AGI for various income ranges: 2.6% for AGIs below $10k, 1.2% for AGIs $10k-25k, 0.6% for AGIs $25k-50k, 0.4% for AGIs $50k-75k, 0.5% for AGIs $75k-100k, 0.8% for AGIs over 100k)
Taxable dividends: $967 (reported on 21.9% of returns)
Here:
$967
State:
$3,855
(% of AGI for various income ranges: 0.9% for AGIs below $10k, 0.8% for AGIs $10k-25k, 0.7% for AGIs $25k-50k, 0.3% for AGIs $50k-75k, 0.2% for AGIs $75k-100k, 0.4% for AGIs over 100k)
Net capital gain/loss: +$5,716 (reported on 17.7% of returns)
Here:
+$5,716
State:
+$13,739
(% of AGI for various income ranges: -1.7% for AGIs below $10k, 0.6% for AGIs $10k-25k, -0.1% for AGIs $25k-50k, 0.3% for AGIs $50k-75k, -0.1% for AGIs $75k-100k, 5.6% for AGIs over 100k)
Profit/loss from business: +$15,232 (reported on 17.6% of returns)
Here:
+$15,232
State:
+$16,641
(% of AGI for various income ranges: -3.7% for AGIs below $10k, 9.2% for AGIs $10k-25k, 9.8% for AGIs $25k-50k, 4.6% for AGIs $50k-75k, 2.4% for AGIs $75k-100k, 5.0% for AGIs over 100k)
IRA payment deduction: $2,905 (reported on 3.3% of returns)
03819:
$2,905
New Hampshire:
$3,013
(% of AGI for various income ranges: 0.4% for AGIs $25k-50k, 0.2% for AGIs $50k-75k, 0.1% for AGIs $75k-100k, 0.1% for AGIs over 100k)
Self-employed pension: $12,786 (reported on 0.7% of returns)
Here:
$12,786
New Hampshire:
$13,003
Total itemized deductions: $18,876 (24% of AGI, reported on 49.9% of returns)
Here:
$18,876
State:
$18,832
Here:
24.2% of AGI
State:
19.6% of AGI
(% of AGI for various income ranges: 18.7% for AGIs below $10k, 15.2% for AGIs $10k-25k, 18.3% for AGIs $25k-50k, 22.1% for AGIs $50k-75k, 19.6% for AGIs $75k-100k, 15.8% for AGIs over 100k)
Charity contributions deductions: $1,462 (2% of AGI, reported on 43.8% of returns)
Here:
$1,462
State:
$2,473
Here:
1.8% of AGI
State:
2.4% of AGI
(% of AGI for various income ranges: 1.2% for AGIs $10k-25k, 1.0% for AGIs $25k-50k, 1.3% for AGIs $50k-75k, 1.4% for AGIs $75k-100k, 1.3% for AGIs over 100k)
Total tax: $6,665 (reported on 80.7% of returns)
03819:
$6,665
State:
$8,835
(% of AGI for various income ranges: 3.5% for AGIs below $10k, 5.3% for AGIs $10k-25k, 7.9% for AGIs $25k-50k, 8.0% for AGIs $50k-75k, 9.4% for AGIs $75k-100k, 14.9% for AGIs over 100k)
Earned income credit: $1,521 (reported on 7.5% of returns)
Here:
$1,521
State:
$1,447
Percentage of individuals using paid preparers for their 2004 taxes: 57.2%
Here:
57%
State:
51%
(% for various income ranges: 40.4% for AGIs below $10k, 50.7% for AGIs $10k-25k, 61.6% for AGIs $25k-50k, 64.0% for AGIs $50k-75k, 62.5% for AGIs $75k-100k, 67.1% for AGIs over 100k)
Household received Food Stamps/SNAP in the past 12 months: 162 Household did not receive Food Stamps/SNAP in the past 12 months: 1,531
Women who had a birth in the past 12 months: 32 (28 now married, 1 unmarried) Women who did not have a birth in the past 12 months: 755 (375 now married, 381 unmarried)
Housing units in zip code 03819 with a mortgage: 895 (128 second mortgage, 125 both second mortgage and home equity loan) Houses without a mortgage: 18
Median monthly owner costs for units with a mortgage: $2,613 Median monthly owner costs for units without a mortgage: $969
Residents with income below the poverty level in 2022:
This zip code:
11.2%
Whole state:
7.2%
Residents with income below 50% of the poverty level in 2022:
This zip code:
6.3%
Whole state:
3.7%
Median number of rooms in houses and condos:
Here:
6.2
State:
6.4
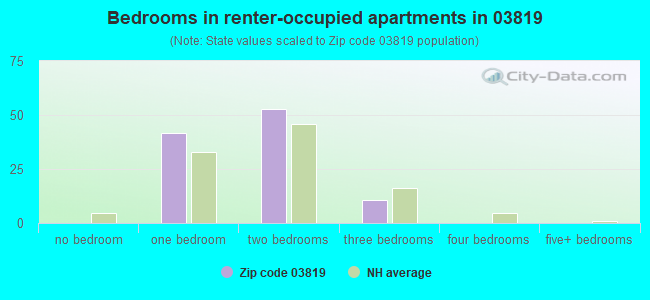
Median number of rooms in apartments:
Here:
3.8
State:
4.0
Notable locations in this zip code not listed on our city pages
Notable locations in zip code 03819: Danville Camping Area (A), Colby Memorial Library (B), Danville Fire and Rescue (C). Display/hide their locations on the map
In group quarters: 3 (-1 institutionalized population)
Size of family households: 537 2-persons, 454 3-persons, 301 4-persons, 49 5-persons, 6 6-persons, 3 7-or-more-persons
Size of nonfamily households: 198 1-person, 139 2-persons
490 married couples with children.
183 single-parent households (78 men, 105 women).
98.8% of residents of 03819 zip code speak English at home.
0.8% of residents speak other Indo-European language at home (100% very well).
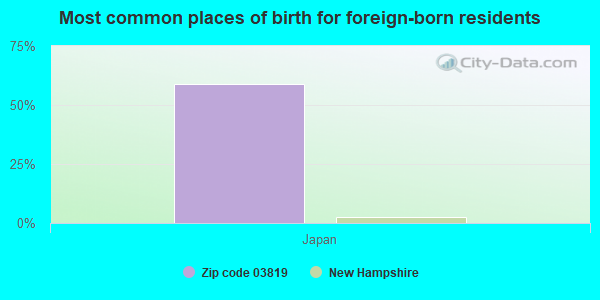
Foreign born population: 23 (0.5%) (100.0% of them are naturalized citizens)
This zip code:
0.5%
Whole state:
6.2%
59%Japan
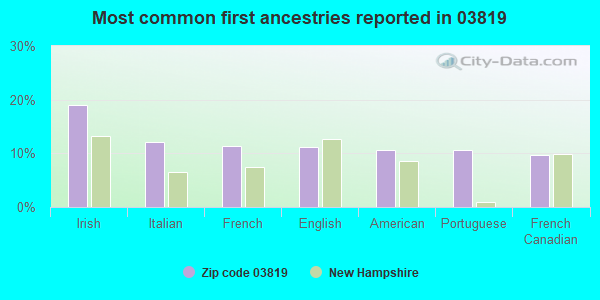
19%Irish
12%Italian
11%French
11%English
11%American
11%Portuguese
10%French Canadian
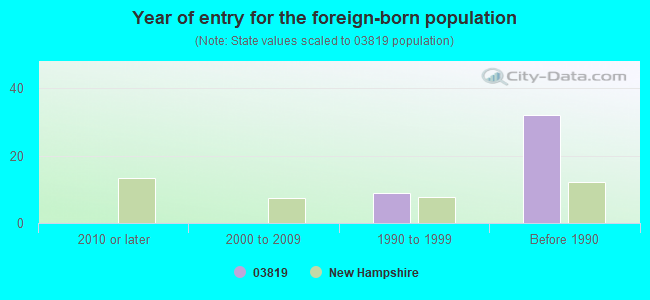
Year of entry for the foreign-born population
02010 or later
02000 to 2009
91990 to 1999
32Before 1990
Major facilities with environmental interests located in this zip code:
DANVILLE ELEMENTARY SCHOOL (23 SCHOOL ST in DANVILLE, NH)
(Geographic Names Information System) (National Center for Education Statistics) - STATE ID-75553412522745 Organizations: TIMBERLANE REGIONAL SCHOOL DISTRICT (SCHOOL DISTRICT)
DANVILLE AUTO (2 HAMPSTEAD RD in DANVILLE, NH)
(Resource Conservation and Recovery Act (tracking hazardous waste)) Organizations: RAYMONDDALLAIRE (CONTACT/OPERATOR)
Alternative names: DANVILLE AUTOMOTIVE REPAIR
DANVILLE FIRE DEPT TOWN OF (RTE 111A in DANVILLE, NH)
HAZARDOUS WASTE BIENNIAL REPORTER (Resource Conservation and Recovery Act (tracking hazardous waste)) (Resource Conservation and Recovery Act (tracking hazardous waste)) Alternative names: DANVILLE TOWN OF
STABILE GENE (39 FAIRVIEW ST in DANVILLE, NH)
HAZARDOUS WASTE BIENNIAL REPORTER (Resource Conservation and Recovery Act (tracking hazardous waste)) (Resource Conservation and Recovery Act (tracking hazardous waste))
BEKINS VAN LINES (6 CARMEL DR in DANVILLE, NH)
(Resource Conservation and Recovery Act (tracking hazardous waste))
BLANEYS AUTO BODY (27 BEACH PLAIN RD in DANVILLE, NH)
Conditionally Exempt Small Quantity Generators, less than 100 kg/month of hazardous waste (Resource Conservation and Recovery Act (tracking hazardous waste)) - notification Organizations: ALANBLANEY (CONTACT/OPERATOR)
BROWNIES GARAGE (72 BACK RD in DANVILLE, NH)
(Resource Conservation and Recovery Act (tracking hazardous waste))
BYRON W H INC (45 PINE ST in DANVILLE, NH)
(Resource Conservation and Recovery Act (tracking hazardous waste))
DANVILLE BAPTIST CHURCH (174 MAIN ST in DANVILLE, NH)
(Resource Conservation and Recovery Act (tracking hazardous waste))
DEBENEDETTO ALBERT RESIDENCE (20 LANCER LANE in DANVILLE, NH)
(Resource Conservation and Recovery Act (tracking hazardous waste))
DEMARCO JOE LOGGING (432 MAIN ST in DANVILLE, NH)
(Resource Conservation and Recovery Act (tracking hazardous waste))
DEMERS PAUL (55 BACK RD in DANVILLE, NH)
(Resource Conservation and Recovery Act (tracking hazardous waste))
WELCH THOMAS (14 OLDE RD in DANVILLE, NH)
(Resource Conservation and Recovery Act (tracking hazardous waste))
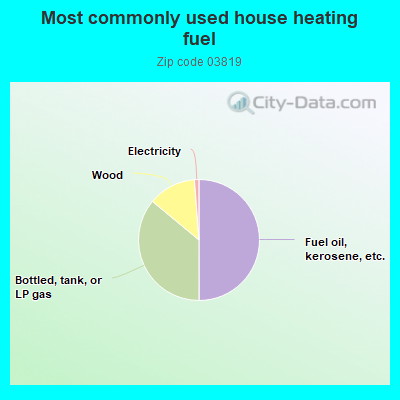
50.1%Fuel oil, kerosene, etc.
36.1%Bottled, tank, or LP gas
12.8%Wood
1.2%Electricity
Population in 1990: 2,471. Population change in the 1990s: +1,425 (+57.7%).
Place of birth for U.S.-born residents:
This state: 791
Northeast: 3,224
Midwest: 95
South: 71
West: 11
47% of the 03819 zip code residents lived in the same house 5 years ago. Out of people who lived in different houses, 54% lived in this county. Out of people who lived in different counties, 50% lived in New Hampshire.
95% of the 03819 zip code residents lived in the same house 1 year ago. Out of people who lived in different houses, 43% moved from this county. Out of people who lived in different houses, 18% moved from different county within same state. Out of people who lived in different houses, 43% moved from different state. Out of people who lived in different houses, 7% moved from abroad.
Private vs. public school enrollment:
Students in private schools in grades 1 to 8 (elementary and middle school): 21
Here:
4.1%
New Hampshire:
11.4%
Students in private schools in grades 9 to 12 (high school): 13
Here:
11.3%
New Hampshire:
14.0%
Students in private undergraduate colleges:
Here:
0.0%
New Hampshire:
38.0%
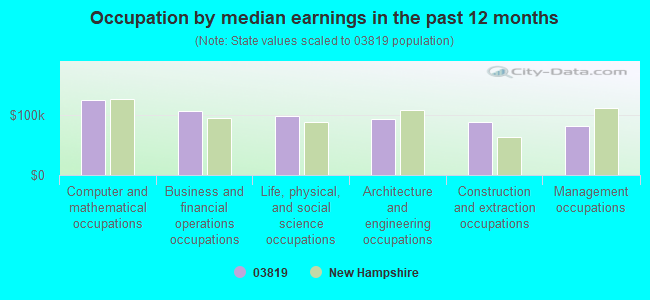
Occupation by median earnings in the past 12 months ($)
125,070Computer and mathematical occupations
106,068Business and financial operations occupations
97,389Life, physical, and social science occupations
92,370Architecture and engineering occupations
87,422Construction and extraction occupations
81,933Management occupations
Top industries in this zip code by the number of employees in 2005:
Accommodation and Food Services: Snack and Nonalcoholic Beverage Bars (10-19 employees: 1 establishment)
Construction: Plumbing, Heating, and Air-Conditioning Contractors (5-9: 1, 1-4: 3)
Construction: Painting and Wall Covering Contractors (5-9: 1, 1-4: 1)
Construction: Land Subdivision (5-9: 1, 1-4: 1)
Wholesale Trade: Wholesale Trade Agents and Brokers (5-9: 1)
Construction: Structural Steel and Precast Concrete Contractors (5-9: 1)
Health Care and Social Assistance: Child and Youth Services (5-9: 1)
People in group quarters in 2010:
3 people in other noninstitutional facilities
People in group quarters in 2000:
3 people in religious group quarters
Home Mortgage Disclosure Act Aggregated Statistics For Year 2009 (Based on 2 partial tracts)
A) FHA, FSA/RHS & VA Home Purchase Loans
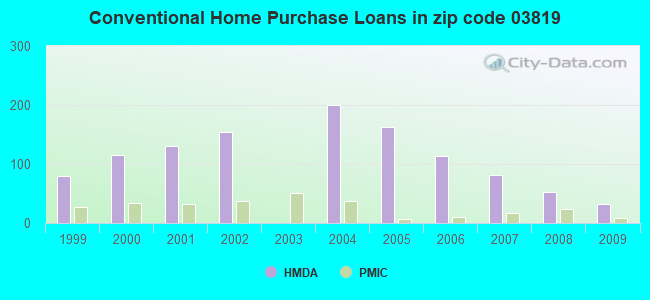
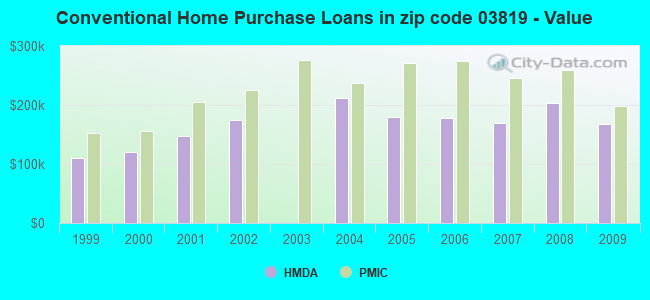
B) Conventional Home Purchase Loans
C) Refinancings
D) Home Improvement Loans
F) Non-occupant Loans on < 5 Family Dwellings (A B C & D)
G) Loans On Manufactured Home Dwelling (A B C & D)
Number
Average Value
Number
Average Value
Number
Average Value
Number
Average Value
Number
Average Value
Number
Average Value
LOANS ORIGINATED
25
$244,249
32
$168,190
236
$195,276
17
$65,892
4
$176,322
6
$34,573
APPLICATIONS APPROVED, NOT ACCEPTED
6
$225,038
2
$191,410
13
$236,741
0
$0
0
$0
0
$0
APPLICATIONS DENIED
2
$267,785
17
$85,971
119
$218,563
11
$77,318
4
$214,980
17
$41,709
APPLICATIONS WITHDRAWN
2
$243,270
11
$207,266
68
$208,936
2
$188,580
2
$239,495
4
$34,415
FILES CLOSED FOR INCOMPLETENESS
0
$0
0
$0
9
$171,398
2
$330,015
2
$197,065
2
$49,030
Aggregated Statistics For Year 2008 (Based on 2 partial tracts)
A) FHA, FSA/RHS & VA Home Purchase Loans
B) Conventional Home Purchase Loans
C) Refinancings
D) Home Improvement Loans
F) Non-occupant Loans on < 5 Family Dwellings (A B C & D)
G) Loans On Manufactured Home Dwelling (A B C & D)
Number
Average Value
Number
Average Value
Number
Average Value
Number
Average Value
Number
Average Value
Number
Average Value
LOANS ORIGINATED
25
$237,535
53
$204,093
160
$192,800
41
$109,468
19
$239,397
17
$46,591
APPLICATIONS APPROVED, NOT ACCEPTED
0
$0
21
$198,458
19
$148,284
6
$33,002
4
$172,550
4
$18,388
APPLICATIONS DENIED
4
$115,505
21
$157,509
107
$219,299
17
$58,904
9
$191,932
19
$46,450
APPLICATIONS WITHDRAWN
0
$0
8
$37,951
38
$205,899
2
$33,000
0
$0
11
$44,574
FILES CLOSED FOR INCOMPLETENESS
2
$236,670
2
$284,755
19
$244,360
0
$0
0
$0
0
$0
Aggregated Statistics For Year 2007 (Based on 2 partial tracts)
A) FHA, FSA/RHS & VA Home Purchase Loans
B) Conventional Home Purchase Loans
C) Refinancings
D) Home Improvement Loans
F) Non-occupant Loans on < 5 Family Dwellings (A B C & D)
G) Loans On Manufactured Home Dwelling (A B C & D)
Number
Average Value
Number
Average Value
Number
Average Value
Number
Average Value
Number
Average Value
Number
Average Value
LOANS ORIGINATED
4
$274,855
81
$168,930
185
$182,953
55
$56,437
6
$172,237
19
$39,106
APPLICATIONS APPROVED, NOT ACCEPTED
0
$0
6
$205,867
28
$170,463
11
$123,263
0
$0
0
$0
APPLICATIONS DENIED
0
$0
19
$97,764
155
$214,446
32
$85,568
8
$68,360
13
$41,923
APPLICATIONS WITHDRAWN
0
$0
6
$135,778
47
$166,231
4
$35,360
2
$89,575
0
$0
FILES CLOSED FOR INCOMPLETENESS
0
$0
2
$241,380
28
$236,870
2
$344,160
0
$0
0
$0
Aggregated Statistics For Year 2006 (Based on 2 partial tracts)
A) FHA, FSA/RHS & VA Home Purchase Loans
B) Conventional Home Purchase Loans
C) Refinancings
D) Home Improvement Loans
F) Non-occupant Loans on < 5 Family Dwellings (A B C & D)
G) Loans On Manufactured Home Dwelling (A B C & D)
Number
Average Value
Number
Average Value
Number
Average Value
Number
Average Value
Number
Average Value
Number
Average Value
LOANS ORIGINATED
4
$357,360
113
$177,265
256
$191,048
72
$56,548
6
$222,210
23
$52,557
APPLICATIONS APPROVED, NOT ACCEPTED
0
$0
8
$108,905
55
$174,899
6
$46,830
0
$0
2
$39,600
APPLICATIONS DENIED
0
$0
47
$97,620
155
$206,440
45
$34,908
2
$248,925
23
$58,788
APPLICATIONS WITHDRAWN
0
$0
9
$224,829
92
$180,504
9
$74,803
0
$0
0
$0
FILES CLOSED FOR INCOMPLETENESS
0
$0
2
$264,010
26
$240,004
4
$76,848
2
$264,010
2
$40,545
Aggregated Statistics For Year 2005 (Based on 2 partial tracts)
A) FHA, FSA/RHS & VA Home Purchase Loans
B) Conventional Home Purchase Loans
C) Refinancings
D) Home Improvement Loans
E) Loans on Dwellings For 5+ Families
F) Non-occupant Loans on < 5 Family Dwellings (A B C & D)
G) Loans On Manufactured Home Dwelling (A B C & D)
Number
Average Value
Number
Average Value
Number
Average Value
Number
Average Value
Number
Average Value
Number
Average Value
Number
Average Value
LOANS ORIGINATED
4
$250,340
162
$179,093
413
$196,616
57
$57,798
2
$942,900
9
$218,753
34
$59,014
APPLICATIONS APPROVED, NOT ACCEPTED
0
$0
19
$172,402
51
$195,236
6
$132,948
0
$0
0
$0
4
$49,030
APPLICATIONS DENIED
0
$0
19
$137,068
155
$184,407
38
$79,501
0
$0
4
$186,222
17
$44,039
APPLICATIONS WITHDRAWN
0
$0
30
$177,139
119
$201,305
9
$116,920
0
$0
2
$188,580
9
$36,249
FILES CLOSED FOR INCOMPLETENESS
0
$0
2
$188,580
66
$213,667
2
$51,860
0
$0
0
$0
0
$0
Aggregated Statistics For Year 2004 (Based on 2 partial tracts)
A) FHA, FSA/RHS & VA Home Purchase Loans
B) Conventional Home Purchase Loans
C) Refinancings
D) Home Improvement Loans
E) Loans on Dwellings For 5+ Families
F) Non-occupant Loans on < 5 Family Dwellings (A B C & D)
G) Loans On Manufactured Home Dwelling (A B C & D)
Number
Average Value
Number
Average Value
Number
Average Value
Number
Average Value
Number
Average Value
Number
Average Value
Number
Average Value
LOANS ORIGINATED
4
$213,568
200
$212,435
368
$176,297
43
$91,001
2
$249,870
6
$125,405
23
$63,133
APPLICATIONS APPROVED, NOT ACCEPTED
0
$0
21
$176,637
51
$170,166
8
$31,116
0
$0
4
$114,562
6
$69,147
APPLICATIONS DENIED
0
$0
49
$106,451
143
$165,476
26
$47,072
0
$0
2
$146,150
47
$67,046
APPLICATIONS WITHDRAWN
0
$0
21
$107,221
132
$175,408
9
$49,869
0
$0
0
$0
19
$53,696
FILES CLOSED FOR INCOMPLETENESS
0
$0
4
$238,082
32
$224,587
2
$23,575
0
$0
0
$0
4
$92,405
Aggregated Statistics For Year 2002 (Based on 2 partial tracts)
A) FHA, FSA/RHS & VA Home Purchase Loans
B) Conventional Home Purchase Loans
C) Refinancings
D) Home Improvement Loans
E) Loans on Dwellings For 5+ Families
F) Non-occupant Loans on < 5 Family Dwellings (A B C & D)
Number
Average Value
Number
Average Value
Number
Average Value
Number
Average Value
Number
Average Value
Number
Average Value
LOANS ORIGINATED
2
$154,635
155
$174,978
456
$144,508
40
$29,843
2
$192,350
4
$223,468
APPLICATIONS APPROVED, NOT ACCEPTED
2
$219,695
19
$130,616
51
$159,738
9
$24,306
0
$0
0
$0
APPLICATIONS DENIED
0
$0
58
$80,439
124
$116,904
43
$29,822
0
$0
6
$145,835
APPLICATIONS WITHDRAWN
0
$0
19
$148,681
53
$126,135
15
$45,259
0
$0
4
$169,250
FILES CLOSED FOR INCOMPLETENESS
0
$0
0
$0
26
$153,403
0
$0
0
$0
0
$0
Aggregated Statistics For Year 2001 (Based on 2 partial tracts)
A) FHA, FSA/RHS & VA Home Purchase Loans
B) Conventional Home Purchase Loans
C) Refinancings
D) Home Improvement Loans
F) Non-occupant Loans on < 5 Family Dwellings (A B C & D)
Number
Average Value
Number
Average Value
Number
Average Value
Number
Average Value
Number
Average Value
LOANS ORIGINATED
23
$179,643
130
$148,238
445
$136,028
47
$33,383
9
$138,711
APPLICATIONS APPROVED, NOT ACCEPTED
2
$204,610
19
$109,476
41
$128,786
8
$21,215
0
$0
APPLICATIONS DENIED
0
$0
41
$84,723
104
$128,597
19
$22,531
0
$0
APPLICATIONS WITHDRAWN
0
$0
19
$179,151
66
$144,035
21
$45,259
2
$565,740
FILES CLOSED FOR INCOMPLETENESS
0
$0
0
$0
23
$144,305
0
$0
0
$0
Aggregated Statistics For Year 2000 (Based on 2 partial tracts)
A) FHA, FSA/RHS & VA Home Purchase Loans
B) Conventional Home Purchase Loans
C) Refinancings
D) Home Improvement Loans
F) Non-occupant Loans on < 5 Family Dwellings (A B C & D)
Number
Average Value
Number
Average Value
Number
Average Value
Number
Average Value
Number
Average Value
LOANS ORIGINATED
15
$152,247
115
$120,035
102
$110,190
23
$25,253
4
$140,492
APPLICATIONS APPROVED, NOT ACCEPTED
0
$0
11
$95,833
30
$86,181
8
$21,686
2
$34,885
APPLICATIONS DENIED
2
$165,010
106
$53,728
68
$68,471
25
$29,192
0
$0
APPLICATIONS WITHDRAWN
2
$71,660
8
$157,936
32
$69,892
4
$51,388
0
$0
FILES CLOSED FOR INCOMPLETENESS
0
$0
6
$79,832
8
$138,606
0
$0
0
$0
Aggregated Statistics For Year 1999 (Based on 1 partial tract)
A) FHA, FSA/RHS & VA Home Purchase Loans
B) Conventional Home Purchase Loans
C) Refinancings
D) Home Improvement Loans
F) Non-occupant Loans on < 5 Family Dwellings (A B C & D)
Detailed PMIC statistics for the following Tracts:0530.00
2002 - 2018 National Fire Incident Reporting System (NFIRS) incidents
According to the data from the years 2002 - 2018 the average number of fire incidents per year is 13. The highest number of fires - 31 took place in 2009, and the least - 5 in 2015. The data has a dropping trend.
When looking into fire subcategories, the most reports belonged to: Structure Fires (56.4%), and Outside Fires (29.3%).
Fire incident types reported to NFIRS in Zip Code 03819


 Nearest zip codes: 03826, 03848, 03873, 03044, 03841, 03865.


 According to the data from the years 2002 - 2018 the average number of fire incidents per year is 13. The highest number of fires - 31 took place in 2009, and the least - 5 in 2015. The data has a dropping trend.
 When looking into fire subcategories, the most reports belonged to: Structure Fires (56.4%), and Outside Fires (29.3%).