Estimated zip code population in 2022: 6,297 Zip code population in 2010: 6,334 Zip code population in 2000: 6,276
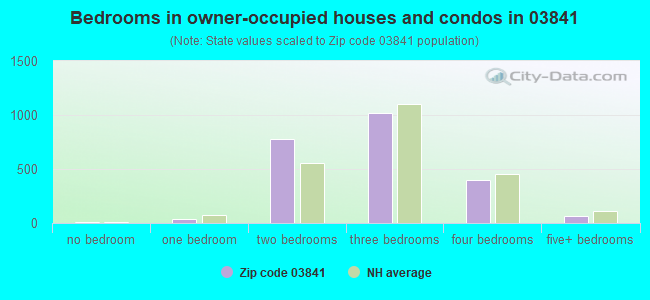
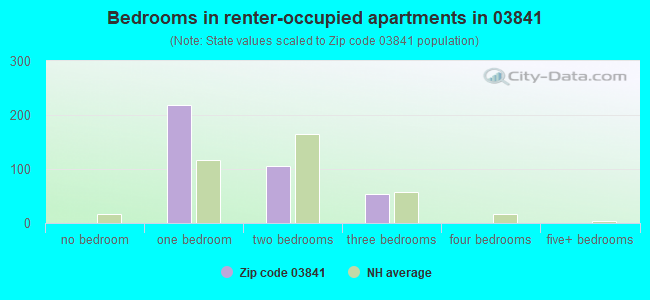
Houses and condos: 2,807 Renter-occupied apartments: 374
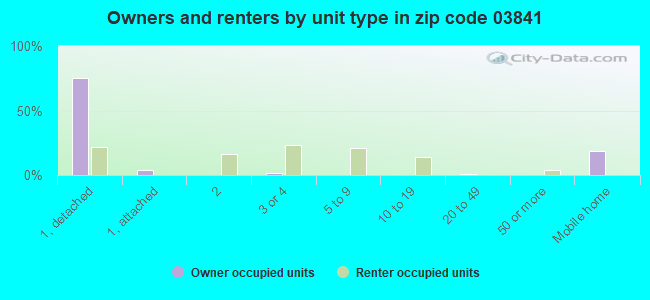
% of renters here:
14%
State:
28%
March 2022 cost of living index in zip code 03841: 131.9 (high, U.S. average is 100)
Land area: 10.8 sq. mi. Water area: 0.7 sq. mi.
Population density: 583 people per square mile
(low).
OSM Map
Google Map
MSN Map
OSM Map
General Map
Google Map
MSN Map
OSM Map
Google Map
MSN Map
OSM Map
Google Map
MSN Map
Please wait while loading the map...
Real estate property taxes paid for housing units in 2022:
This zip code:
1.5% ($7,762)
New Hampshire:
1.6% ($6,209)
Median real estate property taxes paid for housing units with mortgages in 2022: $7,798 (1.5%) Median real estate property taxes paid for housing units with no mortgage in 2022: $7,753 (1.6%)
Business Search- 14 Million verified businesses
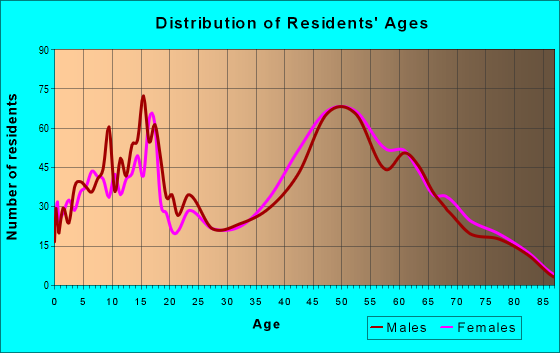
Males: 2,991
(47.5%)
Females: 3,306
(52.5%)
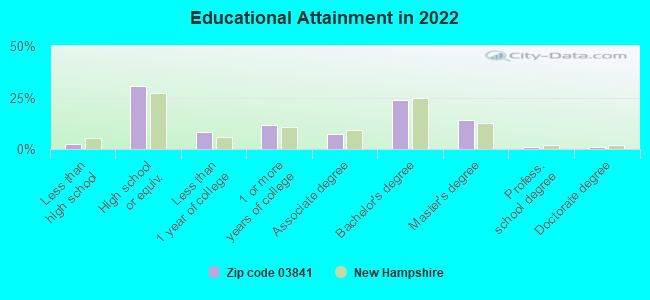
For population 25 years and over in 03841:
High school or higher: 97.8%
Bachelor's degree or higher: 39.7%
Graduate or professional degree: 16.0%
Unemployed: 1.0%
Mean travel time to work (commute): 31.3 minutes
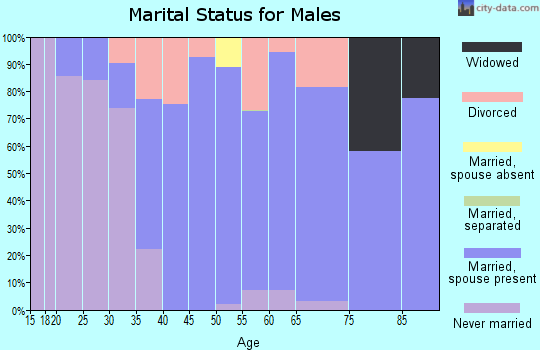
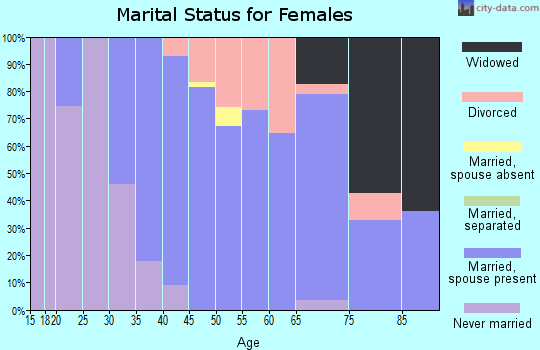
For population 15 years and over in 03841:
Never married: 23.2%
Now married: 58.8%
Separated: 1.6%
Widowed: 8.0%
Divorced: 8.4%
Zip code 03841 compared to state average:
Unemployed percentage below state average.
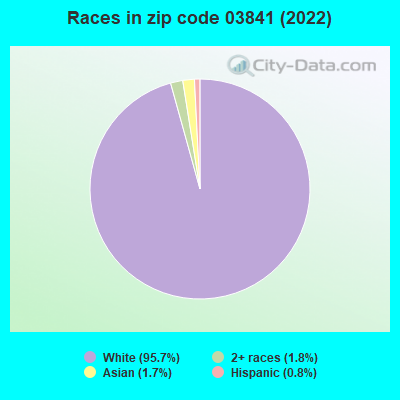
Black race population percentage significantly below state average.
Hispanic race population percentage significantly below state average.
Median age significantly above state average.
Foreign-born population percentage below state average.
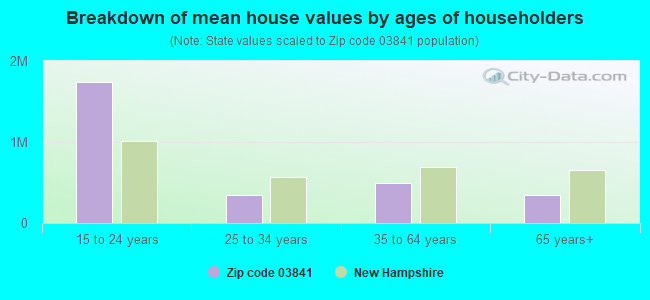
Estimated median house/condo value in 2022: $503,385
03841:
$503,385
New Hampshire:
$384,700
According to our research of New Hampshire and other state lists, there were 9 registered sex offenders living in 03841 zip code as of May 17, 2024. The ratio of all residents to sex offenders in zip code 03841 is 724 to 1. The ratio of registered sex offenders to all residents in this zip code is lower than the state average.
Median resident age:
This zip code:
51.4 years
New Hampshire median age:
43.3 years
Average household size:
This zip code:
2.4 people
New Hampshire:
2.4 people
Averages for the 2020 tax year for zip code 03841, filed in 2021:
Average Adjusted Gross Income (AGI) in 2020: $95,876 (Individual Income Tax Returns)
Here:
$95,876
State:
$88,845
Salary/wage: $84,021 (reported on 81.4% of returns)
Here:
$84,021
State:
$71,693
(% of AGI for various income ranges: 1078.2% for AGIs below $25k, 3563.4% for AGIs $25k-50k, 6447.4% for AGIs $50k-75k, 8940.9% for AGIs $75k-100k, 19847.9% for AGIs $100k-200k, 72540.0% for AGIs over 200k)
Taxable interest for individuals: $1,339 (reported on 43.3% of returns)
This zip code:
$1,339
New Hampshire:
$1,640
(% of AGI for various income ranges: 24.0% for AGIs below $25k, 23.4% for AGIs $25k-50k, 73.8% for AGIs $50k-75k, 70.4% for AGIs $75k-100k, 90.0% for AGIs $100k-200k, 867.3% for AGIs over 200k)
Ordinary dividends: $4,878 (reported on 27.5% of returns)
Here:
$4,878
State:
$8,258
(% of AGI for various income ranges: 51.2% for AGIs below $25k, 45.9% for AGIs $25k-50k, 85.6% for AGIs $50k-75k, 296.1% for AGIs $75k-100k, 252.1% for AGIs $100k-200k, 1857.3% for AGIs over 200k)
Net capital gain/loss in AGI: +$22,767 (reported on 24.9% of returns)
Here:
+$22,767
State:
+$28,952
(% of AGI for various income ranges: 21.8% for AGIs below $25k, 54.5% for AGIs $25k-50k, 127.6% for AGIs $50k-75k, 272.6% for AGIs $75k-100k, 463.8% for AGIs $100k-200k, 14700.9% for AGIs over 200k)
Profit/loss from business: +$29,118 (reported on 15.8% of returns)
Here:
+$29,118
State:
+$24,424
(% of AGI for various income ranges: 117.6% for AGIs below $25k, 232.0% for AGIs $25k-50k, 505.9% for AGIs $50k-75k, 527.4% for AGIs $75k-100k, 762.3% for AGIs $100k-200k, 7103.6% for AGIs over 200k)
Taxable individual retirement arrangement distribution: $19,231 (reported on 14.6% of returns)
03841:
$19,231
New Hampshire:
$21,952
(% of AGI for various income ranges: 146.2% for AGIs below $25k, 199.5% for AGIs $25k-50k, 360.3% for AGIs $50k-75k, 488.3% for AGIs $75k-100k, 800.8% for AGIs $100k-200k, 1824.5% for AGIs over 200k)
Self-employed (Keogh) retirement plans: $20,025 (reported on 1.1% of returns)
03841:
$20,025
New Hampshire:
$24,779
(% of AGI for various income ranges: 166.9% for AGIs $100k-200k)
Total itemized deductions: $26,340 (reported on 13.5% of returns)
Here:
$26,340
State:
$32,702
(% of AGI for various income ranges: 186.0% for AGIs below $25k, 155.7% for AGIs $25k-50k, 473.5% for AGIs $50k-75k, 659.6% for AGIs $75k-100k, 1020.6% for AGIs $100k-200k, 2490.0% for AGIs over 200k)
Charity contributions: $3,817 (reported on 10.0% of returns)
Here:
$3,817
State:
$9,866
(% of AGI for various income ranges: 10.0% for AGIs $25k-50k, 19.4% for AGIs $50k-75k, 46.1% for AGIs $75k-100k, 127.5% for AGIs $100k-200k, 461.8% for AGIs over 200k)
Taxes paid: $8,898 (reported on 12.9% of returns)
03841:
$8,898
State:
$8,247
(% of AGI for various income ranges: 32.0% for AGIs below $25k, 47.7% for AGIs $25k-50k, 156.2% for AGIs $50k-75k, 241.3% for AGIs $75k-100k, 347.9% for AGIs $100k-200k, 798.2% for AGIs over 200k)
Earned income credit: $1,541 (reported on 4.9% of returns)
Here:
$1,541
State:
$1,831
(% of AGI for various income ranges: 35.0% for AGIs below $25k, 19.8% for AGIs $25k-50k)
Percentage of individuals using paid preparers for their 2020 taxes: 92.8%
Here:
93%
State:
92%
(% for various income ranges: 92.7% for AGIs below $25k, 91.8% for AGIs $25k-50k, 92.0% for AGIs $50k-75k, 91.4% for AGIs $75k-100k, 94.3% for AGIs $100k-200k, 94.1% for AGIs over 200k)
Averages for the 2012 tax year for zip code 03841, filed in 2013:
Average Adjusted Gross Income (AGI) in 2012: $81,594 (Individual Income Tax Returns)
Here:
$81,594
State:
$66,185
Salary/wage: $67,873 (reported on 82.9% of returns)
Here:
$67,873
State:
$55,674
(% of AGI for various income ranges: 68.8% for AGIs below $25k, 68.8% for AGIs $25k-50k, 68.5% for AGIs $50k-75k, 76.9% for AGIs $75k-100k, 82.3% for AGIs $100k-200k, 51.7% for AGIs over 200k)
Taxable interest for individuals: $1,127 (reported on 42.6% of returns)
This zip code:
$1,127
New Hampshire:
$1,674
(% of AGI for various income ranges: 1.5% for AGIs below $25k, 0.8% for AGIs $25k-50k, 0.7% for AGIs $50k-75k, 0.5% for AGIs $75k-100k, 0.3% for AGIs $100k-200k, 0.7% for AGIs over 200k)
Ordinary dividends: $3,379 (reported on 29.1% of returns)
Here:
$3,379
State:
$6,774
(% of AGI for various income ranges: 3.2% for AGIs below $25k, 1.6% for AGIs $25k-50k, 1.0% for AGIs $50k-75k, 1.0% for AGIs $75k-100k, 1.0% for AGIs $100k-200k, 1.2% for AGIs over 200k)
Net capital gain/loss in AGI: +$8,015 (reported on 22.5% of returns)
Here:
+$8,015
State:
+$13,759
(% of AGI for various income ranges: 0.3% for AGIs $50k-75k, 0.9% for AGIs $75k-100k, 0.6% for AGIs $100k-200k, 6.0% for AGIs over 200k)
Profit/loss from business: +$23,491 (reported on 16.2% of returns)
Here:
+$23,491
State:
+$19,298
(% of AGI for various income ranges: 7.4% for AGIs below $25k, 4.9% for AGIs $25k-50k, 6.6% for AGIs $50k-75k, 3.9% for AGIs $75k-100k, 4.2% for AGIs $100k-200k, 4.3% for AGIs over 200k)
Taxable individual retirement arrangement distribution: $16,800 (reported on 13.2% of returns)
03841:
$16,800
New Hampshire:
$16,908
(% of AGI for various income ranges: 4.9% for AGIs below $25k, 4.8% for AGIs $25k-50k, 4.0% for AGIs $50k-75k, 5.5% for AGIs $75k-100k, 2.2% for AGIs $100k-200k, 1.1% for AGIs over 200k)
Self-employment retirement plans: $22,475 (reported on 1.2% of returns)
03841:
$22,475
New Hampshire:
$18,791
Total itemized deductions: $23,520 (17% of AGI, reported on 45.9% of returns)
Here:
$23,520
State:
$22,617
Here:
17.0% of AGI
State:
18.1% of AGI
(% of AGI for various income ranges: 14.5% for AGIs below $25k, 13.2% for AGIs $25k-50k, 17.3% for AGIs $50k-75k, 17.1% for AGIs $75k-100k, 15.6% for AGIs $100k-200k, 7.8% for AGIs over 200k)
Charity contributions: $2,124 (reported on 38.1% of returns)
Here:
$2,124
State:
$2,860
(% of AGI for various income ranges: 0.7% for AGIs below $25k, 0.7% for AGIs $25k-50k, 0.9% for AGIs $50k-75k, 1.1% for AGIs $75k-100k, 1.2% for AGIs $100k-200k, 0.9% for AGIs over 200k)
Taxes paid: $10,288 (reported on 45.6% of returns)
03841:
$10,288
State:
$8,830
(% of AGI for various income ranges: 4.8% for AGIs below $25k, 4.5% for AGIs $25k-50k, 6.5% for AGIs $50k-75k, 6.8% for AGIs $75k-100k, 7.1% for AGIs $100k-200k, 4.1% for AGIs over 200k)
Earned income credit: $1,760 (reported on 6.0% of returns)
Here:
$1,760
State:
$1,863
(% of AGI for various income ranges: 2.3% for AGIs below $25k, 0.4% for AGIs $25k-50k)
Percentage of individuals using paid preparers for their 2012 taxes: 51.7%
Here:
52%
State:
45%
(% for various income ranges: 40.2% for AGIs below $25k, 50.0% for AGIs $25k-50k, 57.4% for AGIs $50k-75k, 57.1% for AGIs $75k-100k, 60.9% for AGIs $100k-200k, 63.2% for AGIs over 200k)
Averages for the 2004 tax year for zip code 03841, filed in 2005:
Average Adjusted Gross Income (AGI) in 2004: $69,217 (Individual Income Tax Returns)
Here:
$69,217
State:
$54,348
Salary/wage: $61,926 (reported on 84.5% of returns)
Here:
$61,926
State:
$46,966
(% of AGI for various income ranges: 128.3% for AGIs below $10k, 58.9% for AGIs $10k-25k, 72.9% for AGIs $25k-50k, 78.2% for AGIs $50k-75k, 85.9% for AGIs $75k-100k, 73.4% for AGIs over 100k)
Taxable interest for individuals: $1,259 (reported on 60.5% of returns)
This zip code:
$1,259
New Hampshire:
$1,634
(% of AGI for various income ranges: 6.3% for AGIs below $10k, 3.1% for AGIs $10k-25k, 1.6% for AGIs $25k-50k, 1.4% for AGIs $50k-75k, 0.6% for AGIs $75k-100k, 0.9% for AGIs over 100k)
Taxable dividends: $2,051 (reported on 37.1% of returns)
Here:
$2,051
State:
$3,855
(% of AGI for various income ranges: 5.6% for AGIs below $10k, 2.5% for AGIs $10k-25k, 1.5% for AGIs $25k-50k, 1.0% for AGIs $50k-75k, 0.9% for AGIs $75k-100k, 1.0% for AGIs over 100k)
Net capital gain/loss: +$6,882 (reported on 30.8% of returns)
Here:
+$6,882
State:
+$13,739
(% of AGI for various income ranges: -5.2% for AGIs below $10k, -0.2% for AGIs $10k-25k, 1.1% for AGIs $25k-50k, 1.3% for AGIs $50k-75k, -0.1% for AGIs $75k-100k, 4.8% for AGIs over 100k)
Profit/loss from business: +$21,080 (reported on 17.8% of returns)
Here:
+$21,080
State:
+$16,641
(% of AGI for various income ranges: 0.0% for AGIs below $10k, 9.4% for AGIs $10k-25k, 7.2% for AGIs $25k-50k, 6.3% for AGIs $50k-75k, 4.1% for AGIs $75k-100k, 5.1% for AGIs over 100k)
IRA payment deduction: $3,202 (reported on 4.3% of returns)
03841:
$3,202
New Hampshire:
$3,013
(% of AGI for various income ranges: 0.4% for AGIs $10k-25k, 0.5% for AGIs $25k-50k, 0.4% for AGIs $50k-75k, 0.2% for AGIs $75k-100k, 0.1% for AGIs over 100k)
Self-employed pension: $11,740 (reported on 1.7% of returns)
Here:
$11,740
New Hampshire:
$13,003
Total itemized deductions: $20,547 (20% of AGI, reported on 51.3% of returns)
Here:
$20,547
State:
$18,832
Here:
20.1% of AGI
State:
19.6% of AGI
(% of AGI for various income ranges: 23.0% for AGIs below $10k, 19.5% for AGIs $10k-25k, 16.0% for AGIs $25k-50k, 20.2% for AGIs $50k-75k, 20.7% for AGIs $75k-100k, 12.4% for AGIs over 100k)
Charity contributions deductions: $2,031 (2% of AGI, reported on 46.4% of returns)
Here:
$2,031
State:
$2,473
Here:
1.9% of AGI
State:
2.4% of AGI
(% of AGI for various income ranges: 0.9% for AGIs below $10k, 1.3% for AGIs $10k-25k, 1.1% for AGIs $25k-50k, 1.5% for AGIs $50k-75k, 1.8% for AGIs $75k-100k, 1.3% for AGIs over 100k)
Total tax: $12,169 (reported on 81.1% of returns)
03841:
$12,169
State:
$8,835
(% of AGI for various income ranges: 4.4% for AGIs below $10k, 5.1% for AGIs $10k-25k, 8.1% for AGIs $25k-50k, 9.1% for AGIs $50k-75k, 9.5% for AGIs $75k-100k, 18.2% for AGIs over 100k)
Earned income credit: $1,240 (reported on 4.1% of returns)
Here:
$1,240
State:
$1,447
Percentage of individuals using paid preparers for their 2004 taxes: 55.1%
Here:
55%
State:
51%
(% for various income ranges: 40.1% for AGIs below $10k, 53.7% for AGIs $10k-25k, 57.2% for AGIs $25k-50k, 65.5% for AGIs $50k-75k, 59.5% for AGIs $75k-100k, 59.9% for AGIs over 100k)
Likely homosexual households (counted as self-reported same-sex unmarried-partner households)
Lesbian couples: 0.0% of all households
Gay men: 0.5% of all households
Household received Food Stamps/SNAP in the past 12 months: 34 Household did not receive Food Stamps/SNAP in the past 12 months: 2,630
Women who had a birth in the past 12 months: 13 (11 now married, 0 unmarried) Women who did not have a birth in the past 12 months: 1,170 (553 now married, 618 unmarried)
Housing units in zip code 03841 with a mortgage: 1,184 (169 second mortgage, 179 both second mortgage and home equity loan) Houses without a mortgage: 18
Median monthly owner costs for units with a mortgage: $2,523 Median monthly owner costs for units without a mortgage: $1,155
Residents with income below the poverty level in 2022:
This zip code:
2.1%
Whole state:
7.2%
Residents with income below 50% of the poverty level in 2022:
This zip code:
0.1%
Whole state:
3.7%
Median number of rooms in houses and condos:
Here:
6.7
State:
6.4
Median number of rooms in apartments:
Here:
3.2
State:
4.0
Notable locations in this zip code not listed on our city pages
In group quarters: 13 (-1 institutionalized population)
Size of family households: 892 2-persons, 416 3-persons, 299 4-persons, 179 5-persons, 31 6-persons
Size of nonfamily households: 677 1-person, 181 2-persons
933 married couples with children.
126 single-parent households (5 men, 121 women).
95.4% of residents of 03841 zip code speak English at home.
0.7% of residents speak Spanish at home (78% very well, 20% well, 2% not at all).
2.2% of residents speak other Indo-European language at home (48% very well, 26% well, 26% not well).
2.0% of residents speak Asian or Pacific Island language at home (100% very well).
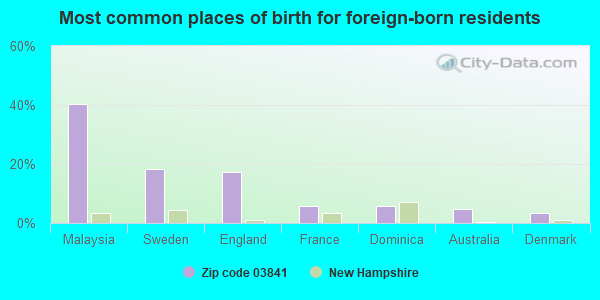
Foreign born population: 233 (3.7%) (32.2% of them are naturalized citizens)
This zip code:
3.7%
Whole state:
6.2%
40%Malaysia
18%Sweden
17%England
6%France
6%Dominica
5%Australia
3%Denmark
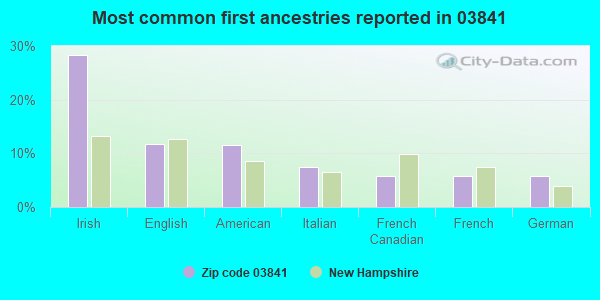
28%Irish
12%English
11%American
8%Italian
6%French Canadian
6%French
6%German
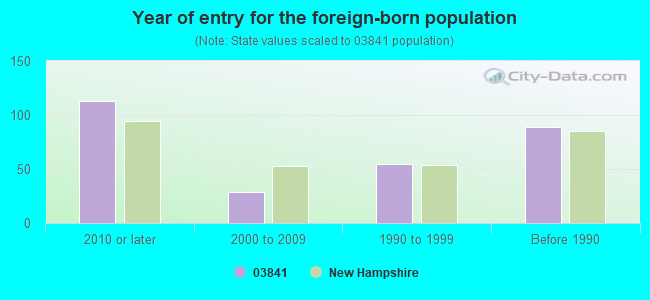
Year of entry for the foreign-born population
1132010 or later
292000 to 2009
551990 to 1999
89Before 1990
Major facilities with environmental interests located in this zip code:
HAMPSTEAD CENTRAL SCHOOL (21 EMERSON AVENUE in HAMPSTEAD, NH)
(Geographic Names Information System) COMPLIANCE ACTIVITY (Tracking inspections of insecticide, fungicide, and rodenticide, and toxic substances) (National Center for Education Statistics) - STATE ID-75522322322755 (Resource Conservation and Recovery Act (tracking hazardous waste)) Organizations: HAMPSTEAD SCHOOL DISTRICT (CONTACT/OPERATOR)
Alternative names: HAMPSTEAD SCHOOL DISTRICT
T E AUTOMOTIVE (313 KENT FARM RD in HAMPSTEAD, NH)
STATE MASTER (New Hampshire water, air, and waste tracking) - HAZARDOUS WASTE PROGRAM (Resource Conservation and Recovery Act (tracking hazardous waste))
HANNAFORD FOOD & DRUG (305 MAIN ST in HAMPSTEAD, NH)
STATE MASTER (New Hampshire water, air, and waste tracking) - HAZARDOUS WASTE PROGRAM (Resource Conservation and Recovery Act (tracking hazardous waste))
BARLOW ARCHITECTUAL MILLWORK LLC (30 GIGANTE DR in HAMPSTEAD, NH)
STATE MASTER (New Hampshire water, air, and waste tracking) - AIR PROGRAM, HAZARDOUS WASTE PROGRAM Conditionally Exempt Small Quantity Generators, less than 100 kg/month of hazardous waste (Resource Conservation and Recovery Act (tracking hazardous waste)) Alternative names: D E BARLOW
HAMPSTEAD MIDDLE SCHOOL (26 SCHOOL RD in HAMPSTEAD, NH)
(National Center for Education Statistics) - STATE ID-75522322322750 Organizations: HAMPSTEAD SCHOOL DISTRICT (SCHOOL DISTRICT)
HAMPSTEAD PRE SCHOOL (26 SCHOOL RD in HAMPSTEAD, NH)
(National Center for Education Statistics) - STATE ID-75522322327645 Organizations: HAMPSTEAD SCHOOL DISTRICT (SCHOOL DISTRICT)
THUNDERLINE Z (11 HAZEL DR in HAMPSTEAD, NH)
CRITERIA AND HAZARDOUS AIR POLLUTANT INVENTORY (Inventory of air pollution sources) Conditionally Exempt Small Quantity Generators, less than 100 kg/month of hazardous waste (Resource Conservation and Recovery Act (tracking hazardous waste)) HAZARDOUS WASTE BIENNIAL REPORTER (Resource Conservation and Recovery Act (tracking hazardous waste)) TRI REPORTER (Tracking of toxic chemicals releasing facilities) Business SIC classification: ELECTRONIC CONNECTORS Business NAICS classification: ALL OTHER MISCELLANEOUS CHEMICAL PRODUCT AND PREPARATION MANUFACTURING.; GLASS PRODUCT MANUFACTURING MADE OF PURCHASED GLASS. Organizations: EMERSON ELECTRIC CO (CONTACT/OPERATOR)
Alternative names: THUNDER-Z INC.
EDGEFIELD VETERINARY HOSPITAL (269A STAGE RD in HAMPSTEAD, NH)
(Resource Conservation and Recovery Act (tracking hazardous waste)) Organizations: WILLIAM PATRICIAPHILLIPS (CONTACT/OPERATOR)
HAMPSTEAD TOWN OF (17 LITTLES LANE in HAMPSTEAD, NH)
(Resource Conservation and Recovery Act (tracking hazardous waste)) Organizations: TOWN OF HAMPSTEAD (CONTACT/OPERATOR)
HANS` FOREIGN AUTO REPAIR (42 BROWN HILL RD in HAMPSTEAD, NH)
(Resource Conservation and Recovery Act (tracking hazardous waste)) Business NAICS classification: OTHER AUTOMOTIVE MECHANICAL AND ELECTRICAL REPAIR AND MAINTENANCE.; ALL OTHER AUTOMOTIVE REPAIR AND MAINTENANCE. Organizations: HANSNIGL (CONTACT/OPERATOR)
Alternative names: HANS FOREIGN AUTO REPAIR
EXCALIBUR PRECISION MACHINE CO (10 GIGANTE DR in HAMPSTEAD, NH)
HAZARDOUS WASTE BIENNIAL REPORTER (Resource Conservation and Recovery Act (tracking hazardous waste)) (Resource Conservation and Recovery Act (tracking hazardous waste)) Business NAICS classification: ALL OTHER MISCELLANEOUS MANUFACTURING.
DIFEO-DUSTON OIL (478 MAIN ST in HAMPSTEAD, NH)
HAZARDOUS WASTE BIENNIAL REPORTER (Resource Conservation and Recovery Act (tracking hazardous waste)) (Resource Conservation and Recovery Act (tracking hazardous waste))
SKAFF CRYOGENICS (10 HAZEL DR in HAMPSTEAD, NH)
HAZARDOUS WASTE BIENNIAL REPORTER (Resource Conservation and Recovery Act (tracking hazardous waste)) (Resource Conservation and Recovery Act (tracking hazardous waste)) Business NAICS classification: MILITARY ARMORED VEHICLE, TANK, AND TANK COMPONENT MANUFACTURING.
Housing units lacking complete plumbing facilities: 0.9% Housing units lacking complete kitchen facilities: 0.3%
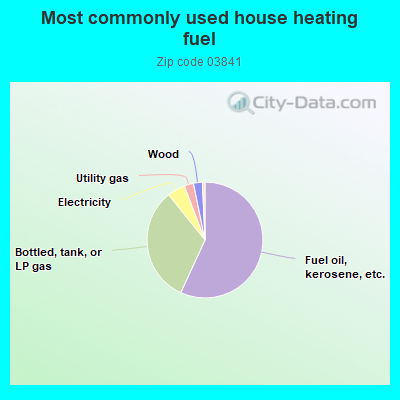
57.0%Fuel oil, kerosene, etc.
32.4%Bottled, tank, or LP gas
5.0%Electricity
2.6%Utility gas
2.5%Wood
0.7%Other fuel
Population in 1990: 5,291. Population change in the 1990s: +985 (+18.6%).
Place of birth for U.S.-born residents:
This state: 920
Northeast: 4,513
Midwest: 203
South: 239
West: 94
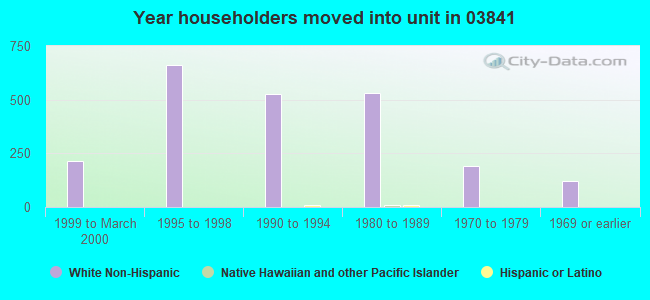
63% of the 03841 zip code residents lived in the same house 5 years ago. Out of people who lived in different houses, 55% lived in this county. Out of people who lived in different counties, 50% lived in New Hampshire.
95% of the 03841 zip code residents lived in the same house 1 year ago. Out of people who lived in different houses, 55% moved from this county. Out of people who lived in different houses, 6% moved from different county within same state. Out of people who lived in different houses, 45% moved from different state.
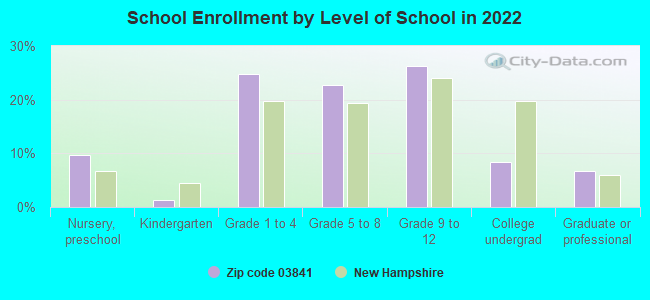
Private vs. public school enrollment:
Students in private schools in grades 1 to 8 (elementary and middle school): 32
Here:
5.3%
New Hampshire:
11.4%
Students in private schools in grades 9 to 12 (high school):
Here:
0.0%
New Hampshire:
14.0%
Students in private undergraduate colleges: 57
Here:
52.7%
New Hampshire:
38.0%
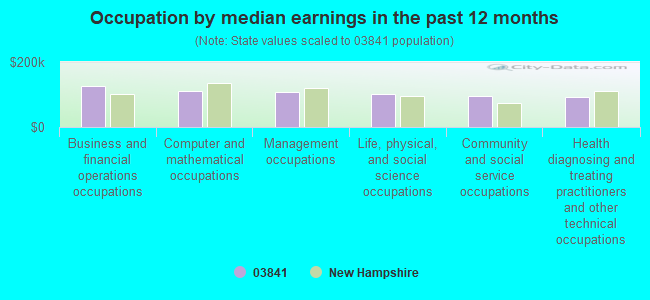
Occupation by median earnings in the past 12 months ($)
127,372Business and financial operations occupations
112,496Computer and mathematical occupations
109,341Management occupations
100,734Life, physical, and social science occupations
94,962Community and social service occupations
93,063Health diagnosing and treating practitioners and other technical occupations
Companies with federal contracts located in this zip code (HAMPSTEAD, NH):
PRIME POWER, INC (13 GIGANTE DRIVE; small business) : $1,826,425 in 5 contractsfrom 2003 to 2005
Contracts for Converters, Electrical, Nonrotating by Army, National Oceanic and Atmospheric Administration/Under Secretary for Oceans and Atmosphere Signed by year:2000: $0; 2001: $0; 2002: $0; 2003: $63,750; 2004: $685,904; 2005: $1,076,771; 2006: $0.
Biggest contracts:
$1,104,096 with Army for Converters, Electrical, Nonrotating. Signed on 2005-04-14. Completion date: 2006-11-17.
$685,904, same as above.Signed on 2004-09-22. Completion date: 2006-11-17.
$63,750 with National Oceanic and Atmospheric Administration/Under Secretary for Oceans and Atmosphere for Converters, Electrical, Nonrotating. Signed on 2003-11-05. Completion date: 2004-02-16.
$0, same as above.Signed on 2003-12-18. Completion date: 2004-02-16.
LAND AND SEA, INC (#138, ROUTE 111; small business) : $299,039 in 28 contractsfrom 2000 to 2006
Contracts for Diesel Engines and Components, Motor Vehicle Maintenance and Repair Shop Specialized Equipment, Miscellaneous Maintenance and Repair Shop Specialized Equipment, Electrical and Electronic Properties Measuring and Testing Instruments, and moreby Army, Air Force, Navy, NASA, and others Signed by year:2000: $42,635; 2001: $0; 2002: $0; 2003: $45,945; 2004: $60,048; 2005: $135,610; 2006: $14,801.
Biggest contracts:
$45,945 with Army for Diesel Engines and Components. Signed on 2003-09-23. Completion date: 2003-10-31.
$42,635 with Army for Motor Vehicle Maintenance and Repair Shop Specialized Equipment. Signed on 2000-09-19. Completion date: 2000-10-30.
$40,756 with Army for Miscellaneous Maintenance and Repair Shop Specialized Equipment. Signed on 2005-09-21. Completion date: 2005-10-24.
$29,950 with Air Force for Motor Vehicle Maintenance and Repair Shop Specialized Equipment. Signed on 2004-07-15. Completion date: 2004-08-14.
ENVIRONMENTAL RESTORATIONS INC (10 HAZEL DR; small business) : $46,576 in 4 contractsfrom 2004 to 2006
$20,869 with Army for Maintenance, Repair or Alteration of Real Property -- Other Non-Building Facilities. Taking place in ME. Signed on 2006-06-22. Completion date: 2006-06-30.
$15,828 with U.S. Coast Guard for Maintenance, Repair or Alteration of Real Property -- Other Administrative Facilities and Service Buildings. Taking place in MA. Signed on 2004-12-06. Completion date: 2005-12-18.
$9,879, same as above.Signed on 2004-12-20. Completion date: 2005-12-18.
$0, same as above.Signed on 2005-08-19. Completion date: 2005-08-19.
D.E. BARLOW & SON (30 GIGANTE DR; small business)
$2,774 with U.S. Army Corps of Engineers - civil program financing only for Installation of Equipment -- Woodworking Machinery and Equipment. Taking place in MA. Signed on 2002-05-15. Completion date: 2002-06-20.
Top industries in this zip code by the number of employees in 2005:
Health Care and Social Assistance: Psychiatric and Substance Abuse Hospitals (100-249 employees: 1 establishment)
Administrative and Support and Waste Management and Remediation Services: Temporary Help Services (50-99: 1)
Accommodation and Food Services: Caterers (50-99: 1)
Other Services (except Public Administration): Religious Organizations (10-19: 3, 5-9: 1, 1-4: 1)
Accommodation and Food Services: Full-Service Restaurants (20-49: 1, 10-19: 1)
Health Care and Social Assistance: Offices of Physicians (except Mental Health Specialists) (20-49: 1, 5-9: 2)
Health Care and Social Assistance: Child Day Care Services (20-49: 1, 5-9: 1, 1-4: 2)
People in group quarters in 2010:
4 people in group homes intended for adults
People in group quarters in 2000:
3 people in other noninstitutional group quarters
Fatal accident statistics in 2012:
Fatal accident count: 2
Vehicles involved in fatal accidents: 4
Fatal accidents caused by drunken drivers: 0
Fatalities: 2
Persons involved in fatal accidents: 11
Pedestrians involved in fatal accidents: 0
Fatal accident statistics in 2010:
Fatal accident count: 2
Vehicles involved in fatal accidents: 4
Fatal accidents caused by drunken drivers: 1
Fatalities: 2
Persons involved in fatal accidents: 6
Pedestrians involved in fatal accidents: 0
Home Mortgage Disclosure Act Aggregated Statistics For Year 2009 (Based on 2 partial tracts)
A) FHA, FSA/RHS & VA Home Purchase Loans
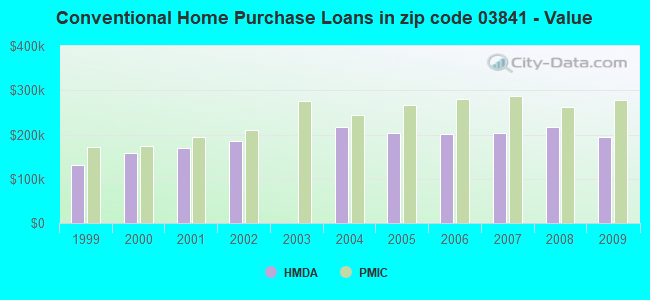
B) Conventional Home Purchase Loans
C) Refinancings
D) Home Improvement Loans
F) Non-occupant Loans on < 5 Family Dwellings (A B C & D)
G) Loans On Manufactured Home Dwelling (A B C & D)
Number
Average Value
Number
Average Value
Number
Average Value
Number
Average Value
Number
Average Value
Number
Average Value
LOANS ORIGINATED
53
$233,207
96
$194,431
481
$214,924
20
$125,562
17
$194,082
19
$46,601
APPLICATIONS APPROVED, NOT ACCEPTED
5
$325,846
9
$195,242
38
$257,606
0
$0
2
$85,300
0
$0
APPLICATIONS DENIED
19
$216,752
10
$269,719
150
$222,280
14
$122,344
2
$71,650
9
$67,671
APPLICATIONS WITHDRAWN
5
$163,094
12
$208,132
92
$220,018
3
$381,577
3
$232,583
2
$18,765
FILES CLOSED FOR INCOMPLETENESS
2
$178,275
3
$153,540
34
$272,860
3
$204,720
0
$0
2
$17,060
Aggregated Statistics For Year 2008 (Based on 2 partial tracts)
A) FHA, FSA/RHS & VA Home Purchase Loans
B) Conventional Home Purchase Loans
C) Refinancings
D) Home Improvement Loans
F) Non-occupant Loans on < 5 Family Dwellings (A B C & D)
G) Loans On Manufactured Home Dwelling (A B C & D)
Number
Average Value
Number
Average Value
Number
Average Value
Number
Average Value
Number
Average Value
Number
Average Value
LOANS ORIGINATED
20
$218,965
126
$217,894
246
$226,343
43
$101,567
43
$216,979
7
$76,526
APPLICATIONS APPROVED, NOT ACCEPTED
2
$160,365
20
$212,824
36
$220,738
7
$157,196
10
$182,883
2
$8,530
APPLICATIONS DENIED
9
$216,093
17
$214,053
174
$241,752
24
$182,187
15
$265,340
3
$254,763
APPLICATIONS WITHDRAWN
0
$0
17
$218,569
58
$240,193
2
$394,085
3
$333,240
5
$85,982
FILES CLOSED FOR INCOMPLETENESS
0
$0
7
$265,893
14
$149,884
0
$0
2
$59,710
0
$0
Aggregated Statistics For Year 2007 (Based on 2 partial tracts)
A) FHA, FSA/RHS & VA Home Purchase Loans
B) Conventional Home Purchase Loans
C) Refinancings
D) Home Improvement Loans
E) Loans on Dwellings For 5+ Families
F) Non-occupant Loans on < 5 Family Dwellings (A B C & D)
G) Loans On Manufactured Home Dwelling (A B C & D)
Number
Average Value
Number
Average Value
Number
Average Value
Number
Average Value
Number
Average Value
Number
Average Value
Number
Average Value
LOANS ORIGINATED
5
$315,610
164
$202,920
278
$217,865
80
$106,070
2
$2,985,500
12
$248,508
24
$81,319
APPLICATIONS APPROVED, NOT ACCEPTED
3
$349,160
29
$248,664
46
$196,746
9
$107,099
0
$0
5
$206,426
2
$72,505
APPLICATIONS DENIED
3
$415,697
22
$254,194
143
$235,201
38
$71,383
0
$0
10
$261,871
7
$40,213
APPLICATIONS WITHDRAWN
0
$0
14
$174,743
82
$278,057
9
$72,600
0
$0
2
$201,310
0
$0
FILES CLOSED FOR INCOMPLETENESS
0
$0
5
$202,672
31
$255,350
3
$239,410
0
$0
0
$0
0
$0
Aggregated Statistics For Year 2006 (Based on 2 partial tracts)
A) FHA, FSA/RHS & VA Home Purchase Loans
B) Conventional Home Purchase Loans
C) Refinancings
D) Home Improvement Loans
F) Non-occupant Loans on < 5 Family Dwellings (A B C & D)
G) Loans On Manufactured Home Dwelling (A B C & D)
Number
Average Value
Number
Average Value
Number
Average Value
Number
Average Value
Number
Average Value
Number
Average Value
LOANS ORIGINATED
3
$305,943
276
$200,832
392
$199,750
96
$74,282
31
$174,122
15
$112,141
APPLICATIONS APPROVED, NOT ACCEPTED
0
$0
15
$189,707
55
$195,446
19
$90,597
2
$251,635
0
$0
APPLICATIONS DENIED
2
$238,840
48
$202,836
164
$230,196
39
$57,873
10
$305,033
2
$115,155
APPLICATIONS WITHDRAWN
0
$0
29
$166,835
89
$221,818
5
$118,738
5
$110,890
5
$105,430
FILES CLOSED FOR INCOMPLETENESS
0
$0
12
$237,134
38
$241,893
2
$17,060
2
$91,270
0
$0
Aggregated Statistics For Year 2005 (Based on 2 partial tracts)
A) FHA, FSA/RHS & VA Home Purchase Loans
B) Conventional Home Purchase Loans
C) Refinancings
D) Home Improvement Loans
E) Loans on Dwellings For 5+ Families
F) Non-occupant Loans on < 5 Family Dwellings (A B C & D)
G) Loans On Manufactured Home Dwelling (A B C & D)
Number
Average Value
Number
Average Value
Number
Average Value
Number
Average Value
Number
Average Value
Number
Average Value
Number
Average Value
LOANS ORIGINATED
2
$194,485
268
$203,606
464
$203,165
82
$89,586
2
$426,500
22
$242,175
22
$78,554
APPLICATIONS APPROVED, NOT ACCEPTED
0
$0
31
$163,446
53
$183,347
9
$28,054
0
$0
0
$0
7
$75,064
APPLICATIONS DENIED
2
$85,300
49
$149,989
179
$216,929
36
$39,901
0
$0
15
$150,469
14
$94,926
APPLICATIONS WITHDRAWN
0
$0
36
$218,937
131
$221,936
7
$213,981
0
$0
2
$336,080
3
$85,300
FILES CLOSED FOR INCOMPLETENESS
0
$0
3
$267,273
41
$202,390
2
$226,900
0
$0
0
$0
0
$0
Aggregated Statistics For Year 2004 (Based on 2 partial tracts)
A) FHA, FSA/RHS & VA Home Purchase Loans
B) Conventional Home Purchase Loans
C) Refinancings
D) Home Improvement Loans
E) Loans on Dwellings For 5+ Families
F) Non-occupant Loans on < 5 Family Dwellings (A B C & D)
G) Loans On Manufactured Home Dwelling (A B C & D)
Number
Average Value
Number
Average Value
Number
Average Value
Number
Average Value
Number
Average Value
Number
Average Value
Number
Average Value
LOANS ORIGINATED
0
$0
252
$216,709
536
$191,508
67
$128,001
3
$679,557
34
$167,138
15
$82,911
APPLICATIONS APPROVED, NOT ACCEPTED
2
$231,165
26
$185,954
77
$208,686
14
$33,389
0
$0
2
$162,070
0
$0
APPLICATIONS DENIED
3
$346,887
36
$224,055
145
$188,801
41
$41,277
0
$0
3
$102,930
10
$133,409
APPLICATIONS WITHDRAWN
0
$0
29
$200,367
116
$198,293
20
$117,714
0
$0
10
$214,274
2
$63,120
FILES CLOSED FOR INCOMPLETENESS
0
$0
9
$207,184
41
$235,178
2
$63,975
0
$0
0
$0
0
$0
Aggregated Statistics For Year 2002 (Based on 2 partial tracts)
A) FHA, FSA/RHS & VA Home Purchase Loans
B) Conventional Home Purchase Loans
C) Refinancings
D) Home Improvement Loans
E) Loans on Dwellings For 5+ Families
F) Non-occupant Loans on < 5 Family Dwellings (A B C & D)
Number
Average Value
Number
Average Value
Number
Average Value
Number
Average Value
Number
Average Value
Number
Average Value
LOANS ORIGINATED
7
$168,407
193
$184,805
940
$158,714
44
$51,451
2
$520,330
22
$143,071
APPLICATIONS APPROVED, NOT ACCEPTED
0
$0
20
$190,560
96
$122,814
22
$39,548
0
$0
2
$126,245
APPLICATIONS DENIED
0
$0
34
$143,705
125
$143,645
12
$23,315
0
$0
2
$65,680
APPLICATIONS WITHDRAWN
0
$0
20
$256,668
94
$146,353
10
$26,102
0
$0
0
$0
FILES CLOSED FOR INCOMPLETENESS
0
$0
9
$111,838
32
$179,770
0
$0
0
$0
0
$0
Aggregated Statistics For Year 2001 (Based on 2 partial tracts)
A) FHA, FSA/RHS & VA Home Purchase Loans
B) Conventional Home Purchase Loans
C) Refinancings
D) Home Improvement Loans
E) Loans on Dwellings For 5+ Families
F) Non-occupant Loans on < 5 Family Dwellings (A B C & D)
Number
Average Value
Number
Average Value
Number
Average Value
Number
Average Value
Number
Average Value
Number
Average Value
LOANS ORIGINATED
12
$159,227
188
$169,847
739
$154,046
53
$46,352
0
$0
31
$120,741
APPLICATIONS APPROVED, NOT ACCEPTED
2
$94,685
22
$138,341
73
$153,166
9
$29,002
0
$0
3
$78,477
APPLICATIONS DENIED
0
$0
41
$116,424
96
$106,732
26
$35,235
0
$0
5
$166,506
APPLICATIONS WITHDRAWN
0
$0
20
$207,535
90
$134,926
14
$34,120
2
$341,200
3
$135,343
FILES CLOSED FOR INCOMPLETENESS
0
$0
3
$199,033
14
$118,811
2
$81,035
0
$0
2
$85,300
Aggregated Statistics For Year 2000 (Based on 2 partial tracts)
A) FHA, FSA/RHS & VA Home Purchase Loans
B) Conventional Home Purchase Loans
C) Refinancings
D) Home Improvement Loans
F) Non-occupant Loans on < 5 Family Dwellings (A B C & D)
Number
Average Value
Number
Average Value
Number
Average Value
Number
Average Value
Number
Average Value
LOANS ORIGINATED
22
$182,930
242
$157,297
179
$135,641
46
$31,116
14
$96,754
APPLICATIONS APPROVED, NOT ACCEPTED
0
$0
26
$174,668
32
$90,365
19
$32,773
2
$122,830
APPLICATIONS DENIED
5
$116,690
34
$141,247
60
$84,874
32
$20,205
0
$0
APPLICATIONS WITHDRAWN
5
$176,060
14
$188,269
65
$94,801
12
$26,585
3
$29,003
FILES CLOSED FOR INCOMPLETENESS
0
$0
10
$107,819
10
$161,899
2
$185,955
3
$72,790
Aggregated Statistics For Year 1999 (Based on 1 partial tract)
A) FHA, FSA/RHS & VA Home Purchase Loans
B) Conventional Home Purchase Loans
C) Refinancings
D) Home Improvement Loans
F) Non-occupant Loans on < 5 Family Dwellings (A B C & D)
Detailed PMIC statistics for the following Tracts:1041.00
2002 - 2018 National Fire Incident Reporting System (NFIRS) incidents
According to the data from the years 2002 - 2018 the average number of fire incidents per year is 17. The highest number of fires - 30 took place in 2002, and the least - 3 in 2006. The data has a constant trend.
When looking into fire subcategories, the most reports belonged to: Structure Fires (55.8%), and Outside Fires (30.0%).
Fire incident types reported to NFIRS in Zip Code 03841


 Nearest zip codes: 03811, 03873, 03826, 03819, 03038, 03865.


 According to the data from the years 2002 - 2018 the average number of fire incidents per year is 17. The highest number of fires - 30 took place in 2002, and the least - 3 in 2006. The data has a constant trend.
 When looking into fire subcategories, the most reports belonged to: Structure Fires (55.8%), and Outside Fires (30.0%).