Estimated zip code population in 2022: 6,610 Zip code population in 2010: 5,711 Zip code population in 2000: 5,205
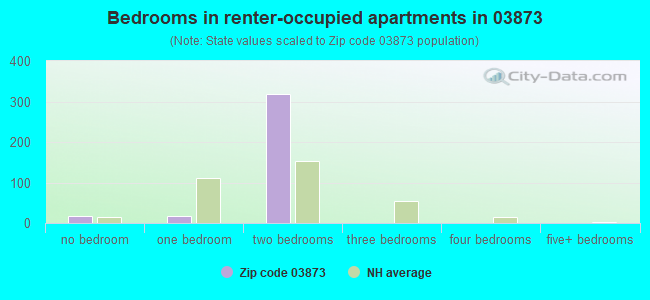
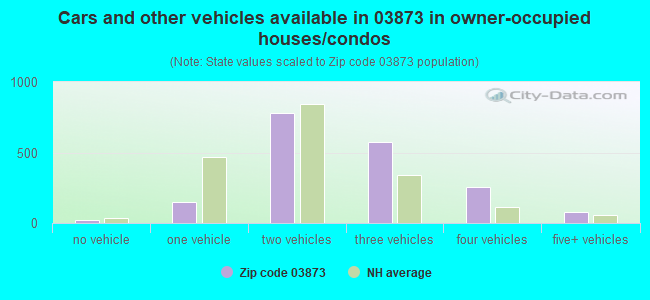
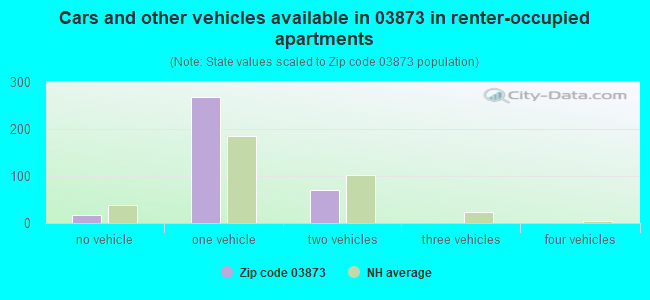
Houses and condos: 2,303 Renter-occupied apartments: 348
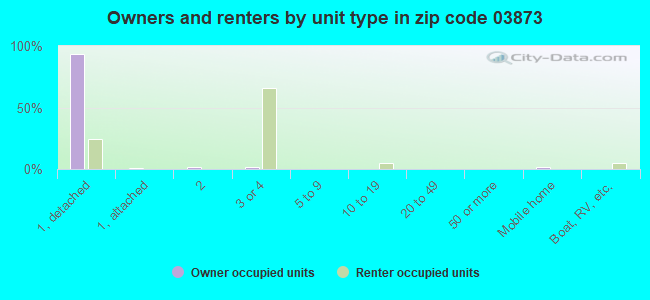
% of renters here:
15%
State:
28%
March 2022 cost of living index in zip code 03873: 132.1 (high, U.S. average is 100)
Land area: 13.3 sq. mi. Water area: 0.5 sq. mi.
Population density: 497 people per square mile
(low).
OSM Map
Google Map
MSN Map
OSM Map
General Map
Google Map
MSN Map
OSM Map
Google Map
MSN Map
OSM Map
Google Map
MSN Map
Please wait while loading the map...
Real estate property taxes paid for housing units in 2022:
This zip code:
1.9% ($8,078)
New Hampshire:
1.6% ($6,209)
Median real estate property taxes paid for housing units with mortgages in 2022: $8,119 (1.8%) Median real estate property taxes paid for housing units with no mortgage in 2022: $7,952 (2.0%)
Business Search- 14 Million verified businesses
Males: 3,117
(47.2%)
Females: 3,492
(52.8%)
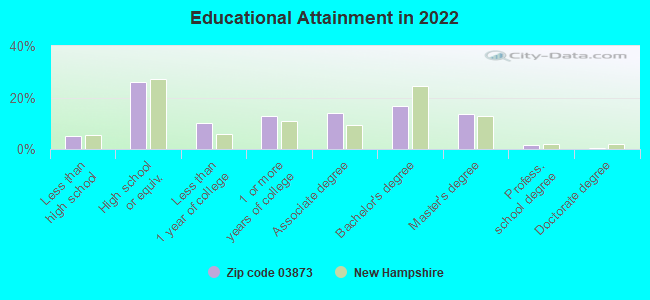
For population 25 years and over in 03873:
High school or higher: 93.9%
Bachelor's degree or higher: 31.5%
Graduate or professional degree: 15.2%
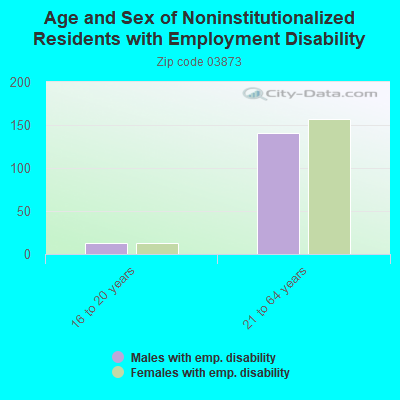
Unemployed: 3.2%
Mean travel time to work (commute): 34.2 minutes
For population 15 years and over in 03873:
Never married: 27.1%
Now married: 61.3%
Separated: 3.4%
Widowed: 1.9%
Divorced: 6.2%
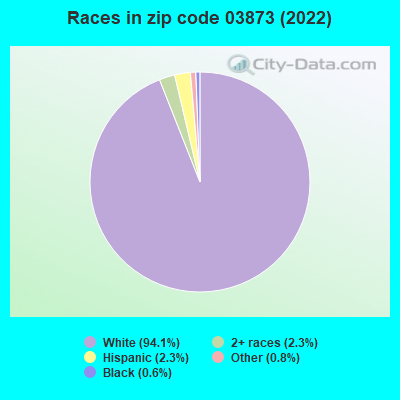
Zip code 03873 compared to state average:
Black race population percentage below state average.
Hispanic race population percentage below state average.
Median age below state average.
Renting percentage below state average.
Length of stay since moving in above state average.
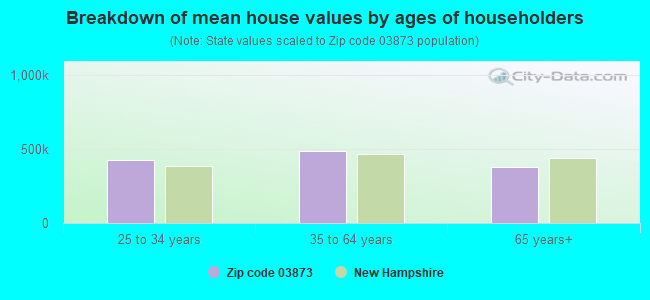
Estimated median house/condo value in 2022: $427,723
03873:
$427,723
New Hampshire:
$384,700
According to our research of New Hampshire and other state lists, there were 3 registered sex offenders living in 03873 zip code as of May 28, 2024. The ratio of all residents to sex offenders in zip code 03873 is 2,049 to 1. The ratio of registered sex offenders to all residents in this zip code is much lower than the state average.
Median resident age:
This zip code:
39.0 years
New Hampshire median age:
43.3 years
Average household size:
This zip code:
2.9 people
New Hampshire:
2.4 people
Averages for the 2020 tax year for zip code 03873, filed in 2021:
Average Adjusted Gross Income (AGI) in 2020: $81,609 (Individual Income Tax Returns)
Here:
$81,609
State:
$88,845
Salary/wage: $73,881 (reported on 88.0% of returns)
Here:
$73,881
State:
$71,693
(% of AGI for various income ranges: 1214.6% for AGIs below $25k, 3585.0% for AGIs $25k-50k, 6472.1% for AGIs $50k-75k, 9963.2% for AGIs $75k-100k, 19208.3% for AGIs $100k-200k, 52654.4% for AGIs over 200k)
Taxable interest for individuals: $557 (reported on 35.2% of returns)
This zip code:
$557
New Hampshire:
$1,640
(% of AGI for various income ranges: 19.6% for AGIs below $25k, 23.6% for AGIs $25k-50k, 34.6% for AGIs $50k-75k, 24.3% for AGIs $75k-100k, 36.2% for AGIs $100k-200k, 73.3% for AGIs over 200k)
Ordinary dividends: $2,313 (reported on 19.5% of returns)
Here:
$2,313
State:
$8,258
(% of AGI for various income ranges: 33.3% for AGIs below $25k, 35.4% for AGIs $25k-50k, 61.3% for AGIs $50k-75k, 43.9% for AGIs $75k-100k, 107.2% for AGIs $100k-200k, 317.8% for AGIs over 200k)
Net capital gain/loss in AGI: +$10,163 (reported on 16.3% of returns)
Here:
+$10,163
State:
+$28,952
(% of AGI for various income ranges: 14.3% for AGIs below $25k, 41.4% for AGIs $25k-50k, 79.5% for AGIs $50k-75k, 67.5% for AGIs $75k-100k, 469.1% for AGIs $100k-200k, 2804.4% for AGIs over 200k)
Profit/loss from business: +$23,304 (reported on 16.0% of returns)
Here:
+$23,304
State:
+$24,424
(% of AGI for various income ranges: 102.4% for AGIs below $25k, 238.2% for AGIs $25k-50k, 355.9% for AGIs $50k-75k, 471.4% for AGIs $75k-100k, 786.2% for AGIs $100k-200k, 4923.3% for AGIs over 200k)
Taxable individual retirement arrangement distribution: $20,043 (reported on 8.6% of returns)
03873:
$20,043
New Hampshire:
$21,952
(% of AGI for various income ranges: 68.9% for AGIs below $25k, 99.0% for AGIs $25k-50k, 178.7% for AGIs $50k-75k, 323.2% for AGIs $75k-100k, 412.1% for AGIs $100k-200k, 1511.1% for AGIs over 200k)
Self-employed (Keogh) retirement plans: $19,200 (reported on 0.6% of returns)
03873:
$19,200
New Hampshire:
$24,779
(% of AGI for various income ranges: 72.5% for AGIs $100k-200k)
Total itemized deductions: $23,670 (reported on 10.6% of returns)
Here:
$23,670
State:
$32,702
(% of AGI for various income ranges: 92.6% for AGIs below $25k, 104.6% for AGIs $25k-50k, 389.7% for AGIs $50k-75k, 518.2% for AGIs $75k-100k, 654.0% for AGIs $100k-200k, 1442.2% for AGIs over 200k)
Charity contributions: $4,043 (reported on 6.6% of returns)
Here:
$4,043
State:
$9,866
(% of AGI for various income ranges: 5.4% for AGIs below $25k, 11.5% for AGIs $50k-75k, 39.6% for AGIs $75k-100k, 76.4% for AGIs $100k-200k, 377.8% for AGIs over 200k)
Taxes paid: $8,638 (reported on 10.6% of returns)
03873:
$8,638
State:
$8,247
(% of AGI for various income ranges: 34.6% for AGIs below $25k, 36.2% for AGIs $25k-50k, 167.9% for AGIs $50k-75k, 204.6% for AGIs $75k-100k, 233.4% for AGIs $100k-200k, 403.3% for AGIs over 200k)
Earned income credit: $1,805 (reported on 6.3% of returns)
Here:
$1,805
State:
$1,831
(% of AGI for various income ranges: 40.0% for AGIs below $25k, 36.2% for AGIs $25k-50k)
Percentage of individuals using paid preparers for their 2020 taxes: 93.1%
Here:
93%
State:
92%
(% for various income ranges: 90.1% for AGIs below $25k, 93.8% for AGIs $25k-50k, 94.3% for AGIs $50k-75k, 92.5% for AGIs $75k-100k, 95.5% for AGIs $100k-200k, 90.5% for AGIs over 200k)
Averages for the 2012 tax year for zip code 03873, filed in 2013:
Average Adjusted Gross Income (AGI) in 2012: $62,021 (Individual Income Tax Returns)
Here:
$62,021
State:
$66,185
Salary/wage: $59,121 (reported on 88.5% of returns)
Here:
$59,121
State:
$55,674
(% of AGI for various income ranges: 75.0% for AGIs below $25k, 80.7% for AGIs $25k-50k, 83.0% for AGIs $50k-75k, 84.1% for AGIs $75k-100k, 87.5% for AGIs $100k-200k, 84.2% for AGIs over 200k)
Taxable interest for individuals: $512 (reported on 33.4% of returns)
This zip code:
$512
New Hampshire:
$1,674
(% of AGI for various income ranges: 1.0% for AGIs below $25k, 0.3% for AGIs $25k-50k, 0.3% for AGIs $50k-75k, 0.2% for AGIs $75k-100k, 0.2% for AGIs $100k-200k)
Ordinary dividends: $1,979 (reported on 18.2% of returns)
Here:
$1,979
State:
$6,774
(% of AGI for various income ranges: 1.1% for AGIs below $25k, 0.9% for AGIs $25k-50k, 0.6% for AGIs $50k-75k, 0.5% for AGIs $75k-100k, 0.4% for AGIs $100k-200k, 0.6% for AGIs over 200k)
Net capital gain/loss in AGI: +$3,158 (reported on 11.5% of returns)
Here:
+$3,158
State:
+$13,759
(% of AGI for various income ranges: 0.2% for AGIs $50k-75k, 0.8% for AGIs $100k-200k, 2.6% for AGIs over 200k)
Profit/loss from business: +$15,151 (reported on 15.6% of returns)
Here:
+$15,151
State:
+$19,298
(% of AGI for various income ranges: 8.2% for AGIs below $25k, 7.2% for AGIs $25k-50k, 4.4% for AGIs $50k-75k, 3.4% for AGIs $75k-100k, 3.0% for AGIs $100k-200k)
Taxable individual retirement arrangement distribution: $16,375 (reported on 8.9% of returns)
03873:
$16,375
New Hampshire:
$16,908
(% of AGI for various income ranges: 3.7% for AGIs below $25k, 1.9% for AGIs $25k-50k, 2.2% for AGIs $50k-75k, 2.6% for AGIs $75k-100k, 2.7% for AGIs $100k-200k)
Total itemized deductions: $20,399 (22% of AGI, reported on 46.8% of returns)
Here:
$20,399
State:
$22,617
Here:
21.7% of AGI
State:
18.1% of AGI
(% of AGI for various income ranges: 13.0% for AGIs below $25k, 13.9% for AGIs $25k-50k, 20.0% for AGIs $50k-75k, 16.4% for AGIs $75k-100k, 15.2% for AGIs $100k-200k, 10.3% for AGIs over 200k)
Charity contributions: $1,568 (reported on 35.4% of returns)
Here:
$1,568
State:
$2,860
(% of AGI for various income ranges: 0.5% for AGIs below $25k, 0.7% for AGIs $25k-50k, 0.9% for AGIs $50k-75k, 0.9% for AGIs $75k-100k, 1.0% for AGIs $100k-200k, 0.9% for AGIs over 200k)
Taxes paid: $8,557 (reported on 46.5% of returns)
03873:
$8,557
State:
$8,830
(% of AGI for various income ranges: 4.1% for AGIs below $25k, 5.0% for AGIs $25k-50k, 7.7% for AGIs $50k-75k, 6.6% for AGIs $75k-100k, 6.8% for AGIs $100k-200k, 5.6% for AGIs over 200k)
Earned income credit: $1,878 (reported on 8.6% of returns)
Here:
$1,878
State:
$1,863
(% of AGI for various income ranges: 3.0% for AGIs below $25k, 0.7% for AGIs $25k-50k)
Percentage of individuals using paid preparers for their 2012 taxes: 47.8%
Here:
48%
State:
45%
(% for various income ranges: 38.4% for AGIs below $25k, 45.9% for AGIs $25k-50k, 55.3% for AGIs $50k-75k, 53.7% for AGIs $75k-100k, 54.2% for AGIs $100k-200k, 57.1% for AGIs over 200k)
Averages for the 2004 tax year for zip code 03873, filed in 2005:
Average Adjusted Gross Income (AGI) in 2004: $54,333 (Individual Income Tax Returns)
Here:
$54,333
State:
$54,348
Salary/wage: $50,513 (reported on 90.6% of returns)
Here:
$50,513
State:
$46,966
(% of AGI for various income ranges: 108.4% for AGIs below $10k, 72.9% for AGIs $10k-25k, 84.0% for AGIs $25k-50k, 87.0% for AGIs $50k-75k, 89.4% for AGIs $75k-100k, 80.0% for AGIs over 100k)
Taxable interest for individuals: $508 (reported on 52.0% of returns)
This zip code:
$508
New Hampshire:
$1,634
(% of AGI for various income ranges: 3.3% for AGIs below $10k, 1.2% for AGIs $10k-25k, 0.6% for AGIs $25k-50k, 0.3% for AGIs $50k-75k, 0.5% for AGIs $75k-100k, 0.4% for AGIs over 100k)
Taxable dividends: $1,407 (reported on 22.7% of returns)
Here:
$1,407
State:
$3,855
(% of AGI for various income ranges: 1.4% for AGIs below $10k, 1.2% for AGIs $10k-25k, 0.7% for AGIs $25k-50k, 0.2% for AGIs $50k-75k, 0.6% for AGIs $75k-100k, 0.7% for AGIs over 100k)
Net capital gain/loss: +$7,982 (reported on 16.8% of returns)
Here:
+$7,982
State:
+$13,739
(% of AGI for various income ranges: -1.7% for AGIs below $10k, -0.3% for AGIs $10k-25k, -0.2% for AGIs $25k-50k, 0.1% for AGIs $50k-75k, 1.4% for AGIs $75k-100k, 6.1% for AGIs over 100k)
Profit/loss from business: +$15,330 (reported on 16.1% of returns)
Here:
+$15,330
State:
+$16,641
(% of AGI for various income ranges: 6.5% for AGIs below $10k, 10.0% for AGIs $10k-25k, 5.7% for AGIs $25k-50k, 3.2% for AGIs $50k-75k, 3.4% for AGIs $75k-100k, 4.8% for AGIs over 100k)
IRA payment deduction: $2,580 (reported on 2.6% of returns)
03873:
$2,580
New Hampshire:
$3,013
Self-employed pension: $15,400 (reported on 0.6% of returns)
Here:
$15,400
New Hampshire:
$13,003
Total itemized deductions: $18,398 (23% of AGI, reported on 54.1% of returns)
Here:
$18,398
State:
$18,832
Here:
23.4% of AGI
State:
19.6% of AGI
(% of AGI for various income ranges: 16.4% for AGIs below $10k, 16.3% for AGIs $10k-25k, 20.7% for AGIs $25k-50k, 21.4% for AGIs $50k-75k, 19.9% for AGIs $75k-100k, 14.7% for AGIs over 100k)
Charity contributions deductions: $1,425 (2% of AGI, reported on 47.5% of returns)
Here:
$1,425
State:
$2,473
Here:
1.8% of AGI
State:
2.4% of AGI
(% of AGI for various income ranges: 1.0% for AGIs below $10k, 0.7% for AGIs $10k-25k, 1.1% for AGIs $25k-50k, 1.2% for AGIs $50k-75k, 1.3% for AGIs $75k-100k, 1.3% for AGIs over 100k)
Total tax: $7,114 (reported on 82.3% of returns)
03873:
$7,114
State:
$8,835
(% of AGI for various income ranges: 3.1% for AGIs below $10k, 5.2% for AGIs $10k-25k, 7.0% for AGIs $25k-50k, 7.8% for AGIs $50k-75k, 9.4% for AGIs $75k-100k, 15.9% for AGIs over 100k)
Earned income credit: $1,498 (reported on 8.1% of returns)
Here:
$1,498
State:
$1,447
Percentage of individuals using paid preparers for their 2004 taxes: 53.7%
Here:
54%
State:
51%
(% for various income ranges: 36.3% for AGIs below $10k, 52.8% for AGIs $10k-25k, 55.6% for AGIs $25k-50k, 60.7% for AGIs $50k-75k, 59.9% for AGIs $75k-100k, 58.6% for AGIs over 100k)
Likely homosexual households (counted as self-reported same-sex unmarried-partner households)
Lesbian couples: 1.8% of all households
Gay men: 0.5% of all households
Household received Food Stamps/SNAP in the past 12 months: 35 Household did not receive Food Stamps/SNAP in the past 12 months: 2,211
Women who had a birth in the past 12 months: 58 (52 now married, 0 unmarried) Women who did not have a birth in the past 12 months: 1,478 (693 now married, 786 unmarried)
Housing units in zip code 03873 with a mortgage: 1,482 (129 second mortgage, 96 both second mortgage and home equity loan) Houses without a mortgage: 187
Median monthly owner costs for units with a mortgage: $2,361 Median monthly owner costs for units without a mortgage: $1,041
Residents with income below the poverty level in 2022:
This zip code:
10.2%
Whole state:
7.2%
Residents with income below 50% of the poverty level in 2022:
This zip code:
5.9%
Whole state:
3.7%
Median number of rooms in houses and condos:
Here:
6.4
State:
6.4
Median number of rooms in apartments:
Here:
4.0
State:
4.0
Notable locations in this zip code not listed on our city pages
Notable locations in zip code 03873: Angle Pond Campground (A), Sandown Fire and Rescue Substation (B), Sandown Fire and Rescue (C), Sandown Town Hall (D). Display/hide their locations on the map
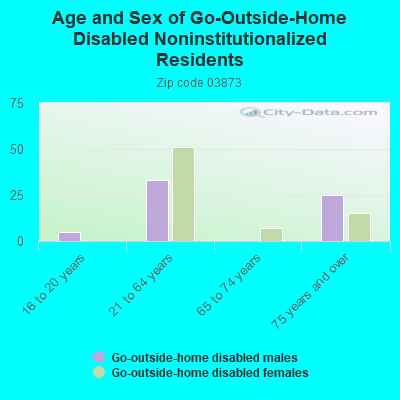
In group quarters: 4 (-1 institutionalized population)
Size of family households: 679 2-persons, 575 3-persons, 446 4-persons, 158 5-persons, 26 6-persons, 34 7-or-more-persons
Size of nonfamily households: 205 1-person, 118 2-persons
745 married couples with children.
481 single-parent households (206 men, 275 women).
96.9% of residents of 03873 zip code speak English at home.
1.0% of residents speak Spanish at home (61% very well, 37% well, 2% not at all).
1.2% of residents speak other Indo-European language at home (99% very well, 1% not well).
0.4% of residents speak other language at home (50% very well, 50% well).
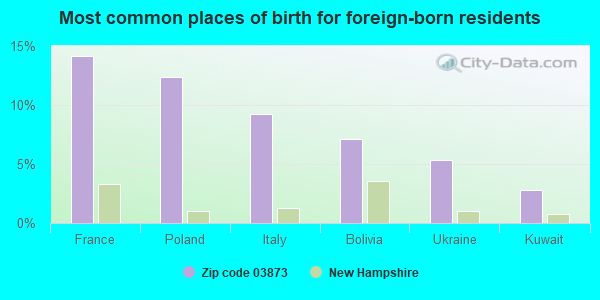
Foreign born population: 287 (4.4%) (55.9% of them are naturalized citizens)
This zip code:
4.4%
Whole state:
6.2%
14%France
12%Poland
9%Italy
7%Bolivia
5%Ukraine
3%Kuwait
21%American
17%Irish
11%Greek
11%English
7%French Canadian
6%French
6%Italian
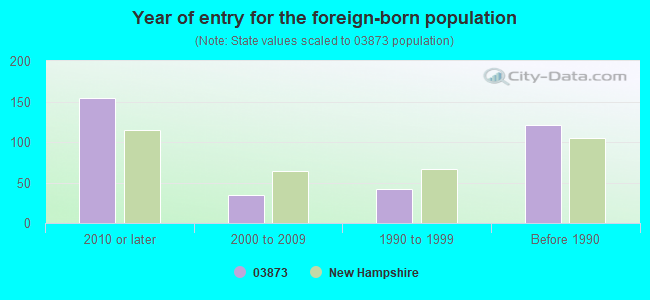
Year of entry for the foreign-born population
1542010 or later
342000 to 2009
421990 to 1999
121Before 1990
Major facilities with environmental interests located in this zip code:
ROGER JETTES AUTO REPAIR INC (2 HAWKWOOD RD in SANDOWN, NH)
STATE MASTER (New Hampshire water, air, and waste tracking) - HAZARDOUS WASTE PROGRAM Conditionally Exempt Small Quantity Generators, less than 100 kg/month of hazardous waste (Resource Conservation and Recovery Act (tracking hazardous waste)) - notification USED OIL PROGRAM (Resource Conservation and Recovery Act (tracking hazardous waste)) Business NAICS classification: GENERAL AUTOMOTIVE REPAIR. Organizations: ROGERJETTE (CONTACT/OPERATOR)
SANDOWN CENTRAL SCHOOL (295 MAIN ST in SANDOWN, NH)
(Geographic Names Information System) (National Center for Education Statistics) - STATE ID-75553447922775 Organizations: TIMBERLANE REGIONAL SCHOOL DISTRICT (SCHOOL DISTRICT)
SANDOWN NORTH ELEMENTARY SCHOOL (23 STAGECOACH RD in SANDOWN, NH)
(National Center for Education Statistics) - STATE ID-75553453427910 Organizations: TIMBERLANE REGIONAL SCHOOL DISTRICT (SCHOOL DISTRICT)
BATCHELDER GARY RESIDENCE (24 CHASE RD in SANDOWN, NH)
(Resource Conservation and Recovery Act (tracking hazardous waste))
BRITTON RUTH RESIDENCE (33 LAKE SIDE DR in SANDOWN, NH)
(Resource Conservation and Recovery Act (tracking hazardous waste))
COOPER JULIE (335 MAIN ST in SANDOWN, NH)
(Resource Conservation and Recovery Act (tracking hazardous waste))
DOWNS AUTOMOTIVE (219 MAIN ST in SANDOWN, NH)
(Resource Conservation and Recovery Act (tracking hazardous waste))
SAINT MATTHEWS UNITED METHODIST CHURCH (324 N MAIN ST in SANDOWN, NH)
(Resource Conservation and Recovery Act (tracking hazardous waste))
SANDOWN FIRE DEPT (RTE 121A in SANDOWN, NH)
(Resource Conservation and Recovery Act (tracking hazardous waste))
SANDOWN SANITATION DEPT TOWN OF (DEPOT ST in SANDOWN, NH)
(Resource Conservation and Recovery Act (tracking hazardous waste))
SENTER BROS INC (151 MAIN ST in SANDOWN, NH)
(Resource Conservation and Recovery Act (tracking hazardous waste))
TURCOTTE MICHAEL & HELEN RES (6 CRICKET LN in SANDOWN, NH)
(Resource Conservation and Recovery Act (tracking hazardous waste))
UPRIGHT CRANE SERVICE (11 HAZEL DR in SANDOWN, NH)
(Resource Conservation and Recovery Act (tracking hazardous waste))
Housing units lacking complete plumbing facilities: 0.7% Housing units lacking complete kitchen facilities: 0.7%
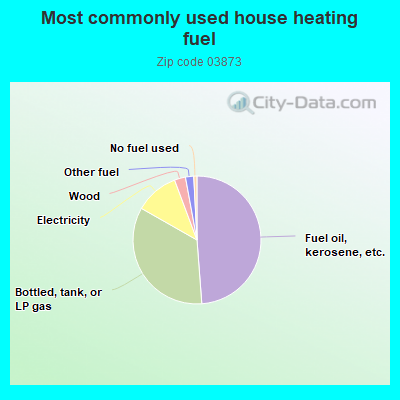
48.9%Fuel oil, kerosene, etc.
34.5%Bottled, tank, or LP gas
11.1%Electricity
2.8%Wood
2.1%Other fuel
0.8%No fuel used
Population in 1990: 4,060. Population change in the 1990s: +1,145 (+28.2%).
Place of birth for U.S.-born residents:
This state: 1,559
Northeast: 4,160
Midwest: 55
South: 131
West: 323
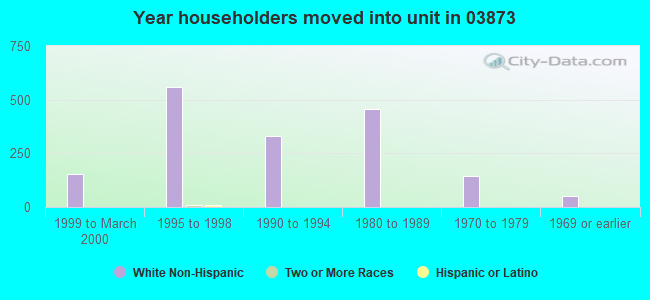
65% of the 03873 zip code residents lived in the same house 5 years ago. Out of people who lived in different houses, 61% lived in this county. Out of people who lived in different counties, 50% lived in New Hampshire.
95% of the 03873 zip code residents lived in the same house 1 year ago. Out of people who lived in different houses, 61% moved from this county. Out of people who lived in different houses, 6% moved from different county within same state. Out of people who lived in different houses, 38% moved from different state.
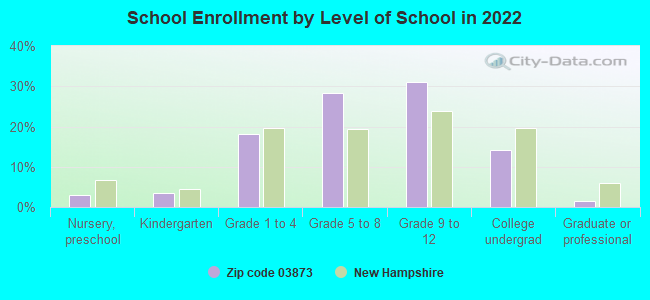
Private vs. public school enrollment:
Students in private schools in grades 1 to 8 (elementary and middle school): 121
Here:
19.3%
New Hampshire:
11.4%
Students in private schools in grades 9 to 12 (high school): 14
Here:
3.5%
New Hampshire:
14.0%
Students in private undergraduate colleges: 66
Here:
34.6%
New Hampshire:
38.0%
Occupation by median earnings in the past 12 months ($)
137,898Building and grounds cleaning and maintenance occupations
124,365Computer and mathematical occupations
114,827Management occupations
112,276Business and financial operations occupations
92,442Health diagnosing and treating practitioners and other technical occupations
89,988Architecture and engineering occupations
Companies with federal contracts located in this zip code:
SANDOWN WIRELESS (19 PHILLIPSWOOD ROAD in SANDOWN, NH; small business) : $13,195 in 4 contractsfrom 2003 to 2005
$5,661 with Air Force for Radio and Television Communication Equipment, Except Airborne. Signed on 2005-05-12. Completion date: 2005-06-30.
$4,611 with Army for Radio and Television Communication Equipment, Except Airborne. Signed on 2004-05-13. Completion date: 2004-05-27.
$2,890 with Army for Miscellaneous Items. Taking place in PA. Signed on 2003-09-18. Completion date: 2003-09-30.
$33, same as above.Signed on 2004-02-17. Completion date: 2004-02-20.
Top industries in this zip code by the number of employees in 2005:
Health Care and Social Assistance: Child Day Care Services (10-19 employees: 1 establishment, 1-4 employees: 2 establishments)
Construction: Site Preparation Contractors (10-19: 1, 1-4: 1)
Other Services (except Public Administration): Religious Organizations (10-19: 1)
Health Care and Social Assistance: Homes for the Elderly (10-19: 1)
Other Services (except Public Administration): Pet Care (except Veterinary) Services (10-19: 1)
Construction: All Other Specialty Trade Contractors (5-9: 2)
Construction: Plumbing, Heating, and Air-Conditioning Contractors (5-9: 1, 1-4: 2)
Construction: Drywall and Insulation Contractors (5-9: 1, 1-4: 1)
People in group quarters in 2010:
2 people in group homes intended for adults
People in group quarters in 2000:
30 people in other noninstitutional group quarters
2 people in other group homes
Home Mortgage Disclosure Act Aggregated Statistics For Year 2009 (Based on 2 full tracts)
A) FHA, FSA/RHS & VA Home Purchase Loans
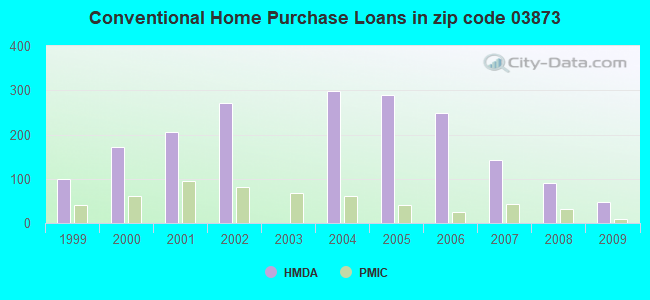
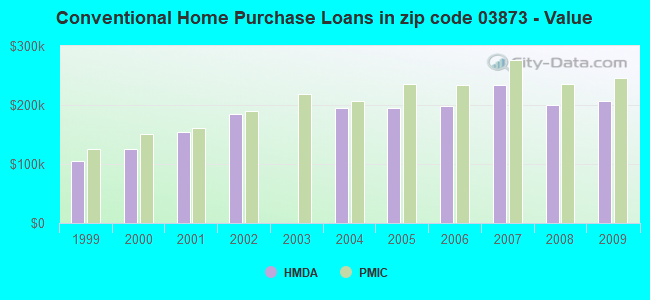
B) Conventional Home Purchase Loans
C) Refinancings
D) Home Improvement Loans
F) Non-occupant Loans on < 5 Family Dwellings (A B C & D)
G) Loans On Manufactured Home Dwelling (A B C & D)
Number
Average Value
Number
Average Value
Number
Average Value
Number
Average Value
Number
Average Value
Number
Average Value
LOANS ORIGINATED
64
$234,047
48
$207,584
404
$201,602
18
$40,309
6
$173,895
6
$85,948
APPLICATIONS APPROVED, NOT ACCEPTED
4
$250,850
14
$203,878
28
$218,869
6
$16,657
2
$130,920
0
$0
APPLICATIONS DENIED
8
$205,626
6
$208,875
180
$211,162
12
$91,612
2
$59,965
2
$174,895
APPLICATIONS WITHDRAWN
20
$152,308
14
$193,741
96
$213,580
10
$133,120
2
$299,820
2
$76,955
FILES CLOSED FOR INCOMPLETENESS
2
$293,825
0
$0
22
$215,961
0
$0
2
$74,955
0
$0
Aggregated Statistics For Year 2008 (Based on 2 full tracts)
A) FHA, FSA/RHS & VA Home Purchase Loans
B) Conventional Home Purchase Loans
C) Refinancings
D) Home Improvement Loans
F) Non-occupant Loans on < 5 Family Dwellings (A B C & D)
G) Loans On Manufactured Home Dwelling (A B C & D)
Number
Average Value
Number
Average Value
Number
Average Value
Number
Average Value
Number
Average Value
Number
Average Value
LOANS ORIGINATED
32
$256,533
90
$200,480
212
$192,705
28
$78,524
14
$216,727
4
$77,952
APPLICATIONS APPROVED, NOT ACCEPTED
6
$154,907
12
$226,697
34
$185,594
10
$33,980
6
$151,908
0
$0
APPLICATIONS DENIED
8
$263,591
16
$156,406
198
$227,813
38
$74,324
6
$210,873
4
$157,405
APPLICATIONS WITHDRAWN
0
$0
16
$203,752
52
$208,067
8
$68,709
4
$188,888
4
$144,412
FILES CLOSED FOR INCOMPLETENESS
0
$0
6
$209,542
20
$219,868
4
$174,895
0
$0
0
$0
Aggregated Statistics For Year 2007 (Based on 2 full tracts)
A) FHA, FSA/RHS & VA Home Purchase Loans
B) Conventional Home Purchase Loans
C) Refinancings
D) Home Improvement Loans
E) Loans on Dwellings For 5+ Families
F) Non-occupant Loans on < 5 Family Dwellings (A B C & D)
G) Loans On Manufactured Home Dwelling (A B C & D)
Number
Average Value
Number
Average Value
Number
Average Value
Number
Average Value
Number
Average Value
Number
Average Value
Number
Average Value
LOANS ORIGINATED
6
$216,537
142
$233,648
302
$185,789
100
$84,389
2
$164,900
16
$254,222
4
$152,908
APPLICATIONS APPROVED, NOT ACCEPTED
0
$0
22
$194,610
68
$181,538
10
$66,360
0
$0
2
$141,915
2
$55,965
APPLICATIONS DENIED
0
$0
18
$248,739
238
$198,100
62
$72,150
0
$0
6
$309,148
6
$76,953
APPLICATIONS WITHDRAWN
2
$205,875
14
$166,329
148
$216,114
6
$117,597
0
$0
6
$218,535
0
$0
FILES CLOSED FOR INCOMPLETENESS
0
$0
6
$205,543
20
$262,642
2
$24,985
0
$0
0
$0
0
$0
Aggregated Statistics For Year 2006 (Based on 2 full tracts)
A) FHA, FSA/RHS & VA Home Purchase Loans
B) Conventional Home Purchase Loans
C) Refinancings
D) Home Improvement Loans
E) Loans on Dwellings For 5+ Families
F) Non-occupant Loans on < 5 Family Dwellings (A B C & D)
G) Loans On Manufactured Home Dwelling (A B C & D)
Number
Average Value
Number
Average Value
Number
Average Value
Number
Average Value
Number
Average Value
Number
Average Value
Number
Average Value
LOANS ORIGINATED
2
$187,885
248
$198,647
440
$173,941
96
$45,618
0
$0
12
$192,718
10
$165,701
APPLICATIONS APPROVED, NOT ACCEPTED
2
$367,780
50
$209,714
72
$183,945
22
$32,617
2
$412,750
4
$84,950
6
$72,290
APPLICATIONS DENIED
4
$217,370
78
$172,563
240
$204,419
68
$62,845
0
$0
8
$177,644
16
$79,328
APPLICATIONS WITHDRAWN
0
$0
38
$232,124
206
$183,007
10
$180,092
0
$0
2
$407,755
2
$189,885
FILES CLOSED FOR INCOMPLETENESS
0
$0
2
$349,790
48
$213,414
2
$232,860
0
$0
0
$0
0
$0
Aggregated Statistics For Year 2005 (Based on 2 full tracts)
A) FHA, FSA/RHS & VA Home Purchase Loans
B) Conventional Home Purchase Loans
C) Refinancings
D) Home Improvement Loans
E) Loans on Dwellings For 5+ Families
F) Non-occupant Loans on < 5 Family Dwellings (A B C & D)
G) Loans On Manufactured Home Dwelling (A B C & D)
Number
Average Value
Number
Average Value
Number
Average Value
Number
Average Value
Number
Average Value
Number
Average Value
Number
Average Value
LOANS ORIGINATED
2
$285,830
290
$194,332
560
$197,556
82
$64,400
2
$1,998,800
34
$186,770
14
$110,934
APPLICATIONS APPROVED, NOT ACCEPTED
2
$305,815
44
$172,987
110
$178,820
12
$63,295
0
$0
4
$171,398
6
$78,287
APPLICATIONS DENIED
0
$0
54
$187,073
316
$200,974
44
$55,421
0
$0
4
$93,942
10
$115,531
APPLICATIONS WITHDRAWN
2
$294,825
34
$195,647
214
$202,187
24
$109,518
0
$0
2
$202,880
4
$102,438
FILES CLOSED FOR INCOMPLETENESS
0
$0
12
$160,903
112
$251,492
12
$41,642
0
$0
0
$0
0
$0
Aggregated Statistics For Year 2004 (Based on 2 full tracts)
A) FHA, FSA/RHS & VA Home Purchase Loans
B) Conventional Home Purchase Loans
C) Refinancings
D) Home Improvement Loans
F) Non-occupant Loans on < 5 Family Dwellings (A B C & D)
G) Loans On Manufactured Home Dwelling (A B C & D)
Number
Average Value
Number
Average Value
Number
Average Value
Number
Average Value
Number
Average Value
Number
Average Value
LOANS ORIGINATED
12
$239,357
298
$195,581
612
$175,845
68
$100,587
24
$193,884
20
$102,338
APPLICATIONS APPROVED, NOT ACCEPTED
2
$210,875
36
$192,551
92
$177,567
26
$46,587
8
$224,115
8
$59,714
APPLICATIONS DENIED
0
$0
46
$167,856
234
$181,114
56
$68,923
4
$248,350
14
$81,094
APPLICATIONS WITHDRAWN
0
$0
28
$206,804
168
$191,564
10
$96,542
8
$274,335
0
$0
FILES CLOSED FOR INCOMPLETENESS
0
$0
6
$132,253
60
$204,510
4
$226,865
2
$239,855
2
$89,945
Aggregated Statistics For Year 2002 (Based on 2 full tracts)
A) FHA, FSA/RHS & VA Home Purchase Loans
B) Conventional Home Purchase Loans
C) Refinancings
D) Home Improvement Loans
F) Non-occupant Loans on < 5 Family Dwellings (A B C & D)
Number
Average Value
Number
Average Value
Number
Average Value
Number
Average Value
Number
Average Value
LOANS ORIGINATED
12
$222,700
272
$184,566
738
$134,868
66
$31,799
14
$147,911
APPLICATIONS APPROVED, NOT ACCEPTED
2
$142,915
22
$178,166
102
$143,816
14
$23,414
2
$102,940
APPLICATIONS DENIED
10
$157,905
26
$181,507
172
$131,758
62
$30,240
2
$71,955
APPLICATIONS WITHDRAWN
0
$0
28
$181,106
86
$134,710
18
$31,314
6
$87,282
FILES CLOSED FOR INCOMPLETENESS
0
$0
10
$112,732
60
$199,347
2
$34,980
0
$0
Aggregated Statistics For Year 2001 (Based on 2 full tracts)
A) FHA, FSA/RHS & VA Home Purchase Loans
B) Conventional Home Purchase Loans
C) Refinancings
D) Home Improvement Loans
F) Non-occupant Loans on < 5 Family Dwellings (A B C & D)
Number
Average Value
Number
Average Value
Number
Average Value
Number
Average Value
Number
Average Value
LOANS ORIGINATED
34
$156,436
206
$153,694
632
$127,683
66
$24,470
0
$0
APPLICATIONS APPROVED, NOT ACCEPTED
2
$156,905
22
$115,295
64
$110,215
14
$35,121
2
$59,965
APPLICATIONS DENIED
2
$163,900
28
$117,287
126
$122,387
48
$24,610
4
$142,915
APPLICATIONS WITHDRAWN
0
$0
26
$168,668
122
$120,075
20
$26,085
0
$0
FILES CLOSED FOR INCOMPLETENESS
0
$0
4
$91,445
14
$84,806
0
$0
0
$0
Aggregated Statistics For Year 2000 (Based on 2 full tracts)
A) FHA, FSA/RHS & VA Home Purchase Loans
B) Conventional Home Purchase Loans
C) Refinancings
D) Home Improvement Loans
F) Non-occupant Loans on < 5 Family Dwellings (A B C & D)
Number
Average Value
Number
Average Value
Number
Average Value
Number
Average Value
Number
Average Value
LOANS ORIGINATED
34
$145,266
172
$125,401
142
$106,880
40
$25,335
6
$105,603
APPLICATIONS APPROVED, NOT ACCEPTED
2
$80,950
16
$68,459
40
$92,944
26
$32,442
0
$0
APPLICATIONS DENIED
4
$108,935
28
$98,441
92
$85,101
26
$43,666
6
$85,282
APPLICATIONS WITHDRAWN
4
$67,460
12
$118,928
84
$70,006
4
$31,480
2
$14,990
FILES CLOSED FOR INCOMPLETENESS
0
$0
2
$159,905
22
$71,139
2
$29,980
0
$0
Aggregated Statistics For Year 1999 (Based on 1 full tract)
A) FHA, FSA/RHS & VA Home Purchase Loans
B) Conventional Home Purchase Loans
C) Refinancings
D) Home Improvement Loans
F) Non-occupant Loans on < 5 Family Dwellings (A B C & D)
Detailed PMIC statistics for the following Tracts:0520.00
2002 - 2018 National Fire Incident Reporting System (NFIRS) incidents
Based on the data from the years 2002 - 2018 the average number of fires per year is 13. The highest number of fires - 39 took place in 2008, and the least - 0 in 2004. The data has a rising trend.
When looking into fire subcategories, the most incidents belonged to: Structure Fires (61.6%), and Outside Fires (24.1%).
Fire incident types reported to NFIRS in Zip Code 03873


 Nearest zip codes: 03841, 03819, 03826, 03036, 03044, 03811.


 Based on the data from the years 2002 - 2018 the average number of fires per year is 13. The highest number of fires - 39 took place in 2008, and the least - 0 in 2004. The data has a rising trend.
 When looking into fire subcategories, the most incidents belonged to: Structure Fires (61.6%), and Outside Fires (24.1%).