Estimated zip code population in 2022: 50,060 Zip code population in 2010: 50,502 Zip code population in 2000: 49,808
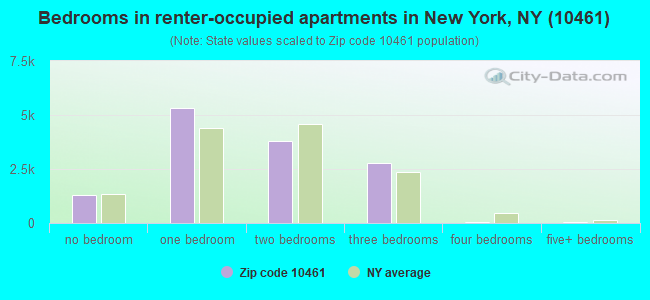
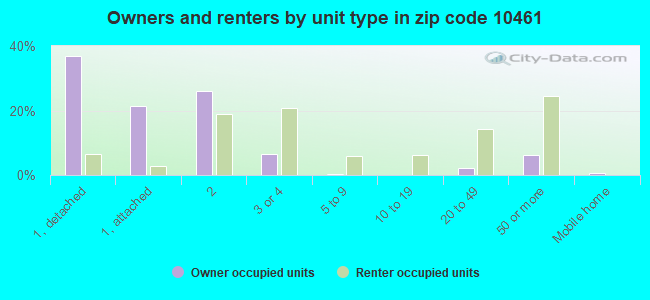
Houses and condos: 20,262 Renter-occupied apartments: 13,220
% of renters here:
69%
State:
46%
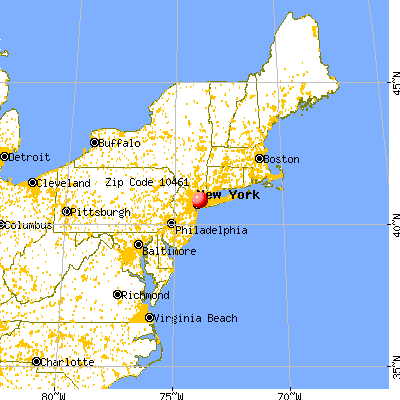
March 2022 cost of living index in zip code 10461: 152.7 (very high, U.S. average is 100)
Land area: 2.4 sq. mi. Water area: 0.0 sq. mi.
Population density: 20,861 people per square mile
(very high).
OSM Map
General Map
Google Map
MSN Map
OSM Map
General Map
Google Map
MSN Map
OSM Map
General Map
Google Map
MSN Map
OSM Map
General Map
Google Map
MSN Map
Please wait while loading the map...
Real estate property taxes paid for housing units in 2022:
This zip code:
0.9% ($5,757)
New York:
1.5% ($6,180)
Median real estate property taxes paid for housing units with mortgages in 2022: $5,920 (0.9%) Median real estate property taxes paid for housing units with no mortgage in 2022: $5,334 (0.9%)
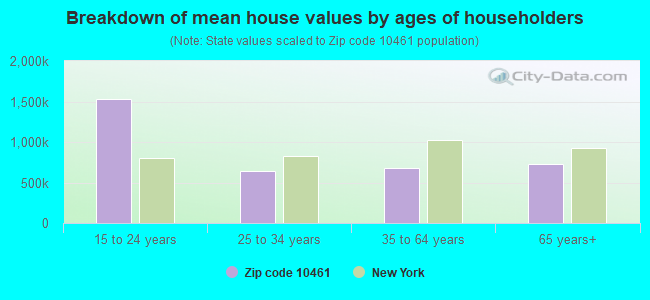
Estimated median house/condo value in 2022: $653,295
10461:
$653,295
New York:
$400,400
According to our research of New York and other state lists, there were 52 registered sex offenders living in 10461 zip code as of May 21, 2024. The ratio of all residents to sex offenders in zip code 10461 is 980 to 1. The ratio of registered sex offenders to all residents in this zip code is near the state average.
Median resident age:
This zip code:
38.5 years
New York median age:
40.0 years
Average household size:
This zip code:
2.5 people
New York:
2.5 people
Averages for the 2020 tax year for zip code 10461, filed in 2021:
Average Adjusted Gross Income (AGI) in 2020: $52,986 (Individual Income Tax Returns)
Here:
$52,986
State:
$90,930
Salary/wage: $51,664 (reported on 79.4% of returns)
Here:
$51,664
State:
$72,104
(% of AGI for various income ranges: 898.6% for AGIs below $25k, 3362.9% for AGIs $25k-50k, 6773.2% for AGIs $50k-75k, 10301.5% for AGIs $75k-100k, 18127.3% for AGIs $100k-200k, 64640.0% for AGIs over 200k)
Taxable interest for individuals: $885 (reported on 22.2% of returns)
This zip code:
$885
New York:
$3,075
(% of AGI for various income ranges: 14.3% for AGIs below $25k, 12.8% for AGIs $25k-50k, 18.1% for AGIs $50k-75k, 39.5% for AGIs $75k-100k, 91.6% for AGIs $100k-200k, 465.0% for AGIs over 200k)
Ordinary dividends: $3,049 (reported on 11.1% of returns)
Here:
$3,049
State:
$11,095
(% of AGI for various income ranges: 15.4% for AGIs below $25k, 18.7% for AGIs $25k-50k, 27.1% for AGIs $50k-75k, 65.7% for AGIs $75k-100k, 169.8% for AGIs $100k-200k, 1303.6% for AGIs over 200k)
Net capital gain/loss in AGI: +$6,058 (reported on 10.8% of returns)
Here:
+$6,058
State:
+$44,925
(% of AGI for various income ranges: 4.7% for AGIs below $25k, 15.5% for AGIs $25k-50k, 38.1% for AGIs $50k-75k, 85.8% for AGIs $75k-100k, 278.5% for AGIs $100k-200k, 5827.1% for AGIs over 200k)
Profit/loss from business: +$6,803 (reported on 17.1% of returns)
Here:
+$6,803
State:
+$14,940
(% of AGI for various income ranges: 223.6% for AGIs below $25k, 139.5% for AGIs $25k-50k, 99.1% for AGIs $50k-75k, 105.7% for AGIs $75k-100k, 169.0% for AGIs $100k-200k, 1187.1% for AGIs over 200k)
Taxable individual retirement arrangement distribution: $12,809 (reported on 3.8% of returns)
10461:
$12,809
New York:
$19,609
(% of AGI for various income ranges: 27.4% for AGIs below $25k, 27.3% for AGIs $25k-50k, 65.1% for AGIs $50k-75k, 124.4% for AGIs $75k-100k, 248.3% for AGIs $100k-200k, 582.9% for AGIs over 200k)
Self-employed (Keogh) retirement plans: $15,800 (reported on 0.1% of returns)
10461:
$15,800
New York:
$32,497
(% of AGI for various income ranges: 13.6% for AGIs $50k-75k)
Total itemized deductions: $26,425 (reported on 6.7% of returns)
Here:
$26,425
State:
$39,326
(% of AGI for various income ranges: 35.4% for AGIs below $25k, 83.4% for AGIs $25k-50k, 184.1% for AGIs $50k-75k, 465.6% for AGIs $75k-100k, 1103.0% for AGIs $100k-200k, 3844.3% for AGIs over 200k)
Charity contributions: $5,229 (reported on 5.3% of returns)
Here:
$5,229
State:
$15,420
(% of AGI for various income ranges: 1.7% for AGIs below $25k, 8.3% for AGIs $25k-50k, 23.0% for AGIs $50k-75k, 61.9% for AGIs $75k-100k, 199.3% for AGIs $100k-200k, 866.4% for AGIs over 200k)
Taxes paid: $8,690 (reported on 6.6% of returns)
10461:
$8,690
State:
$9,183
(% of AGI for various income ranges: 7.8% for AGIs below $25k, 21.5% for AGIs $25k-50k, 61.9% for AGIs $50k-75k, 163.2% for AGIs $75k-100k, 383.7% for AGIs $100k-200k, 1107.9% for AGIs over 200k)
Earned income credit: $2,233 (reported on 17.8% of returns)
Here:
$2,233
State:
$2,138
(% of AGI for various income ranges: 109.8% for AGIs below $25k, 73.4% for AGIs $25k-50k, 0.6% for AGIs $50k-75k)
Percentage of individuals using paid preparers for their 2020 taxes: 94.6%
Here:
95%
State:
95%
(% for various income ranges: 93.0% for AGIs below $25k, 95.7% for AGIs $25k-50k, 95.2% for AGIs $50k-75k, 95.1% for AGIs $75k-100k, 95.3% for AGIs $100k-200k, 93.2% for AGIs over 200k)
Averages for the 2012 tax year for zip code 10461, filed in 2013:
Average Adjusted Gross Income (AGI) in 2012: $46,308 (Individual Income Tax Returns)
Here:
$46,308
State:
$77,088
Salary/wage: $47,000 (reported on 81.5% of returns)
Here:
$47,000
State:
$60,593
(% of AGI for various income ranges: 62.0% for AGIs below $25k, 86.7% for AGIs $25k-50k, 86.5% for AGIs $50k-75k, 85.5% for AGIs $75k-100k, 84.7% for AGIs $100k-200k, 73.8% for AGIs over 200k)
Taxable interest for individuals: $863 (reported on 29.9% of returns)
This zip code:
$863
New York:
$3,125
(% of AGI for various income ranges: 1.1% for AGIs below $25k, 0.5% for AGIs $25k-50k, 0.6% for AGIs $50k-75k, 0.3% for AGIs $75k-100k, 0.5% for AGIs $100k-200k, 0.8% for AGIs over 200k)
Ordinary dividends: $2,566 (reported on 12.2% of returns)
Here:
$2,566
State:
$10,299
(% of AGI for various income ranges: 1.1% for AGIs below $25k, 0.5% for AGIs $25k-50k, 0.6% for AGIs $50k-75k, 0.6% for AGIs $75k-100k, 0.7% for AGIs $100k-200k, 0.9% for AGIs over 200k)
Net capital gain/loss in AGI: +$767 (reported on 9.0% of returns)
Here:
+$767
State:
+$42,474
(% of AGI for various income ranges: 0.2% for AGIs $75k-100k, 0.5% for AGIs $100k-200k, 1.0% for AGIs over 200k)
Profit/loss from business: +$8,561 (reported on 15.1% of returns)
Here:
+$8,561
State:
+$16,168
(% of AGI for various income ranges: 17.6% for AGIs below $25k, 1.7% for AGIs $25k-50k, 0.9% for AGIs $50k-75k, 0.6% for AGIs $75k-100k, 0.8% for AGIs $100k-200k, 2.4% for AGIs over 200k)
Taxable individual retirement arrangement distribution: $10,522 (reported on 6.0% of returns)
10461:
$10,522
New York:
$17,621
(% of AGI for various income ranges: 2.1% for AGIs below $25k, 1.2% for AGIs $25k-50k, 1.2% for AGIs $50k-75k, 1.4% for AGIs $75k-100k, 1.2% for AGIs $100k-200k, 1.7% for AGIs over 200k)
Self-employment retirement plans: $11,700 (reported on 0.1% of returns)
10461:
$11,700
New York:
$27,330
Total itemized deductions: $20,182 (25% of AGI, reported on 32.9% of returns)
Here:
$20,182
State:
$34,985
Here:
25.2% of AGI
State:
21.3% of AGI
(% of AGI for various income ranges: 6.6% for AGIs below $25k, 11.4% for AGIs $25k-50k, 14.9% for AGIs $50k-75k, 16.2% for AGIs $75k-100k, 17.8% for AGIs $100k-200k, 17.1% for AGIs over 200k)
Charity contributions: $2,498 (reported on 27.9% of returns)
Here:
$2,498
State:
$5,572
(% of AGI for various income ranges: 0.4% for AGIs below $25k, 1.3% for AGIs $25k-50k, 1.7% for AGIs $50k-75k, 1.8% for AGIs $75k-100k, 1.8% for AGIs $100k-200k, 1.4% for AGIs over 200k)
Taxes paid: $8,433 (reported on 32.8% of returns)
10461:
$8,433
State:
$18,656
(% of AGI for various income ranges: 1.3% for AGIs below $25k, 3.2% for AGIs $25k-50k, 5.5% for AGIs $50k-75k, 7.2% for AGIs $75k-100k, 8.9% for AGIs $100k-200k, 10.4% for AGIs over 200k)
Earned income credit: $2,285 (reported on 20.7% of returns)
Here:
$2,285
State:
$2,230
(% of AGI for various income ranges: 8.3% for AGIs below $25k, 0.8% for AGIs $25k-50k)
Percentage of individuals using paid preparers for their 2012 taxes: 72.8%
Here:
73%
State:
66%
(% for various income ranges: 72.7% for AGIs below $25k, 71.0% for AGIs $25k-50k, 72.0% for AGIs $50k-75k, 75.7% for AGIs $75k-100k, 77.7% for AGIs $100k-200k, 76.2% for AGIs over 200k)
Averages for the 2004 tax year for zip code 10461, filed in 2005:
Average Adjusted Gross Income (AGI) in 2004: $40,347 (Individual Income Tax Returns)
Here:
$40,347
State:
$59,519
Salary/wage: $41,539 (reported on 81.9% of returns)
Here:
$41,539
State:
$50,673
(% of AGI for various income ranges: 75.4% for AGIs below $10k, 69.0% for AGIs $10k-25k, 88.0% for AGIs $25k-50k, 87.4% for AGIs $50k-75k, 87.6% for AGIs $75k-100k, 80.6% for AGIs over 100k)
Taxable interest for individuals: $1,244 (reported on 48.4% of returns)
This zip code:
$1,244
New York:
$2,377
(% of AGI for various income ranges: 6.7% for AGIs below $10k, 3.0% for AGIs $10k-25k, 1.2% for AGIs $25k-50k, 1.2% for AGIs $50k-75k, 1.0% for AGIs $75k-100k, 1.5% for AGIs over 100k)
Taxable dividends: $1,750 (reported on 19.2% of returns)
Here:
$1,750
State:
$5,394
(% of AGI for various income ranges: 2.6% for AGIs below $10k, 1.4% for AGIs $10k-25k, 0.6% for AGIs $25k-50k, 0.7% for AGIs $50k-75k, 0.7% for AGIs $75k-100k, 1.0% for AGIs over 100k)
Net capital gain/loss: +$2,617 (reported on 13.7% of returns)
Here:
+$2,617
State:
+$23,581
(% of AGI for various income ranges: -0.8% for AGIs below $10k, 0.1% for AGIs $10k-25k, -0.1% for AGIs $25k-50k, 0.4% for AGIs $50k-75k, 0.4% for AGIs $75k-100k, 3.9% for AGIs over 100k)
Profit/loss from business: +$7,715 (reported on 11.2% of returns)
Here:
+$7,715
State:
+$13,809
(% of AGI for various income ranges: 18.2% for AGIs below $10k, 7.6% for AGIs $10k-25k, 1.4% for AGIs $25k-50k, 0.6% for AGIs $50k-75k, 1.0% for AGIs $75k-100k, 2.0% for AGIs over 100k)
IRA payment deduction: $2,869 (reported on 2.4% of returns)
10461:
$2,869
New York:
$3,115
(% of AGI for various income ranges: 0.2% for AGIs below $10k, 0.3% for AGIs $10k-25k, 0.2% for AGIs $25k-50k, 0.1% for AGIs $50k-75k, 0.1% for AGIs $75k-100k, 0.1% for AGIs over 100k)
Self-employed pension: $9,590 (reported on 0.2% of returns)
Here:
$9,590
New York:
$19,016
Total itemized deductions: $17,133 (26% of AGI, reported on 37.2% of returns)
Here:
$17,133
State:
$25,864
Here:
26.2% of AGI
State:
21.9% of AGI
(% of AGI for various income ranges: 10.1% for AGIs below $10k, 9.5% for AGIs $10k-25k, 13.3% for AGIs $25k-50k, 17.4% for AGIs $50k-75k, 18.5% for AGIs $75k-100k, 18.8% for AGIs over 100k)
Charity contributions deductions: $2,667 (4% of AGI, reported on 34.6% of returns)
Here:
$2,667
State:
$4,439
Here:
4.0% of AGI
State:
3.6% of AGI
(% of AGI for various income ranges: 0.5% for AGIs below $10k, 1.1% for AGIs $10k-25k, 2.1% for AGIs $25k-50k, 2.7% for AGIs $50k-75k, 2.7% for AGIs $75k-100k, 2.4% for AGIs over 100k)
Total tax: $5,048 (reported on 77.2% of returns)
10461:
$5,048
State:
$11,730
(% of AGI for various income ranges: 3.8% for AGIs below $10k, 4.0% for AGIs $10k-25k, 7.1% for AGIs $25k-50k, 9.8% for AGIs $50k-75k, 11.0% for AGIs $75k-100k, 15.2% for AGIs over 100k)
Earned income credit: $1,679 (reported on 14.8% of returns)
Here:
$1,679
State:
$1,757
Percentage of individuals using paid preparers for their 2004 taxes: 69.3%
Here:
69%
State:
67%
(% for various income ranges: 64.0% for AGIs below $10k, 72.7% for AGIs $10k-25k, 66.7% for AGIs $25k-50k, 71.8% for AGIs $50k-75k, 71.5% for AGIs $75k-100k, 76.8% for AGIs over 100k)
Likely homosexual households (counted as self-reported same-sex unmarried-partner households)
Lesbian couples: 0.2% of all households
Gay men: 0.0% of all households
Household received Food Stamps/SNAP in the past 12 months: 4,540 Household did not receive Food Stamps/SNAP in the past 12 months: 14,851
Women who had a birth in the past 12 months: 768 (557 now married, 209 unmarried) Women who did not have a birth in the past 12 months: 11,928 (4,806 now married, 7,099 unmarried)
Housing units in zip code 10461 with a mortgage: 3,739 (384 second mortgage, 76 home equity loan, 254 both second mortgage and home equity loan) Houses without a mortgage: 126
Median monthly owner costs for units with a mortgage: $2,979 Median monthly owner costs for units without a mortgage: $1,020
Residents with income below the poverty level in 2022:
This zip code:
17.5%
Whole state:
14.3%
Residents with income below 50% of the poverty level in 2022:
This zip code:
8.6%
Whole state:
6.8%
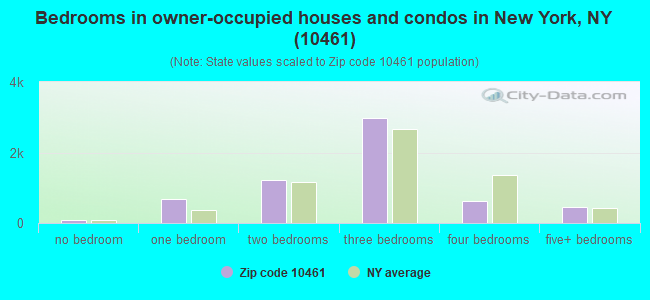
Median number of rooms in houses and condos:
Here:
5.4
State:
6.3
Median number of rooms in apartments:
Here:
3.6
State:
3.8
Notable locations in this zip code not listed on our city pages
Notable locations in zip code 10461: Pelham Bay Park Station (A), Pelham Bay Branch New York Public Library (B), Fortyninth Precinct Police Station (C), Owen Dolen Golden Age Center (D), Huntington Free Library and Reading Room (E), Rousso Building (F), Robbins Auditorium (G), Rhinelander Hall Residence Complex (H), Mazer Building (I), Gruss Magnetic Resonance Research Center (J), Golding Building (K), Falk Recreation Center (L), Eastchester Road Residence Complex (M), Westchester Square Branch New York Public Library (N), Bronx House Jewish Community Center (O), Fire Department New York Engine 61Squad 61 Battalion 20 (P), Morningside House Nursing Home (Q). Display/hide their locations on the map
Churches in zip code 10461 include: Saint Peter's Episcopal Church (A), Saint Theresa of the Infant Jesus Roman Catholic Church (B), First Presbyterian Church (C), Saint Francis Xavier Church (D), Saint Francis Xavier Convent (E), Westchester Methodist Church (F), Williamsbridge Reformed Church (G), Saint Clare's Roman Catholic Church (H), Saint Theresa Convent (I). Display/hide their locations on the map
Parks in zip code 10461 include: Bufano Playground (1), Colucci Playground (2), Loreto Playground (3), Miele Park (4), Samuel H Young Park (5), Schneider-Sampson Park (6), Westchester Square (7). Display/hide their locations on the map
Tourist attraction (not listed on the city page) : Bronx Council of the Arts Inc (Museums; 1738 Hone Avenue).
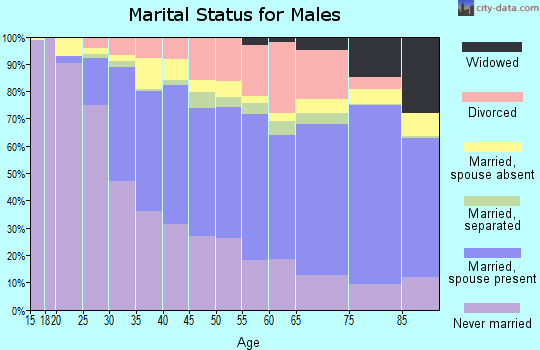
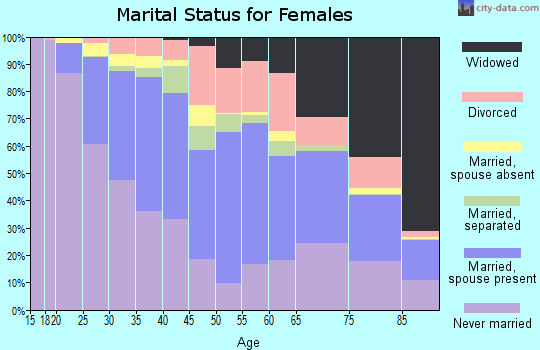
5,605 married couples with children.
3,486 single-parent households (668 men, 2,818 women).
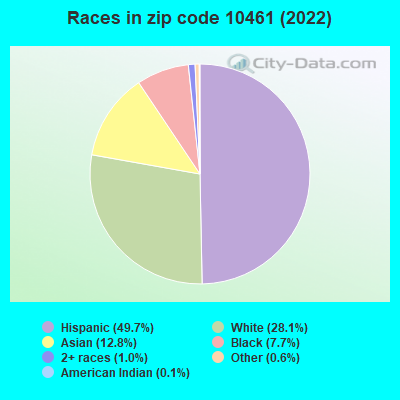
42.6% of residents of 10461 zip code speak English at home.
35.6% of residents speak Spanish at home (68% very well, 19% well, 8% not well, 4% not at all).
13.6% of residents speak other Indo-European language at home (59% very well, 25% well, 11% not well, 4% not at all).
6.3% of residents speak Asian or Pacific Island language at home (44% very well, 33% well, 15% not well, 8% not at all).
1.4% of residents speak other language at home (89% very well, 11% well).
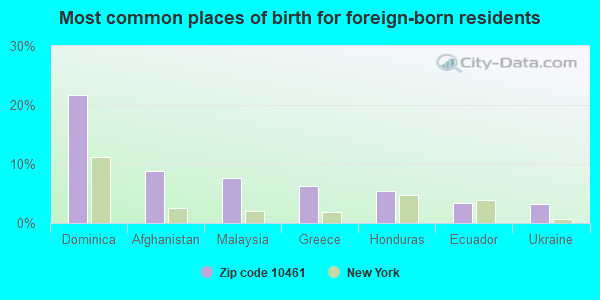
Foreign born population: 14,566 (29.1%) (57.3% of them are naturalized citizens)
This zip code:
29.1%
Whole state:
22.7%
22%Dominica
9%Afghanistan
8%Malaysia
6%Greece
5%Honduras
3%Ecuador
3%Ukraine
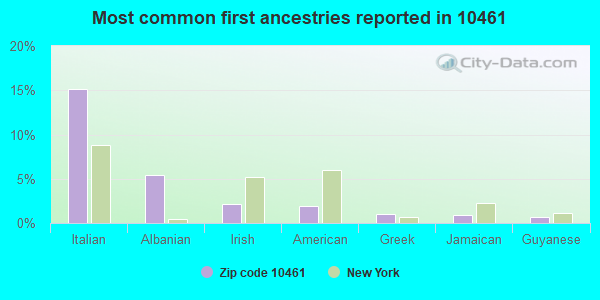
15%Italian
5%Albanian
2%Irish
2%American
1%Greek
1%Jamaican
1%Guyanese
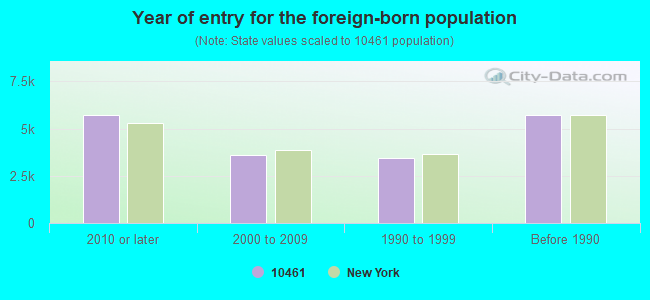
Year of entry for the foreign-born population
5,7192010 or later
3,6272000 to 2009
3,4351990 to 1999
5,705Before 1990
Major facilities with environmental interests located in this zip code:
ALBERT EINSTEIN COLLEGE OF MEDICINE (1300 MORRIS PARK AVENUE in BRONX, NY)
AIR MAJOR (AIRS/AFS) STATE MASTER (New York facility tracking) - AIR PROGRAM, AIR MAJOR, HAZARDOUS WASTE PROGRAM, AIR PROGRAM, COMPLIANCE ACTIVITY (Tracking inspections of insecticide, fungicide, and rodenticide, and toxic substances) CRITERIA AND HAZARDOUS AIR POLLUTANT INVENTORY (Inventory of air pollution sources) HAZARDOUS WASTE BIENNIAL REPORTER (Resource Conservation and Recovery Act (tracking hazardous waste)) - ICIS-, ENFORCEMENT/COMPLIANCE ACTIVITY, ICIS-02-2005-9201, FORMAL ENFORCEMENT ACTION, ENFORCEMENT/COMPLIANCE ACTIVITY Large Quantity Generators, more that 1000 kg of hazardous waste/month (Resource Conservation and Recovery Act (tracking hazardous waste)) - ICIS-, ENFORCEMENT/COMPLIANCE ACTIVITY, ICIS-02-2005-9201, FORMAL ENFORCEMENT ACTION, ENFORCEMENT/COMPLIANCE ACTIVITY Business SIC classification: OPERATORS OF NONRESIDENTIAL BUILDINGS; GENERAL MEDICAL AND SURGICAL HOSPITALS; COLLEGES, UNIVERSITIES, AND PROFESSIONAL SCHOOLS Business NAICS classification: COLLEGES, UNIVERSITIES, AND PROFESSIONAL SCHOOLS. Organizations: YESHIVA UNIVERSITY (CONTACT/OPERATOR)
AMSTERDAM COLOR WORKS INC (1546 STILLWELL AVE. in BRONX, NY)
AIR MINOR (AIRS/AFS) STATE MASTER (New York facility tracking) - AIR PROGRAM, HAZARDOUS WASTE PROGRAM (Integrated Compliance Information System) - ICIS-02-1986-0108, FORMAL ENFORCEMENT ACTION CRITERIA AND HAZARDOUS AIR POLLUTANT INVENTORY (Inventory of air pollution sources) HAZARDOUS WASTE BIENNIAL REPORTER (Resource Conservation and Recovery Act (tracking hazardous waste)) (Resource Conservation and Recovery Act (tracking hazardous waste)) TRI REPORTER (Tracking of toxic chemicals releasing facilities) Business SIC classification: PAINTS, VARNISHES, LACQUERS, ENAMELS, AND ALLIED PRODUCTS Business NAICS classification: PAINT AND COATING MANUFACTURING.; PAINT AND COATING MANUFACTURING. Organizations: STEPHEN OFFERMAN (CONTACT/OPERATOR)
Alternative names: AMSTERDAN COLOR WORKS INC
HESS STATION - 1392 COMMERCE AVE (1392 COMMERCE AVENUE in BRONX, NY)
AIR SYNTHETIC MINOR (AIRS/AFS) STATE MASTER (New York facility tracking) - AIR PROGRAM, National Pollutant Discharge Elimination System Permit, HAZARDOUS WASTE PROGRAM National Pollutant Discharge Elimination System NON-MAJOR (Tracking pollutant discharge elimination systems) - permit (Resource Conservation and Recovery Act (tracking hazardous waste)) Business SIC classification: PETROLEUM BULK STATIONS AND TERMINALS Organizations: HESS CORPORATION, FRED M SCHILDWACHTER & SONS (CONTACT/OWNER)
, FRED M SCHILDWACHTER & SONS INC (LEGALLY RESPONSIBLE PARTY)
, AMERADA HESS CORP (LEGALLY RESPONSIBLE PARTY)
Alternative names: AMERADA HESS CORP, BRONX TERMINAL, FRED M SCHILDWACHTER & SONS
ALBERT EINSTEIN WEILER HOSPITAL (1825 EASTCHESTER ROAD in BRONX, NY)
(Integrated Compliance Information System) - ICIS-02-2004-0874, ENFORCEMENT/COMPLIANCE ACTIVITY FORMAL ENFORCEMENT ACTION (Integrated Compliance Information System) - ICIS-02-2004-0874, ENFORCEMENT/COMPLIANCE ACTIVITY Conditionally Exempt Small Quantity Generators, less than 100 kg/month of hazardous waste (Resource Conservation and Recovery Act (tracking hazardous waste)) Alternative names: HOSPITAL OF ALBERT EINSTEIN, JACK D. WEILER/EINSTEIN HOSPITAL
HESS S/S #32274 (1610 EASTCHESTER RD in BRONX, NY)
AIR MINOR (AIRS/AFS) STATE MASTER (New York facility tracking) - AIR PROGRAM Conditionally Exempt Small Quantity Generators, less than 100 kg/month of hazardous waste (Resource Conservation and Recovery Act (tracking hazardous waste)) - notification Business SIC classification: GASOLINE SERVICE STATIONS Organizations: HESS CORPORATION, AMERADA HESS CORP (CONTACT/OWNER)
Alternative names: AMERADA HESS STATION 32274
AMOCO-51262100005 (2475 BOSTON ROAD in BRONX, NY)
AIR MINOR (AIRS/AFS) STATE MASTER (New York facility tracking) - AIR PROGRAM (Resource Conservation and Recovery Act (tracking hazardous waste)) Business SIC classification: GASOLINE SERVICE STATIONS Organizations: AMOCO OIL CO (LEGALLY RESPONSIBLE PARTY)
Alternative names: AMOCO SERVICE STATION
AMOCO-435610488005 (1500 WILLIAMSBRG RD in BRONX, NY)
AIR MINOR (AIRS/AFS) STATE MASTER (New York facility tracking) - AIR PROGRAM, Conditionally Exempt Small Quantity Generators, less than 100 kg/month of hazardous waste (Resource Conservation and Recovery Act (tracking hazardous waste)) - notification Business SIC classification: GASOLINE SERVICE STATIONS Organizations: AMOCO OIL CO (CONTACT/OWNER)
Alternative names: AMOCO SERVICE STATION, REAL GAS GO
HAPPY CLEANERS (2121 WILLIAMSBRIDGE RD in BRONX, NY)
STATE MASTER (New York facility tracking) - AIR PROGRAM (Resource Conservation and Recovery Act (tracking hazardous waste)) Business SIC classification: DRYCLEANING PLANTS, EXCEPT RUG CLEANING Business NAICS classification: DRYCLEANING AND LAUNDRY SERVICES (EXCEPT COIN-OPERATED). Organizations: SARAH S CLEANERS (LEGALLY RESPONSIBLE PARTY)
, J J HAPPY CLEANERS (LEGALLY RESPONSIBLE PARTY)
Alternative names: SARAHS DRY CLEANERS
ACE CLEANERS (3030 WESTCHESTER AVE in BRONX, NY)
AIR MINOR (AIRS/AFS) STATE MASTER (New York facility tracking) - AIR PROGRAM Small Quantity Generators, between 100 kg and 1000 kg of hazardous waste/month (Resource Conservation and Recovery Act (tracking hazardous waste)) Business SIC classification: DRYCLEANING PLANTS, EXCEPT RUG CLEANING Business NAICS classification: DRYCLEANING AND LAUNDRY SERVICES (EXCEPT COIN-OPERATED).
CROSBY CLEANERS (3279 WESTCHESTER AVENUE in BRONX, NY)
AIR MINOR (AIRS/AFS) STATE MASTER (New York facility tracking) - AIR PROGRAM Small Quantity Generators, between 100 kg and 1000 kg of hazardous waste/month (Resource Conservation and Recovery Act (tracking hazardous waste)) Business SIC classification: DRYCLEANING PLANTS, EXCEPT RUG CLEANING Business NAICS classification: DRYCLEANING AND LAUNDRY SERVICES (EXCEPT COIN-OPERATED). Alternative names: CROSBY CLEANERS & FURRIERS
ALBERT EINSTEIN COLLEGE OF MEDICINE - 1925-1935 EASTCHESTER ROAD (1925-1935 EASTCHESTER ROAD in BRONX, NY)
AIR SYNTHETIC MINOR (AIRS/AFS) STATE MASTER (New York facility tracking) - AIR PROGRAM Business SIC classification: OPERATORS OF APARTMENT BUILDINGS; COLLEGES, UNIVERSITIES, AND PROFESSIONAL SCHOOLS Business NAICS classification: LESSORS OF RESIDENTIAL BUILDINGS AND DWELLINGS. Organizations: YESHIVA UNIVERSITY (LEGALLY RESPONSIBLE PARTY)
Alternative names: 1925 1935 EASTCHESTER ROAD BUILDING
ALL SEASONS CLEANERS (2921 WESTCHESTER AVE in BRONX, NY)
STATE MASTER (New York facility tracking) - HAZARDOUS WASTE PROGRAM Small Quantity Generators, between 100 kg and 1000 kg of hazardous waste/month (Resource Conservation and Recovery Act (tracking hazardous waste)) Business SIC classification: DRYCLEANING PLANTS, EXCEPT RUG CLEANING Business NAICS classification: DRYCLEANING AND LAUNDRY SERVICES (EXCEPT COIN-OPERATED). Organizations: YOUNG CHUL CHUNG (LEGALLY RESPONSIBLE PARTY)
ALPHA DISPLAY CO INC-1310 HERSCHELL ST (1310 HERSCHELL STREET in BRONX, NY)
AIR SYNTHETIC MINOR (AIRS/AFS) STATE MASTER (New York facility tracking) - AIR PROGRAM, Business SIC classification: OFFICE AND STORE FIXTURES, PARTITIONS, SHELVING, AND LOCKERS, EXCEPT WOOD Organizations: ALPHA DISPLAY COMPANY INC (LEGALLY RESPONSIBLE PARTY)
Alternative names: ALPHA DISPLAY COMPANY INCORPORATED
Housing units lacking complete plumbing facilities: 0.6% Housing units lacking complete kitchen facilities: 1.3%
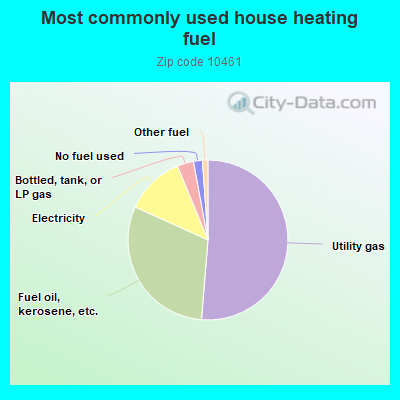
51.2%Utility gas
30.4%Fuel oil, kerosene, etc.
12.0%Electricity
3.3%Bottled, tank, or LP gas
1.8%No fuel used
1.1%Other fuel
Population in 1990: 45,273. Population change in the 1990s: +4,535 (+10.0%).
Place of birth for U.S.-born residents:
This state: 29,219
Northeast: 887
Midwest: 323
South: 819
West: 406
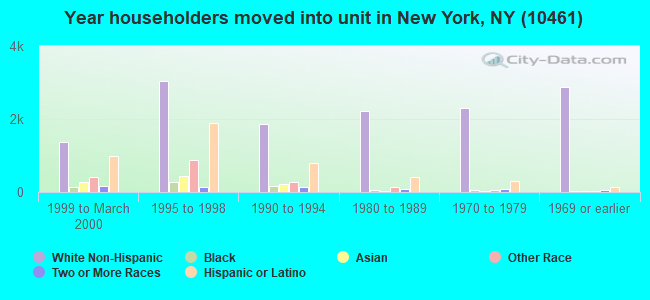
63% of the 10461 zip code residents lived in the same house 5 years ago. Out of people who lived in different houses, 66% lived in this county. Out of people who lived in different counties, 50% lived in New York.
90% of the 10461 zip code residents lived in the same house 1 year ago. Out of people who lived in different houses, 60% moved from this county. Out of people who lived in different houses, 30% moved from different county within same state. Out of people who lived in different houses, 3% moved from different state. Out of people who lived in different houses, 6% moved from abroad.
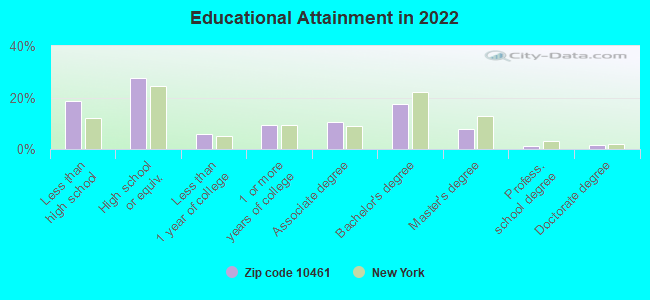
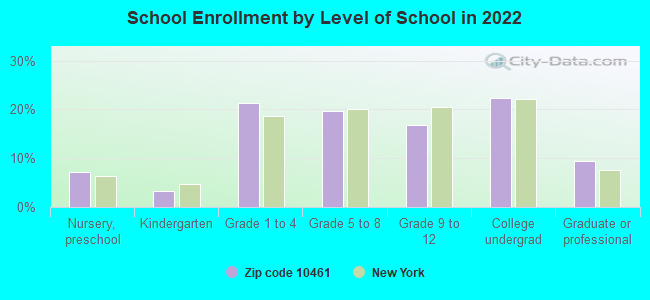
Private vs. public school enrollment:
Students in private schools in grades 1 to 8 (elementary and middle school): 880
Here:
16.4%
New York:
15.6%
Students in private schools in grades 9 to 12 (high school): 313
Here:
14.3%
New York:
15.0%
Students in private undergraduate colleges: 876
Here:
30.1%
New York:
39.2%
Occupation by median earnings in the past 12 months ($)
104,420Legal occupations
92,181Architecture and engineering occupations
82,063Installation, maintenance, and repair occupations
81,797Business and financial operations occupations
79,551Health diagnosing and treating practitioners and other technical occupations
78,582Management occupations
Companies with federal contracts located in this zip code (BRONX, NY):
YESHIVA UNIVERSITY (1300 MORRIS PARK AVE) : $3,065,801 in 31 contractsfrom 2000 to 2006
Contracts for Physical Sciences -- Basic Research (R&D), Laboratory Testing Services, Tuition, Registration, and Membership Fees, Educational Services by Navy, Army Signed by year:2000: $538,274; 2001: $581,304; 2002: $876,804; 2003: $633,192; 2004: $183,887; 2005: $212,665; 2006: $39,675.
Biggest contracts:
$581,629 with Navy for Physical Sciences -- Basic Research (R&D). Signed on 2003-02-19. Completion date: 2003-12-29.
$412,686, same as above.Signed on 2000-04-07. Completion date: 2001-04-06.
$400,127, same as above.Signed on 2002-06-28. Completion date: 2003-12-29.
$263,522, same as above.Signed on 2001-05-14. Completion date: 2002-04-06.
PLASTODENT INC (2881 MIDDLETOWN RD; small business) 100 employees, $0 revenue. : $649,076 in 10 contractsfrom 2000 to 2005
Contracts for Drugs and Biologicals by Defense Logistics Agency Signed by year:2000: $118,219; 2001: $200,816; 2002: $302,041; 2003: $0; 2004: $0; 2005: $28,000; 2006: $0.
Biggest contracts:
$107,800 with Defense Logistics Agency for Drugs and Biologicals. Signed on 2002-09-17. Completion date: 2002-12-25.
$86,972, same as above.Signed on 2001-07-24. Completion date: 2001-10-31.
$86,708, same as above.Signed on 2002-06-14. Completion date: 2002-09-21.
$73,051, same as above.Signed on 2002-03-13. Completion date: 2002-06-20.
david hirsch, md (; small business) : $117,500 in 4 contractsfrom 2002 to 2004
$38,000 with Offices, Boards and Divisions (includes Attorney General, Deputy Attorney General, etc.) for Expert Witness. Signed on 2004-05-01. Completion date: 2005-10-31.
$26,750, same as above.Signed on 2004-06-01. Completion date: 2004-10-31.
$26,750, same as above.Signed on 2002-06-15. Completion date: 2002-08-15.
$26,000, same as above.Signed on 2002-12-15. Completion date: 2002-12-15.
FULL CIRCLE HEALTH, PLLC (2105 WILLIAMSBRIDGE RD; small business) : $58,775 in 4 contractsfrom 2004 to 2006
$26,500 with Army for Other Professional Services. Signed on 2005-09-15. Completion date: 2006-02-09.
$22,425 with Army for Other Education and Training Services. Signed on 2004-09-22. Completion date: 2005-05-20.
$10,000 with Army for Other Social Services. Signed on 2004-07-16. Completion date: 2005-03-31.
-$150 with Army for Other Professional Services. Signed on 2006-01-06. Completion date: 2006-02-09.
FAIELLA IRON WORKS INC (1433 BASSETT AVE) : $20,200 in 3 contractsfrom 2001 to 2002
$10,400 with Army for Miscellaneous Construction Equipment. Signed on 2001-11-15. Completion date: 2001-11-19.
$6,200, same as above.Signed on 2001-11-29. Completion date: 2001-11-19.
$3,600 with Army for Lease or Rental of Equipment -- Construction, Mining, Excavating, and Highway Maintenance Equipment. Signed on 2002-02-05. Completion date: 2002-04-20.
SAFEWAY ENVIRONMENTAL CORP (1379 COMMERCE AVE; small business) : $5,250 in 2 contractsin 2003
$4,250 with Army for Hazardous Substance Removal, Cleanup, and Disposal Services and Operational Support. Signed on 2003-07-09. Completion date: 2003-07-10.
$1,000, same as above.Signed on 2003-08-19. Completion date: 2003-07-10.
LABCO SYSTEMS, INC (1420 ST PETERS AVE; small business)
$1,260 with Army for Maintenance, Repair and Rebuilding of Equipment -- Alarm, Signal, and Security Detection Systems. Signed on 2002-10-28. Completion date: 2003-09-30.
Top industries in this zip code by the number of employees in 2005:
Educational Services: Colleges, Universities, and Professional Schools (over 1000 employees: 1 establishment, 50-99 employees: 1 establishment)
Administrative and Support and Waste Management and Remediation Services: Security Guards and Patrol Services (over 1000: 1, 20-49: 1)
Health Care and Social Assistance: Offices of Physicians (except Mental Health Specialists) (500-999: 1, 50-99: 1, 20-49: 4, 10-19: 17, 5-9: 26, 1-4: 50)
Health Care and Social Assistance: Psychiatric and Substance Abuse Hospitals (500-999: 1, 100-249: 1)
Health Care and Social Assistance: Home Health Care Services (250-499: 2, 20-49: 1)
Health Care and Social Assistance: Specialty (except Psychiatric and Substance Abuse) Hospitals (500-999: 1)
Health Care and Social Assistance: General Medical and Surgical Hospitals (500-999: 1)
Health Care and Social Assistance: Nursing Care Facilities (250-499: 1, 5-9: 2)
People in group quarters in 2010:
976 people in college/university student housing
448 people in mental (psychiatric) hospitals and psychiatric units in other hospitals
436 people in nursing facilities/skilled-nursing facilities
222 people in in-patient hospice facilities
83 people in residential treatment centers for adults
31 people in group homes intended for adults
27 people in other noninstitutional facilities
People in group quarters in 2000:
913 people in college dormitories (includes college quarters off campus)
721 people in mental (psychiatric) hospitals or wards
460 people in nursing homes
139 people in wards in general hospitals for patients who have no usual home elsewhere
73 people in homes for the mentally ill
58 people in hospitals/wards and hospices for chronically ill
58 people in other hospitals or wards for chronically ill
32 people in other group homes
32 people in religious group quarters
28 people in homes for the mentally retarded
25 people in homes or halfway houses for drug/alcohol abuse
20 people in hospitals or wards for drug/alcohol abuse
8 people in other noninstitutional group quarters
Fatal accident statistics in 2014:
Fatal accident count: 5
Vehicles involved in fatal accidents: 6
Fatal accidents caused by drunken drivers: 1
Fatalities: 5
Persons involved in fatal accidents: 7
Pedestrians involved in fatal accidents: 2
Fatal accident statistics in 2013:
Fatal accident count: 2
Vehicles involved in fatal accidents: 4
Fatal accidents caused by drunken drivers: 0
Fatalities: 2
Persons involved in fatal accidents: 5
Pedestrians involved in fatal accidents: 1
Home Mortgage Disclosure Act Aggregated Statistics For Year 2009 (Based on 14 full and 20 partial tracts)
A) FHA, FSA/RHS & VA Home Purchase Loans
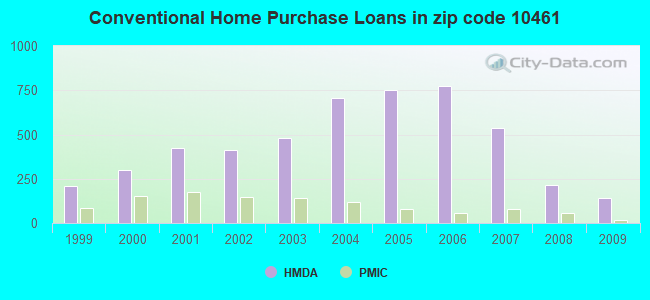
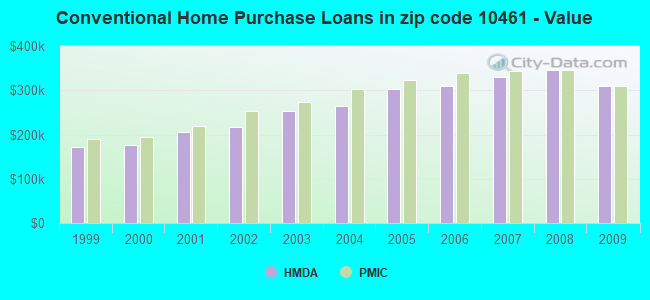
B) Conventional Home Purchase Loans
C) Refinancings
D) Home Improvement Loans
E) Loans on Dwellings For 5+ Families
F) Non-occupant Loans on < 5 Family Dwellings (A B C & D)
G) Loans On Manufactured Home Dwelling (A B C & D)
Number
Average Value
Number
Average Value
Number
Average Value
Number
Average Value
Number
Average Value
Number
Average Value
Number
Average Value
LOANS ORIGINATED
56
$412,926
142
$309,016
292
$311,070
23
$162,877
7
$1,120,899
24
$362,581
1
$186,080
APPLICATIONS APPROVED, NOT ACCEPTED
11
$395,360
14
$274,641
37
$315,641
3
$290,263
0
$0
2
$225,150
0
$0
APPLICATIONS DENIED
23
$426,864
55
$258,861
241
$339,371
30
$41,328
3
$1,598,040
27
$258,141
2
$1,630
APPLICATIONS WITHDRAWN
22
$445,455
21
$356,794
148
$329,874
10
$163,476
0
$0
14
$294,885
0
$0
FILES CLOSED FOR INCOMPLETENESS
4
$445,148
15
$326,731
70
$363,811
4
$66,828
0
$0
0
$0
0
$0
Aggregated Statistics For Year 2008 (Based on 14 full and 20 partial tracts)
A) FHA, FSA/RHS & VA Home Purchase Loans
B) Conventional Home Purchase Loans
C) Refinancings
D) Home Improvement Loans
E) Loans on Dwellings For 5+ Families
F) Non-occupant Loans on < 5 Family Dwellings (A B C & D)
G) Loans On Manufactured Home Dwelling (A B C & D)
Number
Average Value
Number
Average Value
Number
Average Value
Number
Average Value
Number
Average Value
Number
Average Value
Number
Average Value
LOANS ORIGINATED
37
$477,594
214
$344,731
208
$303,313
36
$126,385
34
$2,187,834
36
$327,022
0
$0
APPLICATIONS APPROVED, NOT ACCEPTED
2
$452,320
63
$307,693
57
$347,465
9
$117,549
0
$0
8
$334,079
0
$0
APPLICATIONS DENIED
21
$504,042
117
$379,416
260
$336,476
95
$119,111
6
$741,960
26
$218,540
2
$170,110
APPLICATIONS WITHDRAWN
6
$527,495
35
$385,426
115
$350,596
8
$193,739
6
$1,769,040
14
$329,918
0
$0
FILES CLOSED FOR INCOMPLETENESS
4
$357,662
24
$402,437
48
$387,319
2
$36,730
0
$0
0
$0
0
$0
Aggregated Statistics For Year 2007 (Based on 14 full and 20 partial tracts)
A) FHA, FSA/RHS & VA Home Purchase Loans
B) Conventional Home Purchase Loans
C) Refinancings
D) Home Improvement Loans
E) Loans on Dwellings For 5+ Families
F) Non-occupant Loans on < 5 Family Dwellings (A B C & D)
G) Loans On Manufactured Home Dwelling (A B C & D)
Number
Average Value
Number
Average Value
Number
Average Value
Number
Average Value
Number
Average Value
Number
Average Value
Number
Average Value
LOANS ORIGINATED
1
$234,230
537
$331,056
451
$319,785
104
$192,646
26
$1,096,172
86
$386,674
2
$52,510
APPLICATIONS APPROVED, NOT ACCEPTED
1
$142,000
150
$315,564
161
$321,020
51
$138,385
3
$1,180,653
41
$333,438
2
$52,510
APPLICATIONS DENIED
4
$454,775
403
$374,241
447
$373,313
144
$98,828
3
$4,737,223
76
$304,675
3
$90,487
APPLICATIONS WITHDRAWN
1
$348,370
105
$293,351
166
$353,379
26
$187,374
3
$2,519,043
26
$316,902
0
$0
FILES CLOSED FOR INCOMPLETENESS
0
$0
47
$318,861
80
$380,281
6
$276,237
2
$293,910
8
$337,474
0
$0
Aggregated Statistics For Year 2006 (Based on 14 full and 20 partial tracts)
A) FHA, FSA/RHS & VA Home Purchase Loans
B) Conventional Home Purchase Loans
C) Refinancings
D) Home Improvement Loans
E) Loans on Dwellings For 5+ Families
F) Non-occupant Loans on < 5 Family Dwellings (A B C & D)
G) Loans On Manufactured Home Dwelling (A B C & D)
Number
Average Value
Number
Average Value
Number
Average Value
Number
Average Value
Number
Average Value
Number
Average Value
Number
Average Value
LOANS ORIGINATED
2
$432,585
776
$308,977
643
$292,773
105
$108,499
36
$1,696,535
137
$357,053
2
$82,950
APPLICATIONS APPROVED, NOT ACCEPTED
0
$0
146
$305,092
174
$289,562
40
$135,956
1
$1,300,880
19
$477,552
0
$0
APPLICATIONS DENIED
0
$0
419
$322,592
443
$322,407
107
$156,708
5
$1,722,382
81
$337,805
7
$365,393
APPLICATIONS WITHDRAWN
7
$284,510
179
$310,110
310
$317,816
43
$173,917
3
$323,230
43
$363,736
2
$342,895
FILES CLOSED FOR INCOMPLETENESS
0
$0
61
$331,668
86
$297,578
6
$148,002
0
$0
7
$461,777
0
$0
Aggregated Statistics For Year 2005 (Based on 14 full and 20 partial tracts)
A) FHA, FSA/RHS & VA Home Purchase Loans
B) Conventional Home Purchase Loans
C) Refinancings
D) Home Improvement Loans
E) Loans on Dwellings For 5+ Families
F) Non-occupant Loans on < 5 Family Dwellings (A B C & D)
G) Loans On Manufactured Home Dwelling (A B C & D)
Number
Average Value
Number
Average Value
Number
Average Value
Number
Average Value
Number
Average Value
Number
Average Value
Number
Average Value
LOANS ORIGINATED
0
$0
750
$302,635
609
$288,468
110
$130,432
27
$1,168,015
129
$330,742
2
$155,670
APPLICATIONS APPROVED, NOT ACCEPTED
0
$0
132
$311,603
153
$269,547
30
$96,820
2
$3,009,400
22
$339,522
3
$160,730
APPLICATIONS DENIED
2
$548,680
264
$310,111
471
$332,383
116
$121,373
3
$520,093
60
$355,549
5
$275,024
APPLICATIONS WITHDRAWN
2
$352,690
174
$302,646
375
$296,406
57
$228,654
9
$4,193,423
45
$319,298
2
$105,615
FILES CLOSED FOR INCOMPLETENESS
0
$0
90
$252,130
256
$329,823
5
$270,738
0
$0
8
$256,635
2
$61,215
Aggregated Statistics For Year 2004 (Based on 14 full and 20 partial tracts)
A) FHA, FSA/RHS & VA Home Purchase Loans
B) Conventional Home Purchase Loans
C) Refinancings
D) Home Improvement Loans
E) Loans on Dwellings For 5+ Families
F) Non-occupant Loans on < 5 Family Dwellings (A B C & D)
G) Loans On Manufactured Home Dwelling (A B C & D)
Number
Average Value
Number
Average Value
Number
Average Value
Number
Average Value
Number
Average Value
Number
Average Value
Number
Average Value
LOANS ORIGINATED
19
$308,454
706
$264,912
734
$254,429
88
$90,507
36
$1,033,912
139
$268,841
1
$45,000
APPLICATIONS APPROVED, NOT ACCEPTED
0
$0
110
$270,134
182
$255,689
20
$111,724
2
$346,780
34
$257,383
1
$70,000
APPLICATIONS DENIED
7
$248,104
179
$275,108
464
$258,781
126
$82,519
3
$219,373
62
$261,196
0
$0
APPLICATIONS WITHDRAWN
2
$265,535
122
$274,730
328
$255,798
45
$122,628
4
$262,562
42
$234,945
0
$0
FILES CLOSED FOR INCOMPLETENESS
0
$0
35
$283,220
153
$281,103
18
$141,217
0
$0
9
$308,661
0
$0
Aggregated Statistics For Year 2003 (Based on 14 full and 20 partial tracts)
A) FHA, FSA/RHS & VA Home Purchase Loans
B) Conventional Home Purchase Loans
C) Refinancings
D) Home Improvement Loans
E) Loans on Dwellings For 5+ Families
F) Non-occupant Loans on < 5 Family Dwellings (A B C & D)
Number
Average Value
Number
Average Value
Number
Average Value
Number
Average Value
Number
Average Value
Number
Average Value
LOANS ORIGINATED
30
$291,641
480
$252,969
1,227
$208,861
40
$52,933
37
$1,286,090
140
$268,274
APPLICATIONS APPROVED, NOT ACCEPTED
0
$0
100
$240,597
245
$214,715
27
$104,517
5
$680,130
27
$207,244
APPLICATIONS DENIED
4
$343,425
106
$265,471
513
$228,671
84
$44,160
4
$1,880,645
79
$256,254
APPLICATIONS WITHDRAWN
2
$135,095
82
$257,772
373
$218,118
36
$32,017
11
$835,230
36
$252,385
FILES CLOSED FOR INCOMPLETENESS
0
$0
15
$255,930
81
$233,040
1
$32,990
0
$0
12
$206,852
Aggregated Statistics For Year 2002 (Based on 14 full and 20 partial tracts)
A) FHA, FSA/RHS & VA Home Purchase Loans
B) Conventional Home Purchase Loans
C) Refinancings
D) Home Improvement Loans
E) Loans on Dwellings For 5+ Families
F) Non-occupant Loans on < 5 Family Dwellings (A B C & D)
Number
Average Value
Number
Average Value
Number
Average Value
Number
Average Value
Number
Average Value
Number
Average Value
LOANS ORIGINATED
31
$260,110
411
$217,607
716
$188,879
62
$53,741
22
$752,015
85
$223,424
APPLICATIONS APPROVED, NOT ACCEPTED
4
$244,748
70
$219,837
176
$178,533
24
$87,353
4
$481,950
21
$215,299
APPLICATIONS DENIED
7
$252,021
92
$232,531
335
$178,046
73
$42,994
2
$176,900
36
$193,230
APPLICATIONS WITHDRAWN
2
$405,395
60
$208,521
241
$186,768
35
$38,770
1
$188,000
12
$242,071
FILES CLOSED FOR INCOMPLETENESS
3
$314,443
17
$166,255
102
$185,161
5
$72,840
0
$0
11
$199,149
Aggregated Statistics For Year 2001 (Based on 14 full and 20 partial tracts)
A) FHA, FSA/RHS & VA Home Purchase Loans
B) Conventional Home Purchase Loans
C) Refinancings
D) Home Improvement Loans
E) Loans on Dwellings For 5+ Families
F) Non-occupant Loans on < 5 Family Dwellings (A B C & D)
Number
Average Value
Number
Average Value
Number
Average Value
Number
Average Value
Number
Average Value
Number
Average Value
LOANS ORIGINATED
49
$245,982
426
$204,694
550
$175,636
61
$44,795
12
$798,302
60
$184,622
APPLICATIONS APPROVED, NOT ACCEPTED
10
$219,053
47
$197,486
169
$138,044
23
$26,745
0
$0
10
$205,005
APPLICATIONS DENIED
20
$256,307
93
$235,748
331
$150,896
101
$36,758
4
$2,181,030
26
$189,538
APPLICATIONS WITHDRAWN
15
$238,736
54
$217,907
225
$163,026
42
$30,322
3
$325,417
15
$153,478
FILES CLOSED FOR INCOMPLETENESS
3
$290,513
13
$264,144
65
$150,559
13
$88,053
0
$0
0
$0
Aggregated Statistics For Year 2000 (Based on 14 full and 20 partial tracts)
A) FHA, FSA/RHS & VA Home Purchase Loans
B) Conventional Home Purchase Loans
C) Refinancings
D) Home Improvement Loans
E) Loans on Dwellings For 5+ Families
F) Non-occupant Loans on < 5 Family Dwellings (A B C & D)
Number
Average Value
Number
Average Value
Number
Average Value
Number
Average Value
Number
Average Value
Number
Average Value
LOANS ORIGINATED
59
$203,610
302
$176,659
186
$118,973
66
$22,352
24
$1,264,708
35
$180,903
APPLICATIONS APPROVED, NOT ACCEPTED
5
$181,026
53
$205,269
50
$98,719
47
$37,013
2
$242,240
3
$132,573
APPLICATIONS DENIED
17
$224,276
125
$179,710
234
$120,528
94
$32,430
0
$0
18
$219,107
APPLICATIONS WITHDRAWN
11
$195,835
34
$201,585
243
$94,157
19
$35,131
2
$1,684,360
17
$156,506
FILES CLOSED FOR INCOMPLETENESS
0
$0
11
$183,159
28
$136,666
2
$17,310
0
$0
1
$127,000
Aggregated Statistics For Year 1999 (Based on 9 full and 10 partial tracts)
A) FHA, FSA/RHS & VA Home Purchase Loans
B) Conventional Home Purchase Loans
C) Refinancings
D) Home Improvement Loans
E) Loans on Dwellings For 5+ Families
F) Non-occupant Loans on < 5 Family Dwellings (A B C & D)
2007 - 2018 National Fire Incident Reporting System (NFIRS) incidents
Based on the data from the years 2007 - 2018 the average number of fire incidents per year is 175. The highest number of fires - 223 took place in 2008, and the least - 94 in 2007. The data has a rising trend.
When looking into fire subcategories, the most incidents belonged to: Structure Fires (64.7%), and Outside Fires (21.3%).
Fire incident types reported to NFIRS in Zip Code 10461


 Nearest zip codes: 10462, 10469, 10465, 10475, 10467, 10473.


 Based on the data from the years 2007 - 2018 the average number of fire incidents per year is 175. The highest number of fires - 223 took place in 2008, and the least - 94 in 2007. The data has a rising trend.
 When looking into fire subcategories, the most incidents belonged to: Structure Fires (64.7%), and Outside Fires (21.3%).