Estimated zip code population in 2022: 45,576 Zip code population in 2010: 42,230 Zip code population in 2000: 42,500
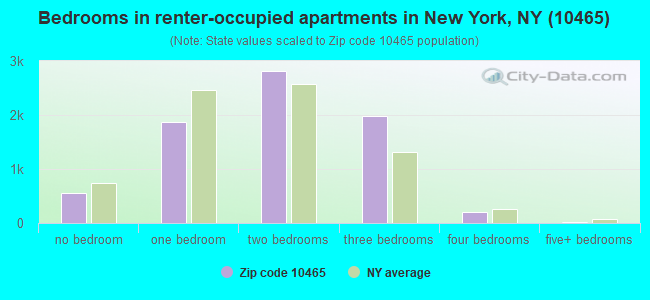
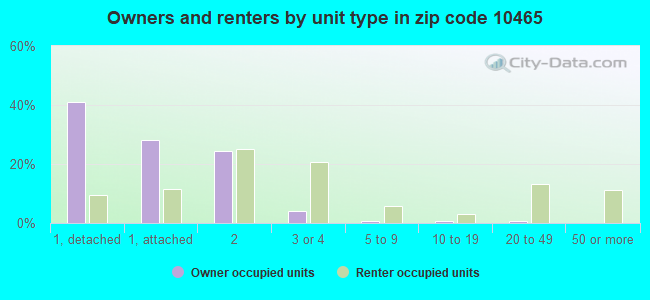
Houses and condos: 17,199 Renter-occupied apartments: 7,452
% of renters here:
45%
State:
46%
March 2022 cost of living index in zip code 10465: 148.0 (very high, U.S. average is 100)
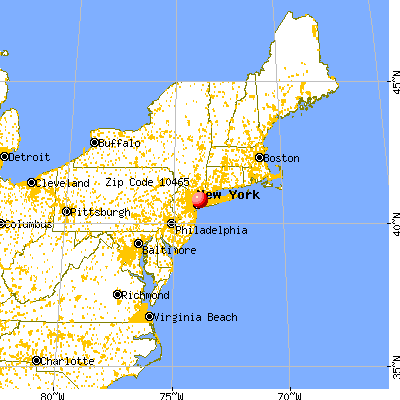
Land area: 3.4 sq. mi. Water area: 0.0 sq. mi.
Population density: 13,289 people per square mile
(very high).
OSM Map
General Map
Google Map
MSN Map
OSM Map
General Map
Google Map
MSN Map
OSM Map
General Map
Google Map
MSN Map
OSM Map
General Map
Google Map
MSN Map
Please wait while loading the map...
Real estate property taxes paid for housing units in 2022:
This zip code:
0.9% ($5,528)
New York:
1.5% ($6,180)
Median real estate property taxes paid for housing units with mortgages in 2022: $5,585 (0.9%) Median real estate property taxes paid for housing units with no mortgage in 2022: $5,444 (0.9%)
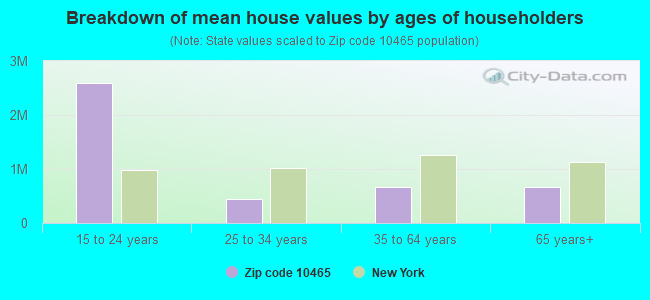
Estimated median house/condo value in 2022: $612,327
10465:
$612,327
New York:
$400,400
According to our research of New York and other state lists, there were 17 registered sex offenders living in 10465 zip code as of May 21, 2024. The ratio of all residents to sex offenders in zip code 10465 is 2,682 to 1. The ratio of registered sex offenders to all residents in this zip code is much lower than the state average.
Median resident age:
This zip code:
38.6 years
New York median age:
40.0 years
Average household size:
This zip code:
2.6 people
New York:
2.5 people
Averages for the 2020 tax year for zip code 10465, filed in 2021:
Average Adjusted Gross Income (AGI) in 2020: $64,189 (Individual Income Tax Returns)
Here:
$64,189
State:
$90,930
Salary/wage: $59,672 (reported on 80.3% of returns)
Here:
$59,672
State:
$72,104
(% of AGI for various income ranges: 900.9% for AGIs below $25k, 3367.4% for AGIs $25k-50k, 6413.9% for AGIs $50k-75k, 9773.1% for AGIs $75k-100k, 17257.0% for AGIs $100k-200k, 56835.2% for AGIs over 200k)
Taxable interest for individuals: $930 (reported on 29.0% of returns)
This zip code:
$930
New York:
$3,075
(% of AGI for various income ranges: 13.5% for AGIs below $25k, 16.5% for AGIs $25k-50k, 23.6% for AGIs $50k-75k, 50.8% for AGIs $75k-100k, 81.7% for AGIs $100k-200k, 508.4% for AGIs over 200k)
Ordinary dividends: $2,931 (reported on 14.4% of returns)
Here:
$2,931
State:
$11,095
(% of AGI for various income ranges: 16.7% for AGIs below $25k, 20.3% for AGIs $25k-50k, 33.0% for AGIs $50k-75k, 85.6% for AGIs $75k-100k, 148.9% for AGIs $100k-200k, 772.4% for AGIs over 200k)
Net capital gain/loss in AGI: +$14,033 (reported on 12.9% of returns)
Here:
+$14,033
State:
+$44,925
(% of AGI for various income ranges: 7.8% for AGIs below $25k, 13.4% for AGIs $25k-50k, 43.0% for AGIs $50k-75k, 102.4% for AGIs $75k-100k, 318.4% for AGIs $100k-200k, 10834.4% for AGIs over 200k)
Profit/loss from business: +$7,451 (reported on 13.7% of returns)
Here:
+$7,451
State:
+$14,940
(% of AGI for various income ranges: 158.4% for AGIs below $25k, 102.0% for AGIs $25k-50k, 82.0% for AGIs $50k-75k, 140.9% for AGIs $75k-100k, 192.5% for AGIs $100k-200k, 918.4% for AGIs over 200k)
Taxable individual retirement arrangement distribution: $14,760 (reported on 5.5% of returns)
10465:
$14,760
New York:
$19,609
(% of AGI for various income ranges: 33.4% for AGIs below $25k, 55.2% for AGIs $25k-50k, 106.1% for AGIs $50k-75k, 164.9% for AGIs $75k-100k, 270.2% for AGIs $100k-200k, 942.0% for AGIs over 200k)
Self-employed (Keogh) retirement plans: $14,033 (reported on 0.1% of returns)
10465:
$14,033
New York:
$32,497
(% of AGI for various income ranges: 20.7% for AGIs $100k-200k)
Total itemized deductions: $26,756 (reported on 12.6% of returns)
Here:
$26,756
State:
$39,326
(% of AGI for various income ranges: 47.7% for AGIs below $25k, 152.5% for AGIs $25k-50k, 364.2% for AGIs $50k-75k, 757.1% for AGIs $75k-100k, 1489.3% for AGIs $100k-200k, 3823.6% for AGIs over 200k)
Charity contributions: $4,664 (reported on 10.2% of returns)
Here:
$4,664
State:
$15,420
(% of AGI for various income ranges: 2.2% for AGIs below $25k, 12.7% for AGIs $25k-50k, 41.9% for AGIs $50k-75k, 88.9% for AGIs $75k-100k, 226.8% for AGIs $100k-200k, 839.2% for AGIs over 200k)
Taxes paid: $8,883 (reported on 12.6% of returns)
10465:
$8,883
State:
$9,183
(% of AGI for various income ranges: 12.1% for AGIs below $25k, 40.7% for AGIs $25k-50k, 119.4% for AGIs $50k-75k, 270.6% for AGIs $75k-100k, 522.3% for AGIs $100k-200k, 1146.8% for AGIs over 200k)
Earned income credit: $2,193 (reported on 14.9% of returns)
Here:
$2,193
State:
$2,138
(% of AGI for various income ranges: 107.4% for AGIs below $25k, 62.9% for AGIs $25k-50k)
Percentage of individuals using paid preparers for their 2020 taxes: 95.1%
Here:
95%
State:
95%
(% for various income ranges: 93.4% for AGIs below $25k, 95.8% for AGIs $25k-50k, 96.0% for AGIs $50k-75k, 95.2% for AGIs $75k-100k, 95.7% for AGIs $100k-200k, 97.1% for AGIs over 200k)
Averages for the 2012 tax year for zip code 10465, filed in 2013:
Average Adjusted Gross Income (AGI) in 2012: $55,394 (Individual Income Tax Returns)
Here:
$55,394
State:
$77,088
Salary/wage: $53,939 (reported on 82.5% of returns)
Here:
$53,939
State:
$60,593
(% of AGI for various income ranges: 61.7% for AGIs below $25k, 82.0% for AGIs $25k-50k, 82.2% for AGIs $50k-75k, 83.5% for AGIs $75k-100k, 83.4% for AGIs $100k-200k, 71.7% for AGIs over 200k)
Taxable interest for individuals: $1,062 (reported on 35.7% of returns)
This zip code:
$1,062
New York:
$3,125
(% of AGI for various income ranges: 1.4% for AGIs below $25k, 0.5% for AGIs $25k-50k, 0.5% for AGIs $50k-75k, 0.4% for AGIs $75k-100k, 0.6% for AGIs $100k-200k, 1.7% for AGIs over 200k)
Ordinary dividends: $2,393 (reported on 16.5% of returns)
Here:
$2,393
State:
$10,299
(% of AGI for various income ranges: 1.3% for AGIs below $25k, 0.7% for AGIs $25k-50k, 0.7% for AGIs $50k-75k, 0.6% for AGIs $75k-100k, 0.5% for AGIs $100k-200k, 1.2% for AGIs over 200k)
Net capital gain/loss in AGI: +$3,001 (reported on 11.2% of returns)
Here:
+$3,001
State:
+$42,474
(% of AGI for various income ranges: 0.2% for AGIs $75k-100k, 0.5% for AGIs $100k-200k, 4.9% for AGIs over 200k)
Profit/loss from business: +$9,403 (reported on 12.3% of returns)
Here:
+$9,403
State:
+$16,168
(% of AGI for various income ranges: 12.8% for AGIs below $25k, 1.4% for AGIs $25k-50k, 0.8% for AGIs $50k-75k, 1.2% for AGIs $75k-100k, 1.1% for AGIs $100k-200k, 2.8% for AGIs over 200k)
Taxable individual retirement arrangement distribution: $11,152 (reported on 7.4% of returns)
10465:
$11,152
New York:
$17,621
(% of AGI for various income ranges: 2.6% for AGIs below $25k, 1.6% for AGIs $25k-50k, 1.6% for AGIs $50k-75k, 1.2% for AGIs $75k-100k, 1.3% for AGIs $100k-200k, 1.2% for AGIs over 200k)
Self-employment retirement plans: $12,100 (reported on 0.2% of returns)
10465:
$12,100
New York:
$27,330
Total itemized deductions: $22,911 (25% of AGI, reported on 42.0% of returns)
Here:
$22,911
State:
$34,985
Here:
25.2% of AGI
State:
21.3% of AGI
(% of AGI for various income ranges: 8.1% for AGIs below $25k, 13.1% for AGIs $25k-50k, 17.5% for AGIs $50k-75k, 19.4% for AGIs $75k-100k, 20.1% for AGIs $100k-200k, 18.6% for AGIs over 200k)
Charity contributions: $2,542 (reported on 36.5% of returns)
Here:
$2,542
State:
$5,572
(% of AGI for various income ranges: 0.5% for AGIs below $25k, 1.5% for AGIs $25k-50k, 1.9% for AGIs $50k-75k, 1.9% for AGIs $75k-100k, 1.8% for AGIs $100k-200k, 1.5% for AGIs over 200k)
Taxes paid: $9,892 (reported on 41.8% of returns)
10465:
$9,892
State:
$18,656
(% of AGI for various income ranges: 2.1% for AGIs below $25k, 3.5% for AGIs $25k-50k, 6.6% for AGIs $50k-75k, 8.3% for AGIs $75k-100k, 9.7% for AGIs $100k-200k, 11.2% for AGIs over 200k)
Earned income credit: $2,116 (reported on 16.3% of returns)
Here:
$2,116
State:
$2,230
(% of AGI for various income ranges: 6.9% for AGIs below $25k, 0.8% for AGIs $25k-50k)
Percentage of individuals using paid preparers for their 2012 taxes: 74.5%
Here:
75%
State:
66%
(% for various income ranges: 71.9% for AGIs below $25k, 72.1% for AGIs $25k-50k, 75.9% for AGIs $50k-75k, 78.2% for AGIs $75k-100k, 80.1% for AGIs $100k-200k, 80.6% for AGIs over 200k)
Averages for the 2004 tax year for zip code 10465, filed in 2005:
Average Adjusted Gross Income (AGI) in 2004: $46,199 (Individual Income Tax Returns)
Here:
$46,199
State:
$59,519
Salary/wage: $45,923 (reported on 83.7% of returns)
Here:
$45,923
State:
$50,673
(% of AGI for various income ranges: 87.4% for AGIs below $10k, 67.8% for AGIs $10k-25k, 85.4% for AGIs $25k-50k, 86.7% for AGIs $50k-75k, 87.7% for AGIs $75k-100k, 79.3% for AGIs over 100k)
Taxable interest for individuals: $1,202 (reported on 52.6% of returns)
This zip code:
$1,202
New York:
$2,377
(% of AGI for various income ranges: 9.5% for AGIs below $10k, 3.1% for AGIs $10k-25k, 1.3% for AGIs $25k-50k, 1.1% for AGIs $50k-75k, 0.8% for AGIs $75k-100k, 1.1% for AGIs over 100k)
Taxable dividends: $1,666 (reported on 22.3% of returns)
Here:
$1,666
State:
$5,394
(% of AGI for various income ranges: 3.9% for AGIs below $10k, 1.6% for AGIs $10k-25k, 0.6% for AGIs $25k-50k, 0.6% for AGIs $50k-75k, 0.6% for AGIs $75k-100k, 1.0% for AGIs over 100k)
Net capital gain/loss: +$4,966 (reported on 15.2% of returns)
Here:
+$4,966
State:
+$23,581
(% of AGI for various income ranges: -2.7% for AGIs below $10k, 0.7% for AGIs $10k-25k, -0.1% for AGIs $25k-50k, 0.3% for AGIs $50k-75k, 0.2% for AGIs $75k-100k, 5.6% for AGIs over 100k)
Profit/loss from business: +$8,261 (reported on 10.6% of returns)
Here:
+$8,261
State:
+$13,809
(% of AGI for various income ranges: 17.9% for AGIs below $10k, 5.8% for AGIs $10k-25k, 1.4% for AGIs $25k-50k, 0.9% for AGIs $50k-75k, 1.0% for AGIs $75k-100k, 1.9% for AGIs over 100k)
IRA payment deduction: $3,122 (reported on 2.6% of returns)
10465:
$3,122
New York:
$3,115
(% of AGI for various income ranges: 0.3% for AGIs below $10k, 0.3% for AGIs $10k-25k, 0.3% for AGIs $25k-50k, 0.2% for AGIs $50k-75k, 0.1% for AGIs $75k-100k, 0.1% for AGIs over 100k)
Self-employed pension: $9,900 (reported on 0.4% of returns)
Here:
$9,900
New York:
$19,016
Total itemized deductions: $19,372 (27% of AGI, reported on 45.6% of returns)
Here:
$19,372
State:
$25,864
Here:
26.8% of AGI
State:
21.9% of AGI
(% of AGI for various income ranges: 11.7% for AGIs below $10k, 10.5% for AGIs $10k-25k, 16.4% for AGIs $25k-50k, 21.6% for AGIs $50k-75k, 21.8% for AGIs $75k-100k, 20.2% for AGIs over 100k)
Charity contributions deductions: $2,701 (4% of AGI, reported on 43.0% of returns)
Here:
$2,701
State:
$4,439
Here:
3.7% of AGI
State:
3.6% of AGI
(% of AGI for various income ranges: 0.5% for AGIs below $10k, 1.3% for AGIs $10k-25k, 2.5% for AGIs $25k-50k, 3.0% for AGIs $50k-75k, 2.7% for AGIs $75k-100k, 2.4% for AGIs over 100k)
Total tax: $5,897 (reported on 78.0% of returns)
10465:
$5,897
State:
$11,730
(% of AGI for various income ranges: 3.9% for AGIs below $10k, 3.8% for AGIs $10k-25k, 6.9% for AGIs $25k-50k, 9.2% for AGIs $50k-75k, 10.3% for AGIs $75k-100k, 14.8% for AGIs over 100k)
Earned income credit: $1,628 (reported on 13.0% of returns)
Here:
$1,628
State:
$1,757
Percentage of individuals using paid preparers for their 2004 taxes: 72.3%
Here:
72%
State:
67%
(% for various income ranges: 66.7% for AGIs below $10k, 72.9% for AGIs $10k-25k, 71.2% for AGIs $25k-50k, 73.5% for AGIs $50k-75k, 75.4% for AGIs $75k-100k, 78.4% for AGIs over 100k)
Likely homosexual households (counted as self-reported same-sex unmarried-partner households)
Lesbian couples: 0.2% of all households
Gay men: 0.1% of all households
Household received Food Stamps/SNAP in the past 12 months: 3,117 Household did not receive Food Stamps/SNAP in the past 12 months: 13,462
Women who had a birth in the past 12 months: 694 (259 now married, 447 unmarried) Women who did not have a birth in the past 12 months: 9,786 (3,080 now married, 6,729 unmarried)
Housing units in zip code 10465 with a mortgage: 5,945 (399 second mortgage, 5 home equity loan, 333 both second mortgage and home equity loan) Houses without a mortgage: 151
Median monthly owner costs for units with a mortgage: $3,009 Median monthly owner costs for units without a mortgage: $1,104
Residents with income below the poverty level in 2022:
This zip code:
14.7%
Whole state:
14.3%
Residents with income below 50% of the poverty level in 2022:
This zip code:
5.9%
Whole state:
6.8%
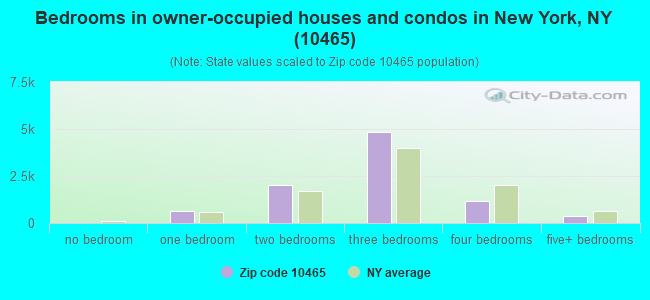
Median number of rooms in houses and condos:
Here:
5.5
State:
6.3
Median number of rooms in apartments:
Here:
4.1
State:
3.8
Notable locations in this zip code not listed on our city pages
Notable locations in zip code 10465: Theodore Korony Square (A), Locust Point Yacht Club (B), Locust Point Marina (C), Deutscher Sport Club (D), Ampere Fishing Club (E), Fire Department New York Engine 72 Satellite 2 (F), Throg's Neck Branch New York Public Library (G), Riesenberg Gymnasium (H), Maritime Industry Museum (I), Heritage Hall (J), Fire Department New York Engine 89 Ladder 50 (K), Fortyfifth Precinct Police Station (L), Marguerite Hall (M), Providence Rest Home for Aged Women (N), New York Ladder Company 50 (O), New York Satellite Company 2 (P), Throgs Neck Lighthouse (Q), Vander Clute Hall (R), Stephen B Luce Library (S). Display/hide their locations on the map
Churches in zip code 10465 include: Saint Frances De Chantal Roman Catholic Church (A), Church of the Master (B), Kingdom Hall of Jehovahs Witnesses (C), Saint Benedict's Roman Catholic Church (D), Monastery of Saint Clare (E). Display/hide their locations on the map
Parks in zip code 10465 include: Bicentennial Veterans Park At Weir Creek (1), Reinhart Field (2), Ferry Point Park (3), Bruckner Playground (4), Derosa-O'Boyle Triangle (5). Display/hide their locations on the map
4,729 married couples with children.
3,485 single-parent households (866 men, 2,619 women).
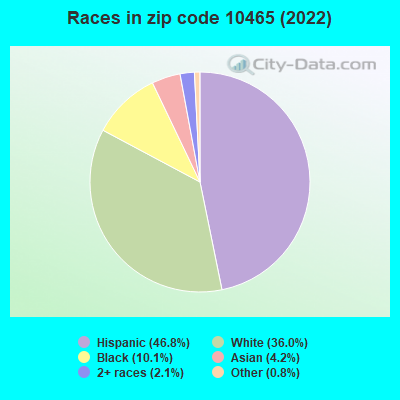
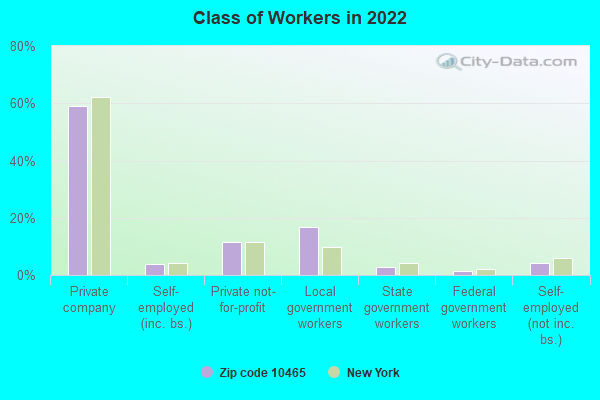
58.7% of residents of 10465 zip code speak English at home.
30.1% of residents speak Spanish at home (76% very well, 13% well, 8% not well, 3% not at all).
7.1% of residents speak other Indo-European language at home (66% very well, 17% well, 15% not well, 2% not at all).
2.5% of residents speak Asian or Pacific Island language at home (53% very well, 24% well, 20% not well, 3% not at all).
1.0% of residents speak other language at home (63% very well, 16% well, 19% not well, 2% not at all).
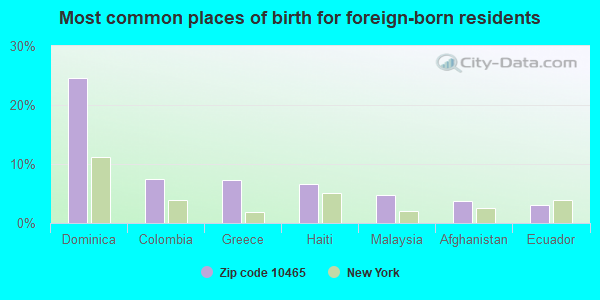
Foreign born population: 7,919 (17.4%) (67.2% of them are naturalized citizens)
This zip code:
17.4%
Whole state:
22.7%
25%Dominica
7%Colombia
7%Greece
7%Haiti
5%Malaysia
4%Afghanistan
3%Ecuador
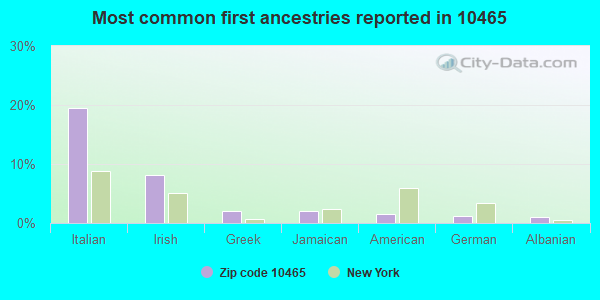
20%Italian
8%Irish
2%Greek
2%Jamaican
1%American
1%German
1%Albanian
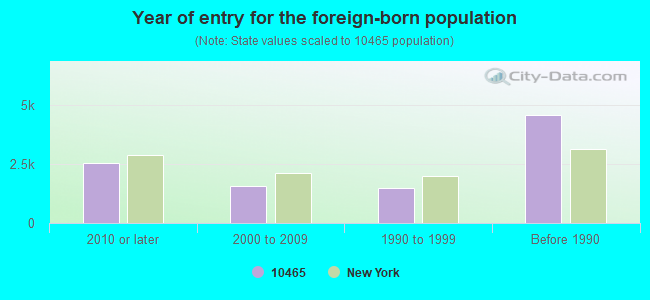
Year of entry for the foreign-born population
2,5242010 or later
1,5512000 to 2009
1,4881990 to 1999
4,578Before 1990
Major facilities with environmental interests located in this zip code:
J & P DRYCLEANERS (3468 EAST TREMONT AVENUE in BRONX, NY)
AIR MINOR (AIRS/AFS) STATE MASTER (New York facility tracking) - AIR PROGRAM (Resource Conservation and Recovery Act (tracking hazardous waste)) Business SIC classification: DRYCLEANING PLANTS, EXCEPT RUG CLEANING Business NAICS classification: DRYCLEANING AND LAUNDRY SERVICES (EXCEPT COIN-OPERATED). Organizations: J & P II DRY CLEANERS CORP, MR ROBERT S CLEANERS (LEGALLY RESPONSIBLE PARTY)
, TREMONT CLEANERS INC (LEGALLY RESPONSIBLE PARTY)
, NEW TREMONT CLEANERS INC (LEGALLY RESPONSIBLE PARTY)
Alternative names: MR ROBERTS CLEANERS, ROBERT CLEANERS, TREMONT CLEANERS
H.O. PENN MACHINERY COMPANY, INC. (699 BRUSH AVENUE in BRONX, NY)
ENFORCEMENT/COMPLIANCE ACTIVITY (Integrated Compliance Information System) Conditionally Exempt Small Quantity Generators, less than 100 kg/month of hazardous waste (Resource Conservation and Recovery Act (tracking hazardous waste)) - ICIS-, ENFORCEMENT/COMPLIANCE ACTIVITY Conditionally Exempt Small Quantity Generators, less than 100 kg/month of hazardous waste (Resource Conservation and Recovery Act (tracking hazardous waste)) USED OIL PROGRAM (Resource Conservation and Recovery Act (tracking hazardous waste)) Business SIC classification: CONSTRUCTION MACHINERY AND EQUIPMENT Organizations: HO PENN MACHINERY CO INC (CONTACT/OPERATOR)
, CIMINELLO PROPERTY ASSOCIATES (CONTACT/OWNER)
Alternative names: H O PENN (CATERPILLAR), HO PENN, HO PENN MACHINERY CO.
IS 192 PIAGENTINI JONES SCHOOL ( in BRONX, NY)
(National Center for Education Statistics) - STATE ID-320800010192 Organizations: NEW YORK CITY PUBLIC SCHOOLS (SCHOOL DISTRICT)
CON ED - EAST TREMONT AVE (OPP SOMMER PL UNIT 1 in BRONX, NY)
HAZARDOUS WASTE BIENNIAL REPORTER (Resource Conservation and Recovery Act (tracking hazardous waste)) (Resource Conservation and Recovery Act (tracking hazardous waste)) Alternative names: CON ED - EAST TREMONT AVE OPP SOMMER PL
BIG APPLE WRECKING CORP (748 BRUSH AVE in BRONX, NY)
(Integrated Compliance Information System) - ICIS-02-1988-0184, FORMAL ENFORCEMENT ACTION, ICIS-02-1988-0384, Business SIC classification: STRUCTURAL STEEL ERECTION; WRECKING AND DEMOLITION WORK
GETTY PETROLEUM CORP #98967 (4017 EAST TREMONT AVENUE in BRONX, NY)
HAZARDOUS WASTE BIENNIAL REPORTER (Resource Conservation and Recovery Act (tracking hazardous waste)) Large Quantity Generators, more that 1000 kg of hazardous waste/month (Resource Conservation and Recovery Act (tracking hazardous waste)) - notification
CON EDISON - GD 30450 (MILES AVE. & BALCOM AVE. in BRONX, NY)
Large Quantity Generators, more that 1000 kg of hazardous waste/month (Resource Conservation and Recovery Act (tracking hazardous waste)) Organizations: CONSOLIDATED EDISON COMPANY OF NY, INC. (CONTACT/OPERATOR)
CIMINELLO P ROPERTIES (900 BRUSH AVE in BRONX, NY)
HAZARDOUS WASTE BIENNIAL REPORTER (Resource Conservation and Recovery Act (tracking hazardous waste)) (Resource Conservation and Recovery Act (tracking hazardous waste))
CON ED - V 2185 (HUTCH RIVER PK & LAFAYETTE AVE in BRONX, NY)
HAZARDOUS WASTE BIENNIAL REPORTER (Resource Conservation and Recovery Act (tracking hazardous waste)) (Resource Conservation and Recovery Act (tracking hazardous waste))
CON ED - V2558 (ST JOSEPH RD & HUTCHDRIVER PKY in BRONX, NY)
HAZARDOUS WASTE BIENNIAL REPORTER (Resource Conservation and Recovery Act (tracking hazardous waste)) (Resource Conservation and Recovery Act (tracking hazardous waste))
815 HUTCHINSON PKWY ASSOC (815 HUTCHINSON RIVER PKWY in BRONX, NY)
(Resource Conservation and Recovery Act (tracking hazardous waste))
H O PENN MACHINERY CO INC (699 BRUSH AVE in NEW YORK CITY, NY)
AIR MINOR (AIRS/AFS) Business SIC classification: MACHINE TOOLS, METAL FORMING TYPES
Housing units lacking complete plumbing facilities: 0.3% Housing units lacking complete kitchen facilities: 0.7%
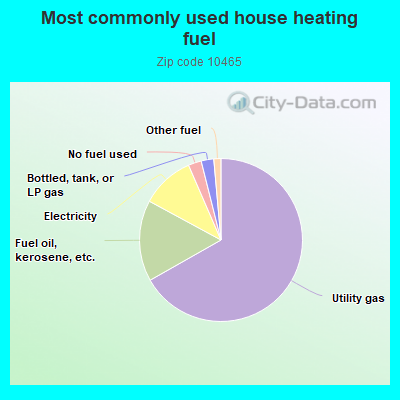
66.8%Utility gas
16.1%Fuel oil, kerosene, etc.
10.6%Electricity
2.6%No fuel used
2.5%Bottled, tank, or LP gas
1.4%Other fuel
Population in 1990: 37,457. Population change in the 1990s: +5,043 (+13.5%).
Place of birth for U.S.-born residents:
This state: 32,872
Northeast: 1,350
Midwest: 321
South: 609
West: 125
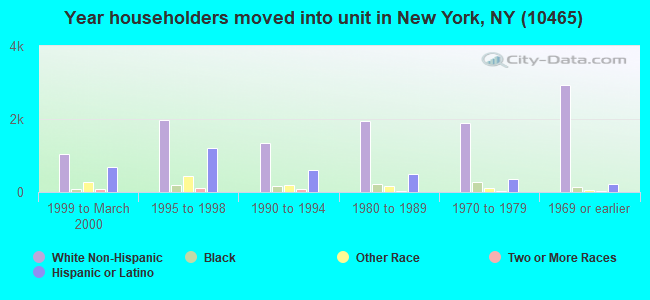
71% of the 10465 zip code residents lived in the same house 5 years ago. Out of people who lived in different houses, 78% lived in this county. Out of people who lived in different counties, 50% lived in New York.
93% of the 10465 zip code residents lived in the same house 1 year ago. Out of people who lived in different houses, 45% moved from this county. Out of people who lived in different houses, 30% moved from different county within same state. Out of people who lived in different houses, 3% moved from different state. Out of people who lived in different houses, 22% moved from abroad.
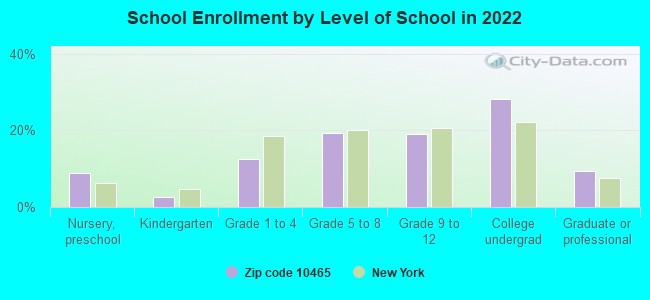
Private vs. public school enrollment:
Students in private schools in grades 1 to 8 (elementary and middle school): 949
Here:
23.8%
New York:
15.6%
Students in private schools in grades 9 to 12 (high school): 935
Here:
39.5%
New York:
15.0%
Students in private undergraduate colleges: 1,592
Here:
44.9%
New York:
39.2%
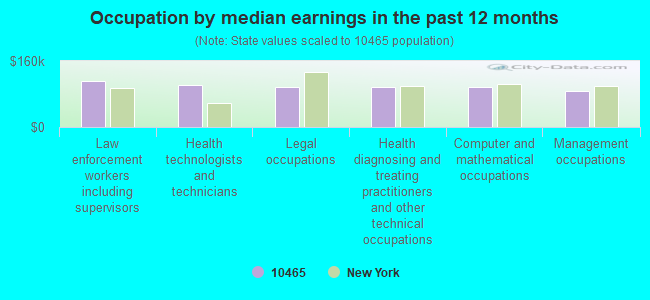
Occupation by median earnings in the past 12 months ($)
110,353Law enforcement workers including supervisors
102,030Health technologists and technicians
97,446Legal occupations
97,152Health diagnosing and treating practitioners and other technical occupations
95,840Computer and mathematical occupations
86,585Management occupations
Top industries in this zip code by the number of employees in 2005:
Health Care and Social Assistance: General Medical and Surgical Hospitals (over 1000 employees: 1 establishment)
Health Care and Social Assistance: Nursing Care Facilities (250-499: 1, 100-249: 1)
Construction: Commercial and Institutional Building Construction (250-499: 1, 10-19: 1, 1-4: 2)
Information: Cable and Other Subscription Programming (250-499: 1)
2007 - 2018 National Fire Incident Reporting System (NFIRS) incidents
Based on the data from the years 2007 - 2018 the average number of fire incidents per year is 172. The highest number of reported fires - 219 took place in 2010, and the least - 82 in 2007. The data has an increasing trend.
When looking into fire subcategories, the most incidents belonged to: Structure Fires (62.9%), and Outside Fires (23.1%).
Fire incident types reported to NFIRS in Zip Code 10465


 Nearest zip codes: 10461, 10473, 11357, 10462, 11356, 11351.


 Based on the data from the years 2007 - 2018 the average number of fire incidents per year is 172. The highest number of reported fires - 219 took place in 2010, and the least - 82 in 2007. The data has an increasing trend.
 When looking into fire subcategories, the most incidents belonged to: Structure Fires (62.9%), and Outside Fires (23.1%).