Estimated zip code population in 2022: 213 Zip code population in 2010: 270 Zip code population in 2000: 279
Houses and condos: 130 Renter-occupied apartments: 19
% of renters here:
19%
State:
46%
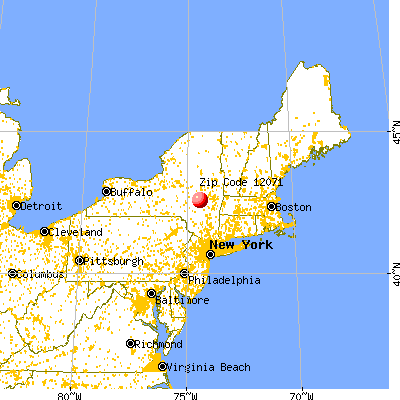
March 2022 cost of living index in zip code 12071: 94.3 (less than average, U.S. average is 100)
Land area: 9.2 sq. mi. Water area: 0.0 sq. mi.
Population density: 23 people per square mile
(very low).
OSM Map
General Map
Google Map
MSN Map
OSM Map
General Map
Google Map
MSN Map
OSM Map
General Map
Google Map
MSN Map
OSM Map
General Map
Google Map
MSN Map
Please wait while loading the map...
Real estate property taxes paid for housing units in 2022:
This zip code:
1.8% ($3,267)
New York:
1.5% ($6,180)
Median real estate property taxes paid for housing units with mortgages in 2022: $3,066 Median real estate property taxes paid for housing units with no mortgage in 2022: $4,389
Business Search- 14 Million verified businesses
Males: 120
(56.2%)
Females: 93
(43.8%)
For population 25 years and over in 12071:
High school or higher: 94.1%
Bachelor's degree or higher: 33.0%
Graduate or professional degree: 17.1%
Mean travel time to work (commute): 30.5 minutes
For population 15 years and over in 12071:
Never married: 18.3%
Now married: 74.0%
Separated: 0.0%
Widowed: 2.1%
Divorced: 5.6%
Zip code 12071 compared to state average:
Median house value below state average.
Unemployed percentage significantly below state average.
Black race population percentage significantly below state average.
Hispanic race population percentage significantly below state average.
Foreign-born population percentage significantly below state average.
Renting percentage significantly below state average.
Length of stay since moving in significantly below state average.
Number of college students significantly below state average.
Estimated median house/condo value in 2022: $180,237
12071:
$180,237
New York:
$400,400
According to our research of New York and other state lists, there was 1 registered sex offender living in 12071 zip code as of June 08, 2024. The ratio of all residents to sex offenders in zip code 12071 is 369 to 1.
Median resident age:
This zip code:
43.9 years
New York median age:
40.0 years
Average household size:
This zip code:
2.1 people
New York:
2.5 people
Averages for the 2020 tax year for zip code 12071, filed in 2021:
Average Adjusted Gross Income (AGI) in 2020: $44,843 (Individual Income Tax Returns)
Here:
$44,843
State:
$90,930
Salary/wage: $43,420 (reported on 71.4% of returns)
Here:
$43,420
State:
$72,104
(% of AGI for various income ranges: 1032.5% for AGIs below $25k, 3530.0% for AGIs $25k-50k, 3143.3% for AGIs $50k-75k)
Taxable interest for individuals: $200 (reported on 14.3% of returns)
This zip code:
$200
New York:
$3,075
(% of AGI for various income ranges: 10.0% for AGIs below $25k)
Ordinary dividends: $500 (reported on 14.3% of returns)
Here:
$500
State:
$11,095
(% of AGI for various income ranges: 25.0% for AGIs below $25k)
Earned income credit: $1,900 (reported on 21.4% of returns)
Here:
$1,900
State:
$2,138
(% of AGI for various income ranges: 142.5% for AGIs below $25k)
Percentage of individuals using paid preparers for their 2020 taxes: 100.0%
Here:
100%
State:
95%
(% for various income ranges: 100.0% for AGIs below $25k, 100.0% for AGIs $25k-50k, 100.0% for AGIs $50k-75k, 100.0% for AGIs $75k-100k)
Averages for the 2012 tax year for zip code 12071, filed in 2013:
Average Adjusted Gross Income (AGI) in 2012: $45,108 (Individual Income Tax Returns)
Here:
$45,108
State:
$77,088
Salary/wage: $38,890 (reported on 83.3% of returns)
Here:
$38,890
State:
$60,593
(% of AGI for various income ranges: 62.8% for AGIs below $25k, 137.9% for AGIs $25k-50k, 79.3% for AGIs $75k-100k)
Taxable interest for individuals: $200 (reported on 33.3% of returns)
This zip code:
$200
New York:
$3,125
Ordinary dividends: $200 (reported on 25.0% of returns)
Here:
$200
State:
$10,299
Total itemized deductions: $19,233 (22% of AGI, reported on 25.0% of returns)
Here:
$19,233
State:
$34,985
Here:
22.0% of AGI
State:
21.3% of AGI
(% of AGI for various income ranges: 47.6% for AGIs $50k-75k)
Taxes paid: $9,300 (reported on 25.0% of returns)
12071:
$9,300
State:
$18,656
(% of AGI for various income ranges: 23.0% for AGIs $50k-75k)
Earned income credit: $2,100 (reported on 25.0% of returns)
Here:
$2,100
State:
$2,230
(% of AGI for various income ranges: 9.8% for AGIs below $25k)
Percentage of individuals using paid preparers for their 2012 taxes: 66.7%
Here:
67%
State:
66%
(% for various income ranges: 60.0% for AGIs below $25k, 100.0% for AGIs $25k-50k, 100.0% for AGIs $75k-100k)
Averages for the 2004 tax year for zip code 12071, filed in 2005:
Average Adjusted Gross Income (AGI) in 2004: $31,169 (Individual Income Tax Returns)
Here:
$31,169
State:
$59,519
Salary/wage: $28,974 (reported on 77.7% of returns)
Here:
$28,974
State:
$50,673
(% of AGI for various income ranges: 75.7% for AGIs below $10k, 68.9% for AGIs $10k-25k, 81.1% for AGIs $25k-50k, 66.1% for AGIs $50k-75k)
Taxable interest for individuals: $181 (reported on 48.6% of returns)
This zip code:
$181
New York:
$2,377
(% of AGI for various income ranges: 0.7% for AGIs below $10k, 0.7% for AGIs $10k-25k, 0.2% for AGIs $25k-50k, 0.1% for AGIs $50k-75k)
Taxable dividends: $194 (reported on 24.3% of returns)
Here:
$194
State:
$5,394
Net capital gain/loss: +$909 (reported on 14.9% of returns)
Here:
+$909
State:
+$23,581
Profit/loss from business: +$3,765 (reported on 11.5% of returns)
Here:
+$3,765
State:
+$13,809
Total itemized deductions: $12,423 (22% of AGI, reported on 17.6% of returns)
Here:
$12,423
State:
$25,864
Here:
21.7% of AGI
State:
21.9% of AGI
Charity contributions deductions: $909 (1% of AGI, reported on 14.9% of returns)
Here:
$909
State:
$4,439
Here:
1.5% of AGI
State:
3.6% of AGI
Total tax: $3,879 (reported on 66.9% of returns)
12071:
$3,879
State:
$11,730
Earned income credit: $1,696 (reported on 15.5% of returns)
Here:
$1,696
State:
$1,757
Percentage of individuals using paid preparers for their 2004 taxes: 67.6%
Here:
68%
State:
67%
(% for various income ranges: 43.8% for AGIs below $10k, 72.5% for AGIs $10k-25k, 71.7% for AGIs $25k-50k, 80.0% for AGIs $50k-75k)
Size of family households: 45 2-persons, 18 3-persons, 4 4-persons, 5 6-persons
Size of nonfamily households: 23 1-person, 3 2-persons
39 married couples with children.
3 single-parent households (3 men).
95.5% of residents of 12071 zip code speak English at home.
3.0% of residents speak other Indo-European language at home (100% very well).
Foreign born population: 15 (7.1%) (100.0% of them are naturalized citizens)
This zip code:
7.1%
Whole state:
22.7%
64%North Macedonia (Macedonia)
14%France
21%Scandinavian
18%European
13%German
9%Eastern European
8%Polish
7%Scotch-Irish
6%American
Year of entry for the foreign-born population
02010 or later
02000 to 2009
01990 to 1999
14Before 1990
Housing units lacking complete plumbing facilities: 7.8% Housing units lacking complete kitchen facilities: 15.0%
54.2%Fuel oil, kerosene, etc.
17.4%Electricity
15.3%Wood
14.3%Bottled, tank, or LP gas
Population in 1990: 379.
Place of birth for U.S.-born residents:
This state: 163
Northeast: 10
Midwest: 6
West: 19
69% of the 12071 zip code residents lived in the same house 5 years ago. Out of people who lived in different houses, 75% lived in this county. Out of people who lived in different counties, 50% lived in New York.
95% of the 12071 zip code residents lived in the same house 1 year ago. Out of people who lived in different houses, 100% moved from different county within same state.
Private vs. public school enrollment:
Students in private schools in grades 1 to 8 (elementary and middle school):
Here:
0.0%
New York:
15.6%
Students in private schools in grades 9 to 12 (high school):
Here:
0.0%
New York:
15.0%
Occupation by median earnings in the past 12 months ($)
72,096Construction and extraction occupations
58,121Production occupations
Top industries in this zip code by the number of employees in 2005:
Construction: Site Preparation Contractors (1-4 employees: 1 establishment)
Home Mortgage Disclosure Act Aggregated Statistics For Year 2009 (Based on 2 partial tracts)
A) FHA, FSA/RHS & VA Home Purchase Loans
B) Conventional Home Purchase Loans
C) Refinancings
D) Home Improvement Loans
F) Non-occupant Loans on < 5 Family Dwellings (A B C & D)
G) Loans On Manufactured Home Dwelling (A B C & D)
Number
Average Value
Number
Average Value
Number
Average Value
Number
Average Value
Number
Average Value
Number
Average Value
LOANS ORIGINATED
1
$150,730
1
$182,910
6
$129,243
1
$112,110
1
$140,720
0
$0
APPLICATIONS APPROVED, NOT ACCEPTED
0
$0
0
$0
1
$143,760
0
$0
0
$0
0
$0
APPLICATIONS DENIED
0
$0
1
$169,140
4
$124,222
1
$21,460
0
$0
1
$115,330
APPLICATIONS WITHDRAWN
1
$99,060
1
$68,840
1
$167,890
0
$0
0
$0
0
$0
FILES CLOSED FOR INCOMPLETENESS
0
$0
0
$0
0
$0
0
$0
0
$0
0
$0
Aggregated Statistics For Year 2008 (Based on 2 partial tracts)
A) FHA, FSA/RHS & VA Home Purchase Loans
B) Conventional Home Purchase Loans
C) Refinancings
D) Home Improvement Loans
F) Non-occupant Loans on < 5 Family Dwellings (A B C & D)
G) Loans On Manufactured Home Dwelling (A B C & D)
Number
Average Value
Number
Average Value
Number
Average Value
Number
Average Value
Number
Average Value
Number
Average Value
LOANS ORIGINATED
1
$102,270
2
$138,210
6
$106,327
2
$70,270
1
$119,800
1
$45,060
APPLICATIONS APPROVED, NOT ACCEPTED
0
$0
1
$132,130
1
$77,960
0
$0
1
$75,450
1
$82,250
APPLICATIONS DENIED
0
$0
1
$138,210
7
$103,397
4
$71,878
1
$66,690
1
$100,130
APPLICATIONS WITHDRAWN
0
$0
0
$0
2
$93,065
1
$153,410
0
$0
0
$0
FILES CLOSED FOR INCOMPLETENESS
0
$0
0
$0
1
$185,950
0
$0
0
$0
0
$0
Aggregated Statistics For Year 2007 (Based on 2 partial tracts)
A) FHA, FSA/RHS & VA Home Purchase Loans
B) Conventional Home Purchase Loans
C) Refinancings
D) Home Improvement Loans
F) Non-occupant Loans on < 5 Family Dwellings (A B C & D)
G) Loans On Manufactured Home Dwelling (A B C & D)
Number
Average Value
Number
Average Value
Number
Average Value
Number
Average Value
Number
Average Value
Number
Average Value
LOANS ORIGINATED
1
$63,470
6
$129,988
8
$105,805
3
$61,863
3
$142,743
1
$74,380
APPLICATIONS APPROVED, NOT ACCEPTED
0
$0
1
$111,930
2
$91,815
1
$64,730
0
$0
1
$33,260
APPLICATIONS DENIED
0
$0
3
$108,053
6
$117,233
5
$106,958
2
$111,750
1
$77,060
APPLICATIONS WITHDRAWN
0
$0
1
$64,900
4
$128,378
1
$47,380
0
$0
0
$0
FILES CLOSED FOR INCOMPLETENESS
0
$0
0
$0
1
$209,020
0
$0
0
$0
0
$0
Aggregated Statistics For Year 2006 (Based on 2 partial tracts)
A) FHA, FSA/RHS & VA Home Purchase Loans
B) Conventional Home Purchase Loans
C) Refinancings
D) Home Improvement Loans
F) Non-occupant Loans on < 5 Family Dwellings (A B C & D)
G) Loans On Manufactured Home Dwelling (A B C & D)
Number
Average Value
Number
Average Value
Number
Average Value
Number
Average Value
Number
Average Value
Number
Average Value
LOANS ORIGINATED
1
$49,350
5
$132,098
9
$117,710
3
$39,217
3
$162,827
1
$96,190
APPLICATIONS APPROVED, NOT ACCEPTED
0
$0
1
$161,460
2
$133,655
1
$17,700
1
$187,560
1
$19,490
APPLICATIONS DENIED
0
$0
3
$86,123
8
$115,706
3
$50,003
1
$157,700
3
$62,580
APPLICATIONS WITHDRAWN
0
$0
1
$73,670
6
$115,267
1
$66,330
1
$57,570
0
$0
FILES CLOSED FOR INCOMPLETENESS
0
$0
0
$0
2
$117,740
0
$0
0
$0
0
$0
Aggregated Statistics For Year 2005 (Based on 2 partial tracts)
A) FHA, FSA/RHS & VA Home Purchase Loans
B) Conventional Home Purchase Loans
C) Refinancings
D) Home Improvement Loans
F) Non-occupant Loans on < 5 Family Dwellings (A B C & D)
G) Loans On Manufactured Home Dwelling (A B C & D)
Number
Average Value
Number
Average Value
Number
Average Value
Number
Average Value
Number
Average Value
Number
Average Value
LOANS ORIGINATED
1
$60,430
7
$98,136
11
$104,988
3
$41,660
3
$123,430
2
$57,840
APPLICATIONS APPROVED, NOT ACCEPTED
0
$0
2
$84,485
3
$81,057
1
$12,690
1
$21,630
1
$53,460
APPLICATIONS DENIED
0
$0
5
$96,266
11
$83,938
2
$36,745
1
$193,280
3
$51,553
APPLICATIONS WITHDRAWN
0
$0
1
$70,800
8
$100,731
1
$82,250
1
$129,630
1
$37,010
FILES CLOSED FOR INCOMPLETENESS
0
$0
1
$56,140
3
$136,723
0
$0
0
$0
0
$0
Aggregated Statistics For Year 2004 (Based on 2 partial tracts)
A) FHA, FSA/RHS & VA Home Purchase Loans
B) Conventional Home Purchase Loans
C) Refinancings
D) Home Improvement Loans
F) Non-occupant Loans on < 5 Family Dwellings (A B C & D)
G) Loans On Manufactured Home Dwelling (A B C & D)
Number
Average Value
Number
Average Value
Number
Average Value
Number
Average Value
Number
Average Value
Number
Average Value
LOANS ORIGINATED
1
$84,390
6
$98,518
10
$79,119
2
$22,440
3
$108,650
1
$44,340
APPLICATIONS APPROVED, NOT ACCEPTED
0
$0
1
$45,590
3
$79,743
0
$0
0
$0
0
$0
APPLICATIONS DENIED
0
$0
2
$53,820
7
$87,714
3
$33,733
1
$75,810
1
$54,360
APPLICATIONS WITHDRAWN
0
$0
1
$70,800
5
$89,578
1
$23,070
0
$0
0
$0
FILES CLOSED FOR INCOMPLETENESS
0
$0
0
$0
1
$158,950
0
$0
0
$0
0
$0
Aggregated Statistics For Year 2003 (Based on 2 partial tracts)
B) Conventional Home Purchase Loans
C) Refinancings
D) Home Improvement Loans
F) Non-occupant Loans on < 5 Family Dwellings (A B C & D)
Number
Average Value
Number
Average Value
Number
Average Value
Number
Average Value
LOANS ORIGINATED
5
$83,892
14
$86,833
2
$22,710
2
$85,020
APPLICATIONS APPROVED, NOT ACCEPTED
1
$73,310
2
$69,375
0
$0
1
$40,230
APPLICATIONS DENIED
1
$139,110
7
$98,749
1
$23,600
1
$190,600
APPLICATIONS WITHDRAWN
0
$0
4
$74,248
0
$0
0
$0
FILES CLOSED FOR INCOMPLETENESS
0
$0
1
$49,530
0
$0
0
$0
Aggregated Statistics For Year 2002 (Based on 2 partial tracts)
A) FHA, FSA/RHS & VA Home Purchase Loans
B) Conventional Home Purchase Loans
C) Refinancings
D) Home Improvement Loans
F) Non-occupant Loans on < 5 Family Dwellings (A B C & D)
Number
Average Value
Number
Average Value
Number
Average Value
Number
Average Value
Number
Average Value
LOANS ORIGINATED
1
$91,190
6
$72,175
10
$84,161
2
$20,295
3
$85,407
APPLICATIONS APPROVED, NOT ACCEPTED
0
$0
1
$61,330
2
$100,215
0
$0
0
$0
APPLICATIONS DENIED
0
$0
2
$60,615
5
$93,512
3
$40,350
1
$39,690
APPLICATIONS WITHDRAWN
0
$0
1
$61,860
3
$81,413
1
$12,690
0
$0
FILES CLOSED FOR INCOMPLETENESS
0
$0
0
$0
1
$105,670
0
$0
0
$0
Aggregated Statistics For Year 2001 (Based on 2 partial tracts)
A) FHA, FSA/RHS & VA Home Purchase Loans
B) Conventional Home Purchase Loans
C) Refinancings
D) Home Improvement Loans
F) Non-occupant Loans on < 5 Family Dwellings (A B C & D)
Number
Average Value
Number
Average Value
Number
Average Value
Number
Average Value
Number
Average Value
LOANS ORIGINATED
1
$48,280
4
$71,162
8
$71,475
2
$12,425
1
$98,520
APPLICATIONS APPROVED, NOT ACCEPTED
0
$0
1
$65,440
3
$62,760
0
$0
0
$0
APPLICATIONS DENIED
0
$0
1
$33,610
6
$61,627
1
$10,010
0
$0
APPLICATIONS WITHDRAWN
0
$0
0
$0
3
$62,877
0
$0
0
$0
FILES CLOSED FOR INCOMPLETENESS
0
$0
0
$0
0
$0
0
$0
0
$0
Aggregated Statistics For Year 2000 (Based on 2 partial tracts)
A) FHA, FSA/RHS & VA Home Purchase Loans
B) Conventional Home Purchase Loans
C) Refinancings
D) Home Improvement Loans
F) Non-occupant Loans on < 5 Family Dwellings (A B C & D)
Number
Average Value
Number
Average Value
Number
Average Value
Number
Average Value
Number
Average Value
LOANS ORIGINATED
1
$96,550
5
$70,912
4
$54,220
2
$11,535
1
$41,120
APPLICATIONS APPROVED, NOT ACCEPTED
0
$0
2
$47,560
1
$63,650
0
$0
0
$0
APPLICATIONS DENIED
0
$0
4
$42,778
4
$50,510
1
$22,170
1
$26,640
APPLICATIONS WITHDRAWN
0
$0
0
$0
3
$45,713
0
$0
0
$0
FILES CLOSED FOR INCOMPLETENESS
0
$0
0
$0
1
$52,570
0
$0
0
$0
Aggregated Statistics For Year 1999 (Based on 1 partial tract)
A) FHA, FSA/RHS & VA Home Purchase Loans
B) Conventional Home Purchase Loans
C) Refinancings
D) Home Improvement Loans
F) Non-occupant Loans on < 5 Family Dwellings (A B C & D)


 Nearest zip codes: 12194, 12187, 12122, 12131, 12175, 12076.


