Estimated zip code population in 2022: 281 Zip code population in 2010: 403 Zip code population in 2000: 364
Houses and condos: 207 Renter-occupied apartments: 26
% of renters here:
24%
State:
46%
March 2022 cost of living index in zip code 12819: 95.1 (less than average, U.S. average is 100)
Land area: 29.0 sq. mi. Water area: 0.5 sq. mi.
Population density: 10 people per square mile
(very low).
OSM Map
General Map
Google Map
MSN Map
OSM Map
General Map
Google Map
MSN Map
OSM Map
General Map
Google Map
MSN Map
OSM Map
General Map
Google Map
MSN Map
Please wait while loading the map...
Real estate property taxes paid for housing units in 2022:
This zip code:
1.7% ($2,602)
New York:
1.5% ($6,180)
Median real estate property taxes paid for housing units with mortgages in 2022: $3,070 (2.1%) Median real estate property taxes paid for housing units with no mortgage in 2022: $2,394 (1.5%)
Business Search- 14 Million verified businesses
Males: 134
(47.9%)
Females: 146
(52.1%)
For population 25 years and over in 12819:
High school or higher: 91.1%
Bachelor's degree or higher: 10.4%
Graduate or professional degree: 8.8%
Unemployed: 9.7%
Mean travel time to work (commute): 29.4 minutes
For population 15 years and over in 12819:
Never married: 31.2%
Now married: 52.4%
Separated: 4.5%
Widowed: 2.9%
Divorced: 9.0%
Zip code 12819 compared to state average:
Median house value significantly below state average.
Unemployed percentage above state average.
Black race population percentage significantly below state average.
Hispanic race population percentage significantly below state average.
Median age above state average.
Foreign-born population percentage significantly below state average.
Renting percentage below state average.
Length of stay since moving in significantly above state average.
Percentage of population with a bachelor's degree or higher significantly below state average.
Averages for the 2020 tax year for zip code 12819, filed in 2021:
Average Adjusted Gross Income (AGI) in 2020: $47,827 (Individual Income Tax Returns)
Here:
$47,827
State:
$90,930
Salary/wage: $48,000 (reported on 80.0% of returns)
Here:
$48,000
State:
$72,104
(% of AGI for various income ranges: 1210.0% for AGIs below $25k, 3685.0% for AGIs $25k-50k, 9807.5% for AGIs $50k-75k)
Taxable interest for individuals: $33 (reported on 20.0% of returns)
This zip code:
$33
New York:
$3,075
(% of AGI for various income ranges: 2.5% for AGIs $25k-50k)
Profit/loss from business: +$2,350 (reported on 13.3% of returns)
Here:
+$2,350
State:
+$14,940
(% of AGI for various income ranges: 156.7% for AGIs below $25k)
Earned income credit: $1,400 (reported on 13.3% of returns)
Here:
$1,400
State:
$2,138
(% of AGI for various income ranges: 93.3% for AGIs below $25k)
Percentage of individuals using paid preparers for their 2020 taxes: 93.3%
Here:
93%
State:
95%
(% for various income ranges: 80.0% for AGIs below $25k, 100.0% for AGIs $25k-50k, 100.0% for AGIs $50k-75k, 100.0% for AGIs $100k-200k)
Averages for the 2012 tax year for zip code 12819, filed in 2013:
Average Adjusted Gross Income (AGI) in 2012: $42,292 (Individual Income Tax Returns)
Here:
$42,292
State:
$77,088
Salary/wage: $36,075 (reported on 92.3% of returns)
Here:
$36,075
State:
$60,593
(% of AGI for various income ranges: 73.3% for AGIs below $25k, 82.6% for AGIs $25k-50k, 76.5% for AGIs $75k-100k)
Taxable interest for individuals: $133 (reported on 23.1% of returns)
This zip code:
$133
New York:
$3,125
Earned income credit: $1,700 (reported on 30.8% of returns)
Here:
$1,700
State:
$2,230
(% of AGI for various income ranges: 10.0% for AGIs below $25k)
Percentage of individuals using paid preparers for their 2012 taxes: 61.5%
Here:
62%
State:
66%
Averages for the 2004 tax year for zip code 12819, filed in 2005:
Average Adjusted Gross Income (AGI) in 2004: $32,551 (Individual Income Tax Returns)
Here:
$32,551
State:
$59,519
Salary/wage: $32,322 (reported on 86.8% of returns)
Here:
$32,322
State:
$50,673
(% of AGI for various income ranges: 76.2% for AGIs below $10k, 80.0% for AGIs $10k-25k, 82.4% for AGIs $25k-50k, 98.7% for AGIs $50k-75k, 82.5% for AGIs $75k-100k)
Taxable interest for individuals: $292 (reported on 35.3% of returns)
This zip code:
$292
New York:
$2,377
Taxable dividends: $42 (reported on 17.6% of returns)
Here:
$42
State:
$5,394
Profit/loss from business: +$1,062 (reported on 11.8% of returns)
Here:
+$1,062
State:
+$13,809
Total itemized deductions: $16,556 (21% of AGI, reported on 13.2% of returns)
Here:
$16,556
State:
$25,864
Here:
21.4% of AGI
State:
21.9% of AGI
Charity contributions deductions: $1,231 (2% of AGI, reported on 9.6% of returns)
Here:
$1,231
State:
$4,439
Here:
1.7% of AGI
State:
3.6% of AGI
Total tax: $3,723 (reported on 69.1% of returns)
12819:
$3,723
State:
$11,730
(% of AGI for various income ranges: 4.3% for AGIs $10k-25k, 5.9% for AGIs $25k-50k, 7.1% for AGIs $50k-75k, 13.3% for AGIs $75k-100k)
Earned income credit: $1,440 (reported on 18.4% of returns)
Here:
$1,440
State:
$1,757
Percentage of individuals using paid preparers for their 2004 taxes: 63.2%
Here:
63%
State:
67%
(% for various income ranges: 57.6% for AGIs below $10k, 69.4% for AGIs $10k-25k, 58.3% for AGIs $25k-50k, 110.5% for AGIs $50k-75k)
Size of family households: 50 2-persons, 12 3-persons, 4 4-persons, 5 5-persons, 7 6-persons
Size of nonfamily households: 31 1-person
31 married couples with children.
5 single-parent households (5 men).
All residents speak English at home
Foreign born population: 2 (0.7%) (100.0% of them are naturalized citizens)
This zip code:
0.7%
Whole state:
22.7%
100%Ecuador
37%American
22%Irish
12%German
11%English
5%European
1%Italian
Housing units lacking complete plumbing facilities: 9.4% Housing units lacking complete kitchen facilities: 8.1%
43.8%Fuel oil, kerosene, etc.
31.0%Bottled, tank, or LP gas
11.0%Wood
6.4%Electricity
5.5%Other fuel
2.7%Coal or coke
0.9%Utility gas
Population in 1990: 169. Population change in the 1990s: +195 (+115.4%).
Place of birth for U.S.-born residents:
This state: 236
Northeast: 25
South: 15
69% of the 12819 zip code residents lived in the same house 5 years ago. Out of people who lived in different houses, 78% lived in this county. Out of people who lived in different counties, 50% lived in New York.
97% of the 12819 zip code residents lived in the same house 1 year ago. Out of people who lived in different houses, 67% moved from this county.
Private vs. public school enrollment:
Students in private schools in grades 1 to 8 (elementary and middle school):
Here:
0.0%
New York:
15.6%
Students in private schools in grades 9 to 12 (high school):
Here:
0.0%
New York:
15.0%
Students in private undergraduate colleges:
Here:
0.0%
New York:
39.2%
Occupation by median earnings in the past 12 months ($)
71,154Education, training, and library occupations
64,509Management occupations
47,393Health technologists and technicians
44,859Installation, maintenance, and repair occupations
28,455Production occupations
20,414Office and administrative support occupations
People in group quarters in 2010:
2 people in nursing facilities/skilled-nursing facilities
Home Mortgage Disclosure Act Aggregated Statistics For Year 2009 (Based on 2 partial tracts)
A) FHA, FSA/RHS & VA Home Purchase Loans
B) Conventional Home Purchase Loans
C) Refinancings
D) Home Improvement Loans
F) Non-occupant Loans on < 5 Family Dwellings (A B C & D)
G) Loans On Manufactured Home Dwelling (A B C & D)
Number
Average Value
Number
Average Value
Number
Average Value
Number
Average Value
Number
Average Value
Number
Average Value
LOANS ORIGINATED
11
$96,019
9
$222,847
23
$118,273
4
$38,188
10
$211,286
1
$61,280
APPLICATIONS APPROVED, NOT ACCEPTED
0
$0
1
$355,070
5
$123,824
2
$51,820
1
$493,410
0
$0
APPLICATIONS DENIED
2
$66,690
2
$263,150
27
$106,475
9
$35,748
5
$191,686
1
$82,460
APPLICATIONS WITHDRAWN
0
$0
1
$63,990
13
$122,494
1
$61,730
0
$0
0
$0
FILES CLOSED FOR INCOMPLETENESS
0
$0
0
$0
5
$89,128
0
$0
1
$61,730
0
$0
Aggregated Statistics For Year 2008 (Based on 2 partial tracts)
A) FHA, FSA/RHS & VA Home Purchase Loans
B) Conventional Home Purchase Loans
C) Refinancings
D) Home Improvement Loans
F) Non-occupant Loans on < 5 Family Dwellings (A B C & D)
G) Loans On Manufactured Home Dwelling (A B C & D)
Number
Average Value
Number
Average Value
Number
Average Value
Number
Average Value
Number
Average Value
Number
Average Value
LOANS ORIGINATED
9
$104,790
16
$119,916
27
$97,780
9
$39,402
7
$183,330
2
$62,635
APPLICATIONS APPROVED, NOT ACCEPTED
0
$0
2
$83,585
6
$120,310
2
$27,935
2
$117,380
0
$0
APPLICATIONS DENIED
2
$72,995
9
$132,677
42
$96,117
18
$28,037
4
$120,985
3
$68,340
APPLICATIONS WITHDRAWN
0
$0
2
$141,940
15
$126,018
3
$94,927
1
$182,940
2
$77,955
FILES CLOSED FOR INCOMPLETENESS
0
$0
2
$175,960
6
$84,037
0
$0
1
$209,530
0
$0
Aggregated Statistics For Year 2007 (Based on 2 partial tracts)
A) FHA, FSA/RHS & VA Home Purchase Loans
B) Conventional Home Purchase Loans
C) Refinancings
D) Home Improvement Loans
F) Non-occupant Loans on < 5 Family Dwellings (A B C & D)
G) Loans On Manufactured Home Dwelling (A B C & D)
Number
Average Value
Number
Average Value
Number
Average Value
Number
Average Value
Number
Average Value
Number
Average Value
LOANS ORIGINATED
5
$69,392
23
$133,299
46
$103,834
21
$49,910
12
$184,858
4
$63,760
APPLICATIONS APPROVED, NOT ACCEPTED
0
$0
4
$110,398
11
$132,927
3
$44,310
2
$96,655
1
$86,970
APPLICATIONS DENIED
1
$125,720
13
$90,120
55
$103,196
39
$26,158
10
$112,920
8
$58,015
APPLICATIONS WITHDRAWN
1
$79,310
2
$76,375
30
$99,943
6
$83,437
3
$58,427
1
$62,180
FILES CLOSED FOR INCOMPLETENESS
1
$49,120
3
$67,290
6
$116,180
2
$59,480
1
$66,240
0
$0
Aggregated Statistics For Year 2006 (Based on 2 partial tracts)
A) FHA, FSA/RHS & VA Home Purchase Loans
B) Conventional Home Purchase Loans
C) Refinancings
D) Home Improvement Loans
F) Non-occupant Loans on < 5 Family Dwellings (A B C & D)
G) Loans On Manufactured Home Dwelling (A B C & D)
Number
Average Value
Number
Average Value
Number
Average Value
Number
Average Value
Number
Average Value
Number
Average Value
LOANS ORIGINATED
3
$94,927
32
$116,438
58
$106,629
25
$34,480
15
$228,154
4
$74,350
APPLICATIONS APPROVED, NOT ACCEPTED
0
$0
4
$152,978
11
$110,765
2
$33,570
3
$189,103
0
$0
APPLICATIONS DENIED
1
$119,860
10
$100,213
71
$126,631
32
$37,428
14
$201,257
6
$71,870
APPLICATIONS WITHDRAWN
0
$0
7
$104,217
27
$94,526
5
$64,166
2
$126,845
1
$137,430
FILES CLOSED FOR INCOMPLETENESS
0
$0
0
$0
9
$107,543
0
$0
0
$0
2
$59,930
Aggregated Statistics For Year 2005 (Based on 2 partial tracts)
A) FHA, FSA/RHS & VA Home Purchase Loans
B) Conventional Home Purchase Loans
C) Refinancings
D) Home Improvement Loans
F) Non-occupant Loans on < 5 Family Dwellings (A B C & D)
G) Loans On Manufactured Home Dwelling (A B C & D)
Number
Average Value
Number
Average Value
Number
Average Value
Number
Average Value
Number
Average Value
Number
Average Value
LOANS ORIGINATED
2
$100,710
28
$109,898
46
$103,246
19
$36,285
16
$151,514
2
$73,450
APPLICATIONS APPROVED, NOT ACCEPTED
0
$0
5
$86,606
18
$97,154
2
$46,860
3
$124,067
1
$64,440
APPLICATIONS DENIED
1
$97,330
11
$110,356
70
$104,938
29
$42,698
13
$186,756
7
$55,810
APPLICATIONS WITHDRAWN
2
$66,015
5
$102,016
43
$118,288
4
$187,338
2
$155,230
1
$127,070
FILES CLOSED FOR INCOMPLETENESS
0
$0
5
$68,402
8
$99,526
1
$32,890
0
$0
0
$0
Aggregated Statistics For Year 2004 (Based on 2 partial tracts)
A) FHA, FSA/RHS & VA Home Purchase Loans
B) Conventional Home Purchase Loans
C) Refinancings
D) Home Improvement Loans
F) Non-occupant Loans on < 5 Family Dwellings (A B C & D)
G) Loans On Manufactured Home Dwelling (A B C & D)
Number
Average Value
Number
Average Value
Number
Average Value
Number
Average Value
Number
Average Value
Number
Average Value
LOANS ORIGINATED
3
$89,520
31
$119,365
47
$75,538
9
$46,211
16
$161,118
5
$47,944
APPLICATIONS APPROVED, NOT ACCEPTED
0
$0
6
$75,700
15
$75,701
2
$19,375
3
$61,883
1
$74,350
APPLICATIONS DENIED
2
$59,030
9
$53,421
50
$73,457
18
$28,713
6
$132,552
5
$36,138
APPLICATIONS WITHDRAWN
0
$0
6
$191,355
27
$80,941
2
$75,025
3
$390,220
1
$94,630
FILES CLOSED FOR INCOMPLETENESS
0
$0
1
$114,900
6
$88,843
1
$32,440
1
$51,370
0
$0
Aggregated Statistics For Year 2003 (Based on 2 partial tracts)
A) FHA, FSA/RHS & VA Home Purchase Loans
B) Conventional Home Purchase Loans
C) Refinancings
D) Home Improvement Loans
E) Loans on Dwellings For 5+ Families
F) Non-occupant Loans on < 5 Family Dwellings (A B C & D)
Number
Average Value
Number
Average Value
Number
Average Value
Number
Average Value
Number
Average Value
Number
Average Value
LOANS ORIGINATED
3
$55,573
23
$71,900
61
$79,114
3
$20,427
0
$0
13
$130,639
APPLICATIONS APPROVED, NOT ACCEPTED
0
$0
7
$86,773
22
$85,696
1
$10,360
0
$0
2
$150,500
APPLICATIONS DENIED
1
$75,700
11
$58,415
55
$85,958
9
$13,118
0
$0
6
$180,917
APPLICATIONS WITHDRAWN
1
$45,960
3
$53,770
16
$85,783
2
$15,545
1
$78,860
1
$119,410
FILES CLOSED FOR INCOMPLETENESS
0
$0
2
$97,330
5
$74,258
3
$24,783
0
$0
1
$78,400
Aggregated Statistics For Year 2002 (Based on 2 partial tracts)
A) FHA, FSA/RHS & VA Home Purchase Loans
B) Conventional Home Purchase Loans
C) Refinancings
D) Home Improvement Loans
F) Non-occupant Loans on < 5 Family Dwellings (A B C & D)
Number
Average Value
Number
Average Value
Number
Average Value
Number
Average Value
Number
Average Value
LOANS ORIGINATED
3
$62,483
10
$79,531
30
$65,217
5
$11,084
6
$106,567
APPLICATIONS APPROVED, NOT ACCEPTED
0
$0
3
$47,313
14
$50,081
0
$0
0
$0
APPLICATIONS DENIED
0
$0
7
$56,840
34
$58,499
8
$20,784
4
$37,512
APPLICATIONS WITHDRAWN
0
$0
1
$108,590
21
$62,483
2
$7,210
1
$33,340
FILES CLOSED FOR INCOMPLETENESS
0
$0
0
$0
4
$80,320
0
$0
0
$0
Aggregated Statistics For Year 2001 (Based on 2 partial tracts)
A) FHA, FSA/RHS & VA Home Purchase Loans
B) Conventional Home Purchase Loans
C) Refinancings
D) Home Improvement Loans
F) Non-occupant Loans on < 5 Family Dwellings (A B C & D)
Number
Average Value
Number
Average Value
Number
Average Value
Number
Average Value
Number
Average Value
LOANS ORIGINATED
4
$55,762
9
$65,938
29
$54,134
5
$12,526
4
$35,372
APPLICATIONS APPROVED, NOT ACCEPTED
1
$54,070
0
$0
8
$52,608
0
$0
0
$0
APPLICATIONS DENIED
1
$43,710
4
$42,808
36
$56,826
5
$28,208
1
$62,180
APPLICATIONS WITHDRAWN
0
$0
3
$42,807
13
$66,932
2
$23,880
1
$55,420
FILES CLOSED FOR INCOMPLETENESS
0
$0
0
$0
2
$50,695
0
$0
0
$0
Aggregated Statistics For Year 2000 (Based on 2 partial tracts)
A) FHA, FSA/RHS & VA Home Purchase Loans
B) Conventional Home Purchase Loans
C) Refinancings
D) Home Improvement Loans
F) Non-occupant Loans on < 5 Family Dwellings (A B C & D)
Number
Average Value
Number
Average Value
Number
Average Value
Number
Average Value
Number
Average Value
LOANS ORIGINATED
5
$41,636
9
$49,216
15
$52,089
4
$10,590
4
$63,985
APPLICATIONS APPROVED, NOT ACCEPTED
0
$0
5
$45,780
6
$51,218
1
$12,170
3
$46,863
APPLICATIONS DENIED
0
$0
8
$54,354
23
$43,179
3
$18,323
5
$49,566
APPLICATIONS WITHDRAWN
1
$79,310
2
$24,560
10
$39,427
1
$47,310
0
$0
FILES CLOSED FOR INCOMPLETENESS
0
$0
0
$0
2
$45,735
0
$0
0
$0
Aggregated Statistics For Year 1999 (Based on 1 partial tract)
A) FHA, FSA/RHS & VA Home Purchase Loans
B) Conventional Home Purchase Loans
C) Refinancings
D) Home Improvement Loans
F) Non-occupant Loans on < 5 Family Dwellings (A B C & D)

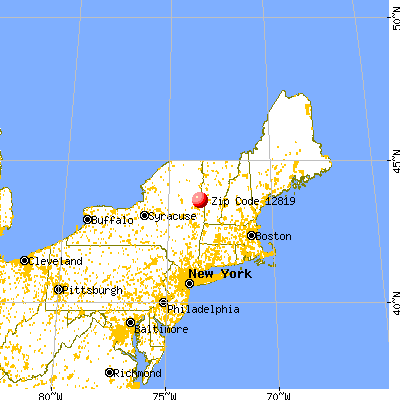


 Nearest zip codes: 12841, 12887, 12874, 12827, 12821, 12861.


