Estimated zip code population in 2022: 3,614 Zip code population in 2010: 3,877 Zip code population in 2000: 3,815
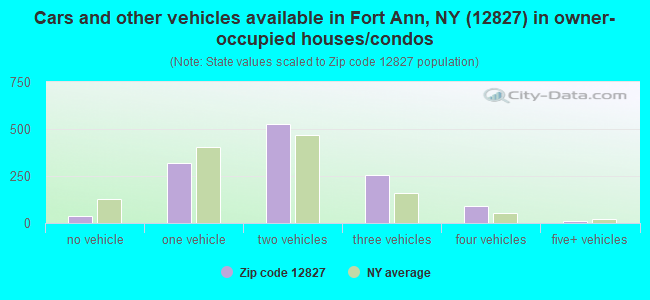
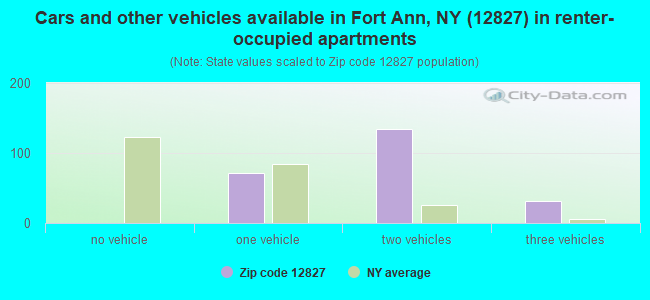
Houses and condos: 1,721 Renter-occupied apartments: 242
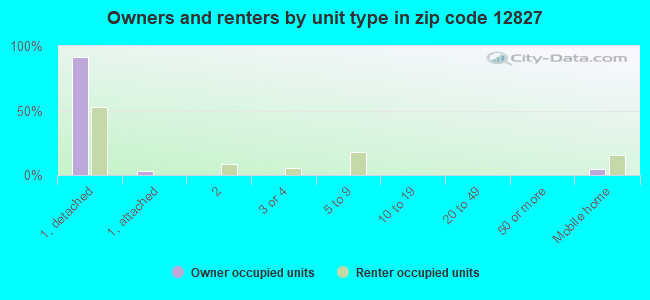
% of renters here:
16%
State:
46%
March 2022 cost of living index in zip code 12827: 94.7 (less than average, U.S. average is 100)
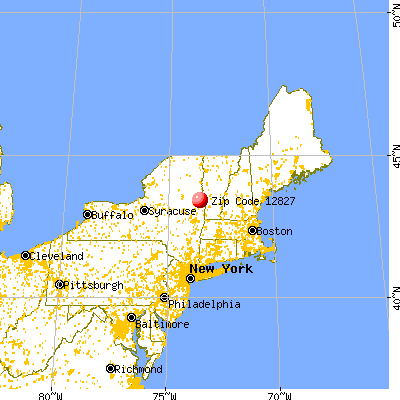
Land area: 123.3 sq. mi. Water area: 1.6 sq. mi.
Population density: 29 people per square mile
(very low).
OSM Map
General Map
Google Map
MSN Map
OSM Map
General Map
Google Map
MSN Map
OSM Map
General Map
Google Map
MSN Map
OSM Map
General Map
Google Map
MSN Map
Please wait while loading the map...
Real estate property taxes paid for housing units in 2022:
This zip code:
1.4% ($2,873)
New York:
1.5% ($6,180)
Median real estate property taxes paid for housing units with mortgages in 2022: $2,850 (1.5%) Median real estate property taxes paid for housing units with no mortgage in 2022: $2,926 (1.4%)
Averages for the 2020 tax year for zip code 12827, filed in 2021:
Average Adjusted Gross Income (AGI) in 2020: $55,794 (Individual Income Tax Returns)
Here:
$55,794
State:
$90,930
Salary/wage: $50,039 (reported on 79.9% of returns)
Here:
$50,039
State:
$72,104
(% of AGI for various income ranges: 1081.0% for AGIs below $25k, 3599.2% for AGIs $25k-50k, 6106.4% for AGIs $50k-75k, 8832.5% for AGIs $75k-100k, 14068.2% for AGIs $100k-200k)
Taxable interest for individuals: $605 (reported on 33.0% of returns)
This zip code:
$605
New York:
$3,075
(% of AGI for various income ranges: 16.8% for AGIs below $25k, 11.0% for AGIs $25k-50k, 27.6% for AGIs $50k-75k, 21.2% for AGIs $75k-100k, 85.3% for AGIs $100k-200k)
Ordinary dividends: $3,039 (reported on 16.0% of returns)
Here:
$3,039
State:
$11,095
(% of AGI for various income ranges: 14.6% for AGIs below $25k, 16.4% for AGIs $25k-50k, 66.0% for AGIs $50k-75k, 85.6% for AGIs $75k-100k, 303.5% for AGIs $100k-200k)
Net capital gain/loss in AGI: +$7,846 (reported on 12.4% of returns)
Here:
+$7,846
State:
+$44,925
(% of AGI for various income ranges: 41.2% for AGIs below $25k, 25.6% for AGIs $25k-50k, 124.4% for AGIs $50k-75k, 64.4% for AGIs $75k-100k, 705.9% for AGIs $100k-200k)
Profit/loss from business: +$9,178 (reported on 13.9% of returns)
Here:
+$9,178
State:
+$14,940
(% of AGI for various income ranges: 104.6% for AGIs below $25k, 112.6% for AGIs $25k-50k, 124.0% for AGIs $50k-75k, 236.9% for AGIs $75k-100k, 541.8% for AGIs $100k-200k)
Taxable individual retirement arrangement distribution: $13,784 (reported on 9.8% of returns)
12827:
$13,784
New York:
$19,609
(% of AGI for various income ranges: 88.3% for AGIs below $25k, 82.1% for AGIs $25k-50k, 121.6% for AGIs $50k-75k, 245.0% for AGIs $75k-100k, 730.0% for AGIs $100k-200k)
Total itemized deductions: $20,267 (reported on 4.6% of returns)
Here:
$20,267
State:
$39,326
(% of AGI for various income ranges: 152.3% for AGIs $25k-50k, 337.5% for AGIs $75k-100k, 405.9% for AGIs $100k-200k)
Charity contributions: $3,017 (reported on 3.1% of returns)
Here:
$3,017
State:
$15,420
(% of AGI for various income ranges: 33.6% for AGIs $50k-75k, 57.1% for AGIs $100k-200k)
Taxes paid: $7,433 (reported on 4.6% of returns)
12827:
$7,433
State:
$9,183
(% of AGI for various income ranges: 51.0% for AGIs $25k-50k, 138.1% for AGIs $75k-100k, 146.5% for AGIs $100k-200k)
Earned income credit: $2,152 (reported on 13.9% of returns)
Here:
$2,152
State:
$2,138
(% of AGI for various income ranges: 87.8% for AGIs below $25k, 56.7% for AGIs $25k-50k)
Percentage of individuals using paid preparers for their 2020 taxes: 94.8%
Here:
95%
State:
95%
(% for various income ranges: 93.3% for AGIs below $25k, 96.0% for AGIs $25k-50k, 93.9% for AGIs $50k-75k, 95.5% for AGIs $75k-100k, 96.2% for AGIs $100k-200k, 100.0% for AGIs over 200k)
Averages for the 2012 tax year for zip code 12827, filed in 2013:
Average Adjusted Gross Income (AGI) in 2012: $45,848 (Individual Income Tax Returns)
Here:
$45,848
State:
$77,088
Salary/wage: $40,742 (reported on 84.5% of returns)
Here:
$40,742
State:
$60,593
(% of AGI for various income ranges: 78.2% for AGIs below $25k, 75.0% for AGIs $25k-50k, 77.4% for AGIs $50k-75k, 76.2% for AGIs $75k-100k, 71.3% for AGIs $100k-200k)
Taxable interest for individuals: $903 (reported on 32.6% of returns)
This zip code:
$903
New York:
$3,125
(% of AGI for various income ranges: 0.9% for AGIs below $25k, 0.8% for AGIs $25k-50k, 0.8% for AGIs $50k-75k, 0.3% for AGIs $75k-100k, 0.5% for AGIs $100k-200k)
Ordinary dividends: $2,771 (reported on 16.6% of returns)
Here:
$2,771
State:
$10,299
(% of AGI for various income ranges: 1.0% for AGIs below $25k, 1.3% for AGIs $25k-50k, 0.6% for AGIs $50k-75k, 0.7% for AGIs $75k-100k, 1.3% for AGIs $100k-200k)
Net capital gain/loss in AGI: +$4,052 (reported on 11.2% of returns)
Here:
+$4,052
State:
+$42,474
(% of AGI for various income ranges: 1.7% for AGIs $25k-50k, 0.3% for AGIs $50k-75k, 1.9% for AGIs $75k-100k, 0.9% for AGIs $100k-200k)
Profit/loss from business: +$6,396 (reported on 12.8% of returns)
Here:
+$6,396
State:
+$16,168
(% of AGI for various income ranges: 6.8% for AGIs below $25k, 3.0% for AGIs $25k-50k, 1.4% for AGIs $50k-75k, 0.4% for AGIs $75k-100k, 0.3% for AGIs $100k-200k)
Taxable individual retirement arrangement distribution: $10,187 (reported on 8.0% of returns)
12827:
$10,187
New York:
$17,621
(% of AGI for various income ranges: 2.6% for AGIs below $25k, 1.8% for AGIs $25k-50k, 1.4% for AGIs $50k-75k, 2.3% for AGIs $75k-100k, 1.4% for AGIs $100k-200k)
Total itemized deductions: $18,480 (24% of AGI, reported on 27.3% of returns)
Here:
$18,480
State:
$34,985
Here:
23.6% of AGI
State:
21.3% of AGI
(% of AGI for various income ranges: 7.3% for AGIs below $25k, 7.9% for AGIs $25k-50k, 10.7% for AGIs $50k-75k, 12.6% for AGIs $75k-100k, 13.8% for AGIs $100k-200k)
Charity contributions: $1,939 (reported on 19.3% of returns)
Here:
$1,939
State:
$5,572
(% of AGI for various income ranges: 0.4% for AGIs below $25k, 0.7% for AGIs $25k-50k, 1.0% for AGIs $50k-75k, 0.9% for AGIs $75k-100k, 0.9% for AGIs $100k-200k)
Taxes paid: $8,246 (reported on 26.7% of returns)
12827:
$8,246
State:
$18,656
(% of AGI for various income ranges: 2.6% for AGIs below $25k, 3.0% for AGIs $25k-50k, 4.4% for AGIs $50k-75k, 5.2% for AGIs $75k-100k, 7.0% for AGIs $100k-200k)
Earned income credit: $1,961 (reported on 16.6% of returns)
Here:
$1,961
State:
$2,230
(% of AGI for various income ranges: 5.2% for AGIs below $25k, 0.8% for AGIs $25k-50k)
Percentage of individuals using paid preparers for their 2012 taxes: 48.7%
Here:
49%
State:
66%
(% for various income ranges: 43.1% for AGIs below $25k, 47.9% for AGIs $25k-50k, 54.8% for AGIs $50k-75k, 52.6% for AGIs $75k-100k, 58.8% for AGIs $100k-200k)
Averages for the 2004 tax year for zip code 12827, filed in 2005:
Average Adjusted Gross Income (AGI) in 2004: $37,242 (Individual Income Tax Returns)
Here:
$37,242
State:
$59,519
Salary/wage: $33,917 (reported on 86.2% of returns)
Here:
$33,917
State:
$50,673
(% of AGI for various income ranges: 164.5% for AGIs below $10k, 76.4% for AGIs $10k-25k, 81.6% for AGIs $25k-50k, 83.0% for AGIs $50k-75k, 80.6% for AGIs $75k-100k, 59.6% for AGIs over 100k)
Taxable interest for individuals: $846 (reported on 45.4% of returns)
This zip code:
$846
New York:
$2,377
(% of AGI for various income ranges: 6.7% for AGIs below $10k, 1.9% for AGIs $10k-25k, 0.6% for AGIs $25k-50k, 0.5% for AGIs $50k-75k, 0.6% for AGIs $75k-100k, 1.8% for AGIs over 100k)
Taxable dividends: $1,424 (reported on 19.6% of returns)
Here:
$1,424
State:
$5,394
(% of AGI for various income ranges: 3.8% for AGIs below $10k, 0.5% for AGIs $10k-25k, 0.7% for AGIs $25k-50k, 0.4% for AGIs $50k-75k, 1.0% for AGIs $75k-100k, 1.0% for AGIs over 100k)
Net capital gain/loss: +$5,185 (reported on 14.0% of returns)
Here:
+$5,185
State:
+$23,581
(% of AGI for various income ranges: -1.4% for AGIs below $10k, 1.6% for AGIs $10k-25k, 0.9% for AGIs $25k-50k, 1.1% for AGIs $50k-75k, 3.3% for AGIs $75k-100k, 4.1% for AGIs over 100k)
Profit/loss from business: +$6,768 (reported on 13.8% of returns)
Here:
+$6,768
State:
+$13,809
(% of AGI for various income ranges: 0.5% for AGIs below $10k, 6.5% for AGIs $10k-25k, 2.7% for AGIs $25k-50k, 2.8% for AGIs $50k-75k, 1.7% for AGIs $75k-100k, -0.1% for AGIs over 100k)
IRA payment deduction: $2,855 (reported on 3.0% of returns)
12827:
$2,855
New York:
$3,115
(% of AGI for various income ranges: 0.3% for AGIs $10k-25k, 0.2% for AGIs $25k-50k, 0.2% for AGIs $50k-75k, 0.4% for AGIs $75k-100k)
Total itemized deductions: $14,890 (22% of AGI, reported on 27.9% of returns)
Here:
$14,890
State:
$25,864
Here:
22.2% of AGI
State:
21.9% of AGI
(% of AGI for various income ranges: 12.8% for AGIs below $10k, 7.1% for AGIs $10k-25k, 8.7% for AGIs $25k-50k, 13.2% for AGIs $50k-75k, 12.4% for AGIs $75k-100k, 13.4% for AGIs over 100k)
Charity contributions deductions: $1,727 (2% of AGI, reported on 24.6% of returns)
Here:
$1,727
State:
$4,439
Here:
2.5% of AGI
State:
3.6% of AGI
(% of AGI for various income ranges: 0.6% for AGIs $10k-25k, 0.7% for AGIs $25k-50k, 1.2% for AGIs $50k-75k, 1.3% for AGIs $75k-100k, 2.1% for AGIs over 100k)
Total tax: $4,620 (reported on 74.9% of returns)
12827:
$4,620
State:
$11,730
(% of AGI for various income ranges: 4.1% for AGIs below $10k, 4.7% for AGIs $10k-25k, 6.6% for AGIs $25k-50k, 8.6% for AGIs $50k-75k, 9.7% for AGIs $75k-100k, 17.5% for AGIs over 100k)
Earned income credit: $1,532 (reported on 16.2% of returns)
Here:
$1,532
State:
$1,757
Percentage of individuals using paid preparers for their 2004 taxes: 56.3%
Here:
56%
State:
67%
(% for various income ranges: 43.4% for AGIs below $10k, 55.0% for AGIs $10k-25k, 59.0% for AGIs $25k-50k, 62.4% for AGIs $50k-75k, 61.5% for AGIs $75k-100k, 75.6% for AGIs over 100k)
Household received Food Stamps/SNAP in the past 12 months: 102 Household did not receive Food Stamps/SNAP in the past 12 months: 1,376
Women who had a birth in the past 12 months: 75 (66 now married, 8 unmarried) Women who did not have a birth in the past 12 months: 660 (346 now married, 308 unmarried)
Housing units in zip code 12827 with a mortgage: 714 (64 second mortgage, 63 both second mortgage and home equity loan) Houses without a mortgage: 43
Median monthly owner costs for units with a mortgage: $1,337 Median monthly owner costs for units without a mortgage: $609
Residents with income below the poverty level in 2022:
This zip code:
4.6%
Whole state:
14.3%
Residents with income below 50% of the poverty level in 2022:
This zip code:
1.9%
Whole state:
6.8%
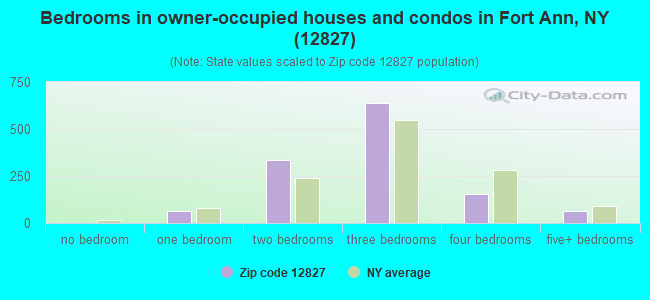
Median number of rooms in houses and condos:
Here:
5.7
State:
6.3
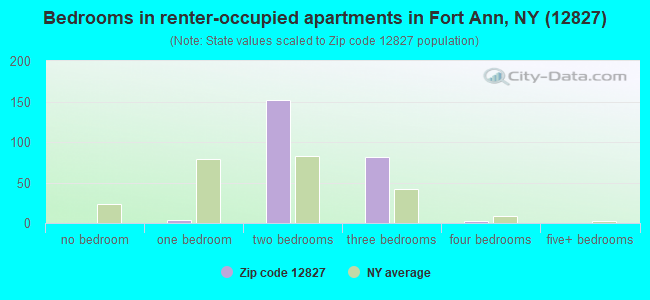
Median number of rooms in apartments:
Here:
4.8
State:
3.8
Notable locations in this zip code not listed on our city pages
Notable locations in zip code 12827: Shelving Rock (A), Smiths Basin (B), Green Thumb Nursery (C), Brookefield Farm (D), B and C Farms (E), Milton Farms (F), Goodmanor Farms (G), Camp Wakpominee (H), Camp Little Notch (I), Pole Valley Players Club (J), Fort Ann Volunteer Fire Company (K), West Fort Ann Volunteer Fire Company (L). Display/hide their locations on the map
Churches in zip code 12827 include: West Fort Ann Methodist Church (A), United Protestant Church (B), Saint Ann's Catholic Church (C). Display/hide their locations on the map
Cemeteries: Sheldon Cemetery (1), Welch Hollow Cemetery (2), Orcutt Cemetery (3), Adamsville Cemetery (4), Fort Ann Village Cemetery (5), Brown Cemetery (6), Griswold Cemetery (7). Display/hide their locations on the map
Lakes, reservoirs, and swamps: Inman Pond (A), Lake Nebo (B), Lake Pond (C), Sly Pond (D), Spectacle Ponds (E), The Three Ponds (F), Thurber Pond (G), Vanderburg Pond (H). Display/hide their locations on the map
In group quarters: 2 (-1 institutionalized population)
Size of family households: 414 2-persons, 231 3-persons, 211 4-persons, 81 5-persons
Size of nonfamily households: 397 1-person, 162 2-persons
650 married couples with children.
53 single-parent households (36 men, 17 women).
99.4% of residents of 12827 zip code speak English at home.
0.7% of residents speak Spanish at home (21% well, 79% not well).
Foreign born population: 0 (0.0%) (0.0% of them are naturalized citizens)
:
0.0%
Whole state:
22.7%
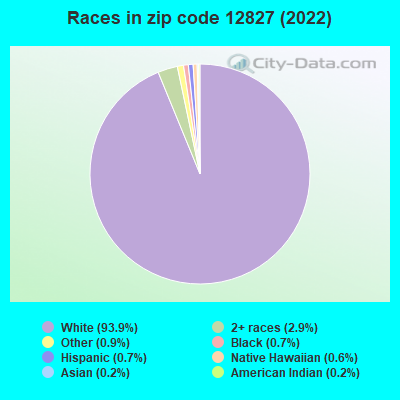
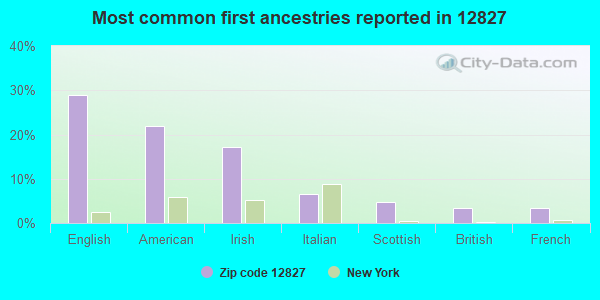
29%English
22%American
17%Irish
7%Italian
5%Scottish
3%British
3%French
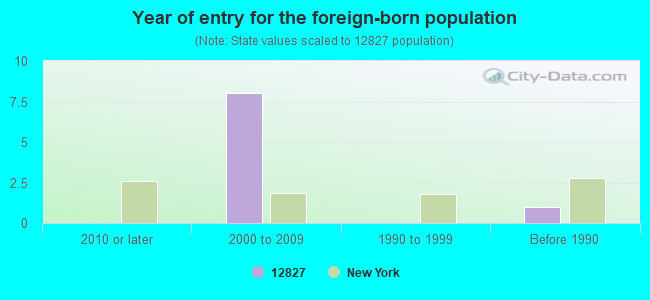
Year of entry for the foreign-born population
02010 or later
82000 to 2009
01990 to 1999
1Before 1990
Facilities with environmental interests located in this zip code:
HERITAGE HILL FARM (1582 MATTISON ROAD in FORT ANN, NY)
STATE MASTER (New York facility tracking) - National Pollutant Discharge Elimination System Permit National Pollutant Discharge Elimination System NON-MAJOR (Tracking pollutant discharge elimination systems) - permit Business SIC classification: GENERAL FARMS, PRIMARILY LIVESTOCK AND ANIMAL SPECIALTIES Organizations: ROBERT E. MATTISON & SONS (CONTACT/OWNER)
Alternative names: ROBERT E. MATTISON & SONS, ROBERT/SHANE/ROBLEE/TRAVIS MAT
CUMBERLAND FARMS #3143 (ANN & GEORGE STS in FORT ANN, NY)
(Resource Conservation and Recovery Act (tracking hazardous waste))
ASHLEY SUBSTATION (S BAY RD in FORT ANN, NY)
(Resource Conservation and Recovery Act (tracking hazardous waste))
HAVILAND MFG (9 GEORGE ST in FORT ANN, NY)
Small Quantity Generators, between 100 kg and 1000 kg of hazardous waste/month (Resource Conservation and Recovery Act (tracking hazardous waste)) - notification Organizations: EARL & DARLENE HAVILAND (CONTACT/OWNER)
COLLINS RESIDENCY - AR SANDRI INC (4457 RTE 4 in FORT ANN, NY)
Conditionally Exempt Small Quantity Generators, less than 100 kg/month of hazardous waste (Resource Conservation and Recovery Act (tracking hazardous waste)) - notification Organizations: JUANITA COLLINS (CONTACT/OWNER)
Housing units lacking complete plumbing facilities: 5.9% Housing units lacking complete kitchen facilities: 1.9%
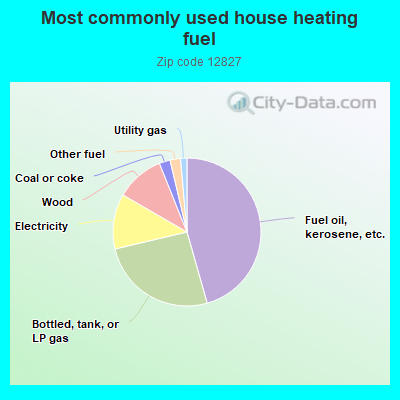
45.8%Fuel oil, kerosene, etc.
25.8%Bottled, tank, or LP gas
12.1%Electricity
10.6%Wood
2.4%Coal or coke
2.3%Other fuel
1.4%Utility gas
Population in 1990: 6,818.
Place of birth for U.S.-born residents:
This state: 3,010
Northeast: 418
Midwest: 5
South: 104
West: 52
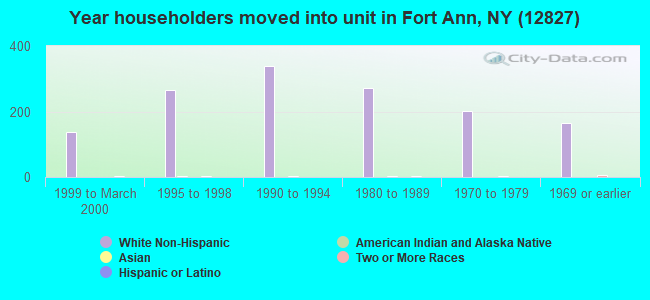
69% of the 12827 zip code residents lived in the same house 5 years ago. Out of people who lived in different houses, 57% lived in this county. Out of people who lived in different counties, 50% lived in New York.
94% of the 12827 zip code residents lived in the same house 1 year ago. Out of people who lived in different houses, 51% moved from this county. Out of people who lived in different houses, 28% moved from different county within same state. Out of people who lived in different houses, 20% moved from different state.
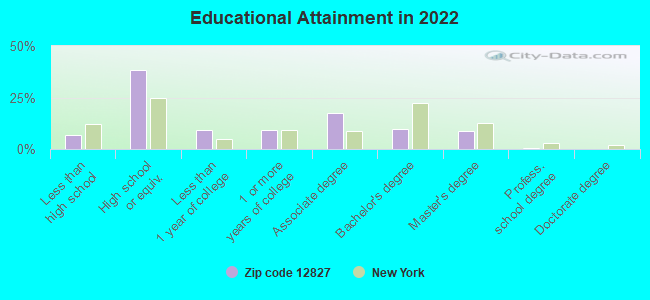
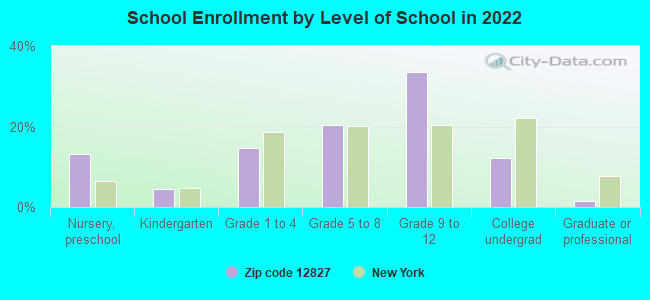
Private vs. public school enrollment:
Students in private schools in grades 1 to 8 (elementary and middle school): 34
Here:
16.0%
New York:
15.6%
Students in private schools in grades 9 to 12 (high school): 7
Here:
3.5%
New York:
15.0%
Students in private undergraduate colleges: 56
Here:
74.1%
New York:
39.2%
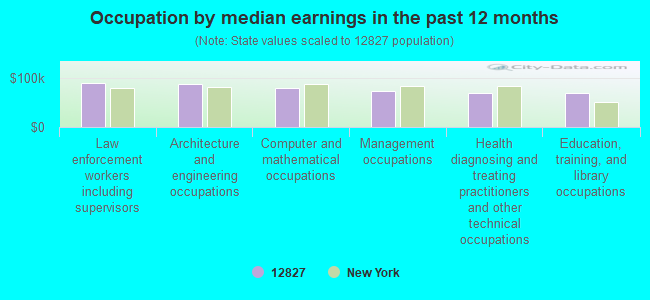
Occupation by median earnings in the past 12 months ($)
90,670Law enforcement workers including supervisors
89,519Architecture and engineering occupations
79,357Computer and mathematical occupations
73,759Management occupations
69,721Health diagnosing and treating practitioners and other technical occupations
69,271Education, training, and library occupations
Top industries in this zip code by the number of employees in 2005:
Health Care and Social Assistance: Residential Mental Retardation Facilities (20-49 employees: 1 establishment)
Construction: Site Preparation Contractors (10-19: 1, 1-4: 2)
Construction: New Single-Family Housing Construction (except Operative Builders) (5-9: 2, 1-4: 2)
Accommodation and Food Services: Full-Service Restaurants (5-9: 2)
People in group quarters in 2000:
8 people in homes for the mentally retarded
Fatal accident statistics in 2013:
Fatal accident count: 1
Vehicles involved in fatal accidents: 2
Fatal accidents caused by drunken drivers: 1
Fatalities: 1
Persons involved in fatal accidents: 2
Pedestrians involved in fatal accidents: 0
Fatal accident statistics in 2011:
Fatal accident count: 4
Vehicles involved in fatal accidents: 5
Fatal accidents caused by drunken drivers: 2
Fatalities: 4
Persons involved in fatal accidents: 6
Pedestrians involved in fatal accidents: 0
Home Mortgage Disclosure Act Aggregated Statistics For Year 2009 (Based on 6 partial tracts)
A) FHA, FSA/RHS & VA Home Purchase Loans
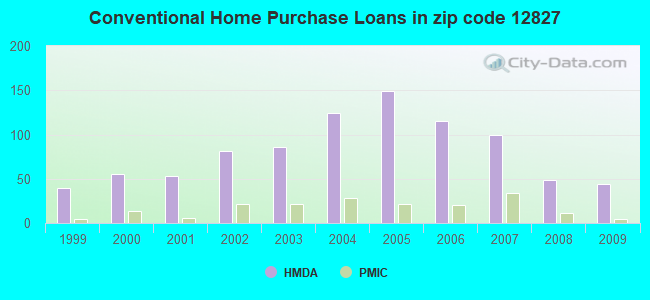
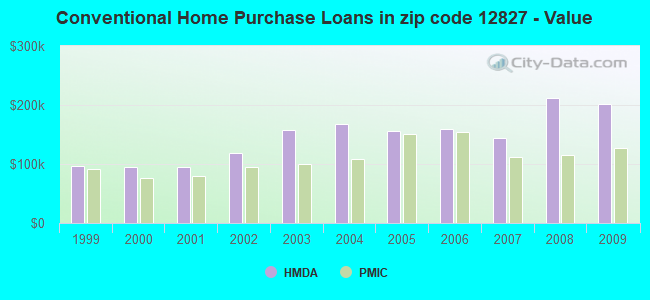
B) Conventional Home Purchase Loans
C) Refinancings
D) Home Improvement Loans
F) Non-occupant Loans on < 5 Family Dwellings (A B C & D)
G) Loans On Manufactured Home Dwelling (A B C & D)
Number
Average Value
Number
Average Value
Number
Average Value
Number
Average Value
Number
Average Value
Number
Average Value
LOANS ORIGINATED
38
$123,963
44
$201,786
146
$171,858
27
$72,459
25
$480,040
8
$82,538
APPLICATIONS APPROVED, NOT ACCEPTED
4
$92,748
7
$169,049
14
$126,876
3
$10,137
3
$385,213
4
$77,065
APPLICATIONS DENIED
7
$74,424
25
$75,410
103
$147,723
34
$17,479
9
$152,373
7
$95,449
APPLICATIONS WITHDRAWN
7
$90,909
9
$119,844
53
$235,470
6
$126,447
10
$589,028
4
$116,720
FILES CLOSED FOR INCOMPLETENESS
0
$0
0
$0
6
$132,267
0
$0
0
$0
0
$0
Aggregated Statistics For Year 2008 (Based on 6 partial tracts)
A) FHA, FSA/RHS & VA Home Purchase Loans
B) Conventional Home Purchase Loans
C) Refinancings
D) Home Improvement Loans
F) Non-occupant Loans on < 5 Family Dwellings (A B C & D)
G) Loans On Manufactured Home Dwelling (A B C & D)
Number
Average Value
Number
Average Value
Number
Average Value
Number
Average Value
Number
Average Value
Number
Average Value
LOANS ORIGINATED
25
$129,156
49
$212,705
134
$136,428
43
$46,805
18
$313,434
7
$110,701
APPLICATIONS APPROVED, NOT ACCEPTED
1
$184,030
15
$214,913
19
$145,487
3
$19,430
0
$0
4
$80,248
APPLICATIONS DENIED
2
$159,080
10
$127,622
128
$138,822
66
$57,161
7
$126,697
19
$84,709
APPLICATIONS WITHDRAWN
5
$84,376
6
$137,615
69
$137,003
15
$128,595
0
$0
7
$124,951
FILES CLOSED FOR INCOMPLETENESS
2
$167,000
0
$0
22
$177,153
4
$129,303
0
$0
0
$0
Aggregated Statistics For Year 2007 (Based on 6 partial tracts)
A) FHA, FSA/RHS & VA Home Purchase Loans
B) Conventional Home Purchase Loans
C) Refinancings
D) Home Improvement Loans
F) Non-occupant Loans on < 5 Family Dwellings (A B C & D)
G) Loans On Manufactured Home Dwelling (A B C & D)
Number
Average Value
Number
Average Value
Number
Average Value
Number
Average Value
Number
Average Value
Number
Average Value
LOANS ORIGINATED
18
$113,346
99
$144,074
165
$124,898
74
$34,602
30
$266,653
18
$83,233
APPLICATIONS APPROVED, NOT ACCEPTED
4
$126,975
18
$101,866
36
$236,801
17
$57,743
6
$263,503
5
$99,890
APPLICATIONS DENIED
2
$112,235
22
$103,217
189
$146,507
89
$50,776
18
$234,447
25
$67,864
APPLICATIONS WITHDRAWN
2
$157,370
15
$93,264
110
$125,989
11
$68,719
0
$0
5
$77,930
FILES CLOSED FOR INCOMPLETENESS
0
$0
5
$127,282
23
$191,126
2
$93,000
3
$332,887
2
$79,325
Aggregated Statistics For Year 2006 (Based on 6 partial tracts)
A) FHA, FSA/RHS & VA Home Purchase Loans
B) Conventional Home Purchase Loans
C) Refinancings
D) Home Improvement Loans
F) Non-occupant Loans on < 5 Family Dwellings (A B C & D)
G) Loans On Manufactured Home Dwelling (A B C & D)
Number
Average Value
Number
Average Value
Number
Average Value
Number
Average Value
Number
Average Value
Number
Average Value
LOANS ORIGINATED
17
$125,664
115
$159,302
208
$108,216
102
$45,928
26
$240,547
24
$82,780
APPLICATIONS APPROVED, NOT ACCEPTED
1
$137,050
23
$128,479
57
$137,377
15
$49,805
8
$201,238
8
$89,161
APPLICATIONS DENIED
2
$140,360
32
$89,578
219
$139,283
115
$32,517
11
$74,998
22
$75,579
APPLICATIONS WITHDRAWN
4
$103,225
19
$118,258
124
$99,681
22
$49,040
9
$121,146
5
$89,096
FILES CLOSED FOR INCOMPLETENESS
0
$0
8
$293,249
41
$167,327
5
$62,458
6
$426,078
0
$0
Aggregated Statistics For Year 2005 (Based on 6 partial tracts)
A) FHA, FSA/RHS & VA Home Purchase Loans
B) Conventional Home Purchase Loans
C) Refinancings
D) Home Improvement Loans
E) Loans on Dwellings For 5+ Families
F) Non-occupant Loans on < 5 Family Dwellings (A B C & D)
G) Loans On Manufactured Home Dwelling (A B C & D)
Number
Average Value
Number
Average Value
Number
Average Value
Number
Average Value
Number
Average Value
Number
Average Value
Number
Average Value
LOANS ORIGINATED
23
$106,863
149
$155,964
202
$108,004
77
$28,118
0
$0
19
$291,405
16
$71,591
APPLICATIONS APPROVED, NOT ACCEPTED
0
$0
20
$131,008
38
$159,366
6
$16,245
0
$0
0
$0
5
$77,856
APPLICATIONS DENIED
3
$142,910
51
$88,563
183
$124,483
88
$82,596
1
$70,630
11
$54,313
44
$70,866
APPLICATIONS WITHDRAWN
2
$98,530
19
$122,701
155
$129,307
20
$56,681
0
$0
5
$95,802
5
$49,494
FILES CLOSED FOR INCOMPLETENESS
0
$0
3
$83,127
21
$187,794
2
$47,595
0
$0
1
$100,060
0
$0
Aggregated Statistics For Year 2004 (Based on 6 partial tracts)
A) FHA, FSA/RHS & VA Home Purchase Loans
B) Conventional Home Purchase Loans
C) Refinancings
D) Home Improvement Loans
F) Non-occupant Loans on < 5 Family Dwellings (A B C & D)
G) Loans On Manufactured Home Dwelling (A B C & D)
Number
Average Value
Number
Average Value
Number
Average Value
Number
Average Value
Number
Average Value
Number
Average Value
LOANS ORIGINATED
27
$91,442
124
$168,129
205
$89,587
69
$24,964
31
$280,673
20
$61,854
APPLICATIONS APPROVED, NOT ACCEPTED
4
$70,338
10
$104,386
68
$94,360
12
$52,176
2
$213,885
6
$60,497
APPLICATIONS DENIED
1
$124,160
33
$74,860
195
$89,502
63
$22,969
8
$241,845
24
$45,949
APPLICATIONS WITHDRAWN
8
$89,081
15
$62,655
127
$87,169
9
$54,539
6
$67,983
9
$69,959
FILES CLOSED FOR INCOMPLETENESS
0
$0
11
$83,532
12
$87,257
2
$60,035
1
$42,380
0
$0
Aggregated Statistics For Year 2003 (Based on 6 partial tracts)
A) FHA, FSA/RHS & VA Home Purchase Loans
B) Conventional Home Purchase Loans
C) Refinancings
D) Home Improvement Loans
F) Non-occupant Loans on < 5 Family Dwellings (A B C & D)
Number
Average Value
Number
Average Value
Number
Average Value
Number
Average Value
Number
Average Value
LOANS ORIGINATED
24
$92,343
86
$157,171
323
$88,716
39
$20,422
42
$200,706
APPLICATIONS APPROVED, NOT ACCEPTED
2
$55,945
15
$114,161
67
$85,308
8
$32,132
4
$142,785
APPLICATIONS DENIED
0
$0
26
$68,507
191
$84,805
51
$27,623
4
$87,295
APPLICATIONS WITHDRAWN
1
$78,450
8
$68,516
93
$90,764
13
$32,951
0
$0
FILES CLOSED FOR INCOMPLETENESS
0
$0
0
$0
17
$75,313
4
$21,975
0
$0
Aggregated Statistics For Year 2002 (Based on 6 partial tracts)
A) FHA, FSA/RHS & VA Home Purchase Loans
B) Conventional Home Purchase Loans
C) Refinancings
D) Home Improvement Loans
E) Loans on Dwellings For 5+ Families
F) Non-occupant Loans on < 5 Family Dwellings (A B C & D)
Number
Average Value
Number
Average Value
Number
Average Value
Number
Average Value
Number
Average Value
Number
Average Value
LOANS ORIGINATED
23
$83,321
81
$119,474
158
$88,301
50
$14,145
0
$0
18
$211,087
APPLICATIONS APPROVED, NOT ACCEPTED
1
$25,900
13
$69,471
52
$85,355
7
$40,741
2
$53,440
0
$0
APPLICATIONS DENIED
3
$77,943
25
$135,786
144
$73,483
39
$20,507
0
$0
7
$107,834
APPLICATIONS WITHDRAWN
5
$69,296
7
$68,091
83
$72,513
13
$24,950
0
$0
5
$59,574
FILES CLOSED FOR INCOMPLETENESS
0
$0
0
$0
17
$64,568
0
$0
0
$0
0
$0
Aggregated Statistics For Year 2001 (Based on 6 partial tracts)
A) FHA, FSA/RHS & VA Home Purchase Loans
B) Conventional Home Purchase Loans
C) Refinancings
D) Home Improvement Loans
F) Non-occupant Loans on < 5 Family Dwellings (A B C & D)
Number
Average Value
Number
Average Value
Number
Average Value
Number
Average Value
Number
Average Value
LOANS ORIGINATED
31
$72,157
53
$94,564
169
$81,334
39
$12,947
9
$256,261
APPLICATIONS APPROVED, NOT ACCEPTED
3
$63,197
10
$66,350
46
$57,517
7
$28,957
5
$82,832
APPLICATIONS DENIED
0
$0
35
$45,561
133
$74,491
33
$16,003
2
$17,800
APPLICATIONS WITHDRAWN
0
$0
8
$72,815
77
$85,066
13
$12,904
2
$54,375
FILES CLOSED FOR INCOMPLETENESS
0
$0
2
$54,275
8
$85,774
0
$0
0
$0
Aggregated Statistics For Year 2000 (Based on 6 partial tracts)
A) FHA, FSA/RHS & VA Home Purchase Loans
B) Conventional Home Purchase Loans
C) Refinancings
D) Home Improvement Loans
E) Loans on Dwellings For 5+ Families
F) Non-occupant Loans on < 5 Family Dwellings (A B C & D)
Number
Average Value
Number
Average Value
Number
Average Value
Number
Average Value
Number
Average Value
Number
Average Value
LOANS ORIGINATED
30
$74,277
55
$94,908
69
$63,171
33
$18,078
0
$0
6
$81,662
APPLICATIONS APPROVED, NOT ACCEPTED
0
$0
20
$82,548
24
$56,750
9
$22,716
0
$0
1
$143,250
APPLICATIONS DENIED
4
$64,540
33
$66,143
116
$55,946
26
$31,929
2
$50,100
9
$122,336
APPLICATIONS WITHDRAWN
2
$79,325
8
$61,768
47
$60,905
3
$37,540
0
$0
2
$182,805
FILES CLOSED FOR INCOMPLETENESS
0
$0
1
$117,720
13
$59,859
0
$0
0
$0
0
$0
Aggregated Statistics For Year 1999 (Based on 3 partial tracts)
A) FHA, FSA/RHS & VA Home Purchase Loans
B) Conventional Home Purchase Loans
C) Refinancings
D) Home Improvement Loans
F) Non-occupant Loans on < 5 Family Dwellings (A B C & D)
2002 - 2018 National Fire Incident Reporting System (NFIRS) incidents
According to the data from the years 2002 - 2018 the average number of fire incidents per year is 9. The highest number of reported fires - 26 took place in 2002, and the least - 1 in 2006. The data has a decreasing trend.
When looking into fire subcategories, the most incidents belonged to: Structure Fires (61.6%), and Outside Fires (27.4%).
Fire incident types reported to NFIRS in Zip Code 12827


 Nearest zip codes: 12844, 12839, 12821, 12819, 12841, 12887.


 According to the data from the years 2002 - 2018 the average number of fire incidents per year is 9. The highest number of reported fires - 26 took place in 2002, and the least - 1 in 2006. The data has a decreasing trend.
 When looking into fire subcategories, the most incidents belonged to: Structure Fires (61.6%), and Outside Fires (27.4%).