Estimated zip code population in 2022: 389 Zip code population in 2010: 727 Zip code population in 2000: 1,049
Houses and condos: 208 Renter-occupied apartments: 13
% of renters here:
8%
State:
46%
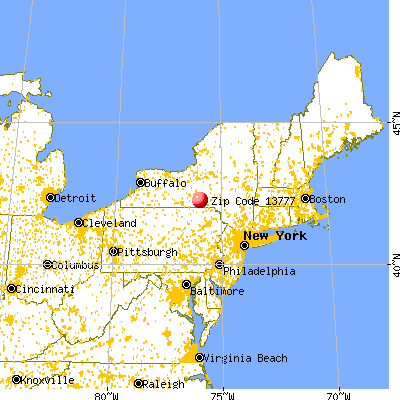
March 2022 cost of living index in zip code 13777: 93.7 (less than average, U.S. average is 100)
Land area: 6.0 sq. mi. Water area: 0.0 sq. mi.
Population density: 65 people per square mile
(very low).
OSM Map
General Map
Google Map
MSN Map
OSM Map
General Map
Google Map
MSN Map
OSM Map
General Map
Google Map
MSN Map
OSM Map
General Map
Google Map
MSN Map
Please wait while loading the map...
Real estate property taxes paid for housing units in 2022:
This zip code:
2.1% ($4,844)
New York:
1.5% ($6,180)
Median real estate property taxes paid for housing units with mortgages in 2022: $5,928 (2.1%) Median real estate property taxes paid for housing units with no mortgage in 2022: $3,239 (1.9%)
Business Search- 14 Million verified businesses
Males: 216
(55.6%)
Females: 173
(44.4%)
For population 25 years and over in 13777:
High school or higher: 93.4%
Bachelor's degree or higher: 18.9%
Graduate or professional degree: 12.3%
Unemployed: 4.1%
Mean travel time to work (commute): 19.3 minutes
For population 15 years and over in 13777:
Never married: 23.0%
Now married: 62.9%
Separated: 0.0%
Widowed: 7.3%
Divorced: 6.8%
Zip code 13777 compared to state average:
Median house value below state average.
Black race population percentage significantly below state average.
Hispanic race population percentage significantly below state average.
Median age significantly above state average.
Foreign-born population percentage significantly below state average.
Renting percentage significantly below state average.
Length of stay since moving in significantly above state average.
House age significantly below state average.
Percentage of population with a bachelor's degree or higher below state average.
Estimated median house/condo value in 2022: $234,548
13777:
$234,548
New York:
$400,400
Median resident age:
This zip code:
48.7 years
New York median age:
40.0 years
Average household size:
This zip code:
2.4 people
New York:
2.5 people
Averages for the 2020 tax year for zip code 13777, filed in 2021:
Average Adjusted Gross Income (AGI) in 2020: $49,330 (Individual Income Tax Returns)
Here:
$49,330
State:
$90,930
Salary/wage: $43,682 (reported on 85.0% of returns)
Here:
$43,682
State:
$72,104
(% of AGI for various income ranges: 1078.9% for AGIs below $25k, 3103.6% for AGIs $25k-50k, 5924.0% for AGIs $50k-75k, 7853.3% for AGIs $75k-100k, 17163.3% for AGIs $100k-200k)
Taxable interest for individuals: $215 (reported on 32.5% of returns)
This zip code:
$215
New York:
$3,075
(% of AGI for various income ranges: 5.5% for AGIs $25k-50k, 12.0% for AGIs $50k-75k, 53.3% for AGIs $100k-200k)
Ordinary dividends: $1,150 (reported on 15.0% of returns)
Here:
$1,150
State:
$11,095
(% of AGI for various income ranges: 40.0% for AGIs $25k-50k, 83.3% for AGIs $75k-100k)
Net capital gain/loss in AGI: +$1,200 (reported on 10.0% of returns)
Here:
+$1,200
State:
+$44,925
(% of AGI for various income ranges: 96.0% for AGIs $50k-75k)
Profit/loss from business: +$1,550 (reported on 5.0% of returns)
Here:
+$1,550
State:
+$14,940
(% of AGI for various income ranges: 34.4% for AGIs below $25k)
Taxable individual retirement arrangement distribution: $8,950 (reported on 5.0% of returns)
13777:
$8,950
New York:
$19,609
(% of AGI for various income ranges: 198.9% for AGIs below $25k)
Earned income credit: $2,229 (reported on 17.5% of returns)
Here:
$2,229
State:
$2,138
(% of AGI for various income ranges: 72.2% for AGIs below $25k, 82.7% for AGIs $25k-50k)
Percentage of individuals using paid preparers for their 2020 taxes: 97.5%
Here:
98%
State:
95%
(% for various income ranges: 100.0% for AGIs below $25k, 100.0% for AGIs $25k-50k, 85.7% for AGIs $50k-75k, 100.0% for AGIs $75k-100k, 100.0% for AGIs $100k-200k)
Averages for the 2012 tax year for zip code 13777, filed in 2013:
Average Adjusted Gross Income (AGI) in 2012: $38,264 (Individual Income Tax Returns)
Here:
$38,264
State:
$77,088
Salary/wage: $37,389 (reported on 81.8% of returns)
Here:
$37,389
State:
$60,593
(% of AGI for various income ranges: 72.7% for AGIs below $25k, 81.6% for AGIs $25k-50k, 85.7% for AGIs $50k-75k, 79.0% for AGIs $75k-100k, 79.2% for AGIs $100k-200k)
Taxable interest for individuals: $323 (reported on 29.5% of returns)
This zip code:
$323
New York:
$3,125
(% of AGI for various income ranges: 0.3% for AGIs below $25k, 0.4% for AGIs $25k-50k, 0.2% for AGIs $75k-100k, 0.3% for AGIs $100k-200k)
Ordinary dividends: $1,033 (reported on 13.6% of returns)
Here:
$1,033
State:
$10,299
(% of AGI for various income ranges: 0.6% for AGIs below $25k, 0.6% for AGIs $25k-50k, 0.7% for AGIs $75k-100k)
Profit/loss from business: +$2,580 (reported on 11.4% of returns)
Here:
+$2,580
State:
+$16,168
(% of AGI for various income ranges: 5.1% for AGIs below $25k)
Taxable individual retirement arrangement distribution: $7,700 (reported on 4.5% of returns)
13777:
$7,700
New York:
$17,621
Total itemized deductions: $17,589 (22% of AGI, reported on 20.5% of returns)
Here:
$17,589
State:
$34,985
Here:
22.4% of AGI
State:
21.3% of AGI
(% of AGI for various income ranges: 17.0% for AGIs $50k-75k, 12.5% for AGIs $75k-100k, 14.7% for AGIs $100k-200k)
Charity contributions: $2,040 (reported on 11.4% of returns)
Here:
$2,040
State:
$5,572
(% of AGI for various income ranges: 0.9% for AGIs $25k-50k, 1.8% for AGIs $75k-100k)
Taxes paid: $7,244 (reported on 20.5% of returns)
13777:
$7,244
State:
$18,656
(% of AGI for various income ranges: 6.1% for AGIs $50k-75k, 5.4% for AGIs $75k-100k, 6.6% for AGIs $100k-200k)
Earned income credit: $2,310 (reported on 22.7% of returns)
Here:
$2,310
State:
$2,230
(% of AGI for various income ranges: 7.3% for AGIs below $25k, 1.2% for AGIs $25k-50k)
Percentage of individuals using paid preparers for their 2012 taxes: 54.5%
Here:
55%
State:
66%
(% for various income ranges: 55.0% for AGIs below $25k, 50.0% for AGIs $25k-50k, 50.0% for AGIs $50k-75k, 100.0% for AGIs $75k-100k)
Averages for the 2004 tax year for zip code 13777, filed in 2005:
Average Adjusted Gross Income (AGI) in 2004: $35,090 (Individual Income Tax Returns)
Here:
$35,090
State:
$59,519
Salary/wage: $32,306 (reported on 90.3% of returns)
Here:
$32,306
State:
$50,673
(% of AGI for various income ranges: 86.4% for AGIs below $10k, 83.5% for AGIs $10k-25k, 83.2% for AGIs $25k-50k, 88.8% for AGIs $50k-75k, 77.4% for AGIs $75k-100k)
Taxable interest for individuals: $404 (reported on 44.3% of returns)
This zip code:
$404
New York:
$2,377
(% of AGI for various income ranges: 1.4% for AGIs below $10k, 1.2% for AGIs $10k-25k, 0.6% for AGIs $25k-50k, 0.1% for AGIs $50k-75k, 0.3% for AGIs $75k-100k)
Taxable dividends: $575 (reported on 19.4% of returns)
Here:
$575
State:
$5,394
(% of AGI for various income ranges: 0.4% for AGIs $10k-25k, 0.7% for AGIs $25k-50k, 0.1% for AGIs $50k-75k, 0.1% for AGIs $75k-100k)
Net capital gain/loss: +$1,700 (reported on 9.7% of returns)
Here:
+$1,700
State:
+$23,581
Profit/loss from business: +$1,865 (reported on 9.0% of returns)
Here:
+$1,865
State:
+$13,809
Total itemized deductions: $14,588 (23% of AGI, reported on 20.6% of returns)
Here:
$14,588
State:
$25,864
Here:
23.3% of AGI
State:
21.9% of AGI
(% of AGI for various income ranges: 7.4% for AGIs $10k-25k, 6.5% for AGIs $25k-50k, 9.7% for AGIs $50k-75k, 10.8% for AGIs $75k-100k)
Charity contributions deductions: $1,273 (2% of AGI, reported on 16.0% of returns)
Here:
$1,273
State:
$4,439
Here:
2.1% of AGI
State:
3.6% of AGI
Total tax: $3,544 (reported on 72.2% of returns)
13777:
$3,544
State:
$11,730
(% of AGI for various income ranges: 0.7% for AGIs below $10k, 3.4% for AGIs $10k-25k, 6.4% for AGIs $25k-50k, 7.9% for AGIs $50k-75k, 10.0% for AGIs $75k-100k)
Earned income credit: $2,083 (reported on 17.4% of returns)
Here:
$2,083
State:
$1,757
Percentage of individuals using paid preparers for their 2004 taxes: 56.2%
Here:
56%
State:
67%
(% for various income ranges: 34.3% for AGIs below $10k, 57.6% for AGIs $10k-25k, 64.4% for AGIs $25k-50k, 65.0% for AGIs $50k-75k, 51.2% for AGIs $75k-100k)
Size of family households: 77 2-persons, 9 3-persons, 36 4-persons, 16 7-or-more-persons
Size of nonfamily households: 18 1-person
81 married couples with children.
0 single-parent households ().
99.0% of residents of 13777 zip code speak English at home.
1.3% of residents speak other Indo-European language at home (100% very well).
Foreign born population: 6 (1.6%) (100.0% of them are naturalized citizens)
This zip code:
1.6%
Whole state:
22.7%
27%German
13%Czech
10%American
7%Irish
7%Polish
6%English
5%Scottish
Year of entry for the foreign-born population
02010 or later
02000 to 2009
01990 to 1999
8Before 1990
52.7%Fuel oil, kerosene, etc.
14.3%Bottled, tank, or LP gas
13.7%Other fuel
8.5%Wood
7.8%Electricity
4.6%Coal or coke
Population in 1990: 1,380.
Place of birth for U.S.-born residents:
This state: 360
Northeast: 13
Midwest: 5
67% of the 13777 zip code residents lived in the same house 5 years ago. Out of people who lived in different houses, 67% lived in this county. Out of people who lived in different counties, 50% lived in New York.
98% of the 13777 zip code residents lived in the same house 1 year ago. Out of people who lived in different houses, 67% moved from this county.
Private vs. public school enrollment:
Students in private schools in grades 1 to 8 (elementary and middle school):
Here:
0.0%
New York:
15.6%
Students in private schools in grades 9 to 12 (high school):
Here:
0.0%
New York:
15.0%
Students in private undergraduate colleges: 12
Here:
100.0%
New York:
39.2%
Occupation by median earnings in the past 12 months ($)
128,028Management occupations
54,354Production occupations
43,971Construction and extraction occupations
35,880Office and administrative support occupations
31,073Healthcare support occupations
2,825Transportation occupations
Top industries in this zip code by the number of employees in 2005:
Construction: Other Building Equipment Contractors (1-4 employees: 1 establishment)
Construction: Residential Remodelers (1-4: 1)
Other Services (except Public Administration): General Automotive Repair (1-4: 1)
Other Services (except Public Administration): Labor Unions and Similar Labor Organizations (1-4: 1)
Fatal accident statistics in 2013:
Fatal accident count: 1
Vehicles involved in fatal accidents: 2
Fatal accidents caused by drunken drivers: 0
Fatalities: 2
Persons involved in fatal accidents: 3
Pedestrians involved in fatal accidents: 0
Home Mortgage Disclosure Act Aggregated Statistics For Year 2009 (Based on 2 partial tracts)
A) FHA, FSA/RHS & VA Home Purchase Loans
B) Conventional Home Purchase Loans
C) Refinancings
D) Home Improvement Loans
G) Loans On Manufactured Home Dwelling (A B C & D)
Number
Average Value
Number
Average Value
Number
Average Value
Number
Average Value
Number
Average Value
LOANS ORIGINATED
1
$123,850
1
$190,100
4
$94,288
1
$53,300
1
$87,050
APPLICATIONS APPROVED, NOT ACCEPTED
0
$0
0
$0
0
$0
0
$0
0
$0
APPLICATIONS DENIED
0
$0
1
$42,130
1
$130,710
1
$25,890
0
$0
APPLICATIONS WITHDRAWN
0
$0
0
$0
1
$138,570
1
$52,280
0
$0
FILES CLOSED FOR INCOMPLETENESS
0
$0
0
$0
0
$0
0
$0
0
$0
Aggregated Statistics For Year 2008 (Based on 2 partial tracts)
A) FHA, FSA/RHS & VA Home Purchase Loans
B) Conventional Home Purchase Loans
C) Refinancings
D) Home Improvement Loans
F) Non-occupant Loans on < 5 Family Dwellings (A B C & D)
G) Loans On Manufactured Home Dwelling (A B C & D)
Number
Average Value
Number
Average Value
Number
Average Value
Number
Average Value
Number
Average Value
Number
Average Value
LOANS ORIGINATED
1
$93,910
4
$105,200
2
$67,005
2
$24,870
0
$0
2
$65,480
APPLICATIONS APPROVED, NOT ACCEPTED
1
$37,820
0
$0
1
$91,370
0
$0
0
$0
1
$37,820
APPLICATIONS DENIED
0
$0
2
$190,350
1
$37,820
2
$46,190
1
$90,100
2
$55,455
APPLICATIONS WITHDRAWN
0
$0
0
$0
0
$0
1
$28,930
0
$0
0
$0
FILES CLOSED FOR INCOMPLETENESS
0
$0
0
$0
0
$0
0
$0
0
$0
0
$0
Aggregated Statistics For Year 2007 (Based on 2 partial tracts)
A) FHA, FSA/RHS & VA Home Purchase Loans
B) Conventional Home Purchase Loans
C) Refinancings
D) Home Improvement Loans
G) Loans On Manufactured Home Dwelling (A B C & D)
Number
Average Value
Number
Average Value
Number
Average Value
Number
Average Value
Number
Average Value
LOANS ORIGINATED
1
$55,330
2
$69,035
4
$73,030
2
$18,275
1
$74,870
APPLICATIONS APPROVED, NOT ACCEPTED
0
$0
0
$0
1
$114,210
0
$0
1
$26,140
APPLICATIONS DENIED
0
$0
1
$98,220
3
$70,640
2
$31,850
1
$66,240
APPLICATIONS WITHDRAWN
0
$0
0
$0
1
$75,380
1
$32,490
0
$0
FILES CLOSED FOR INCOMPLETENESS
0
$0
0
$0
0
$0
1
$31,720
0
$0
Aggregated Statistics For Year 2006 (Based on 2 partial tracts)
B) Conventional Home Purchase Loans
C) Refinancings
D) Home Improvement Loans
F) Non-occupant Loans on < 5 Family Dwellings (A B C & D)
G) Loans On Manufactured Home Dwelling (A B C & D)
Number
Average Value
Number
Average Value
Number
Average Value
Number
Average Value
Number
Average Value
LOANS ORIGINATED
4
$106,850
5
$81,420
4
$14,530
1
$41,370
2
$50,000
APPLICATIONS APPROVED, NOT ACCEPTED
1
$52,790
1
$87,810
0
$0
0
$0
0
$0
APPLICATIONS DENIED
2
$51,395
4
$62,562
3
$15,820
2
$62,560
1
$42,380
APPLICATIONS WITHDRAWN
0
$0
3
$71,657
1
$10,150
0
$0
0
$0
FILES CLOSED FOR INCOMPLETENESS
0
$0
0
$0
0
$0
0
$0
0
$0
Aggregated Statistics For Year 2005 (Based on 2 partial tracts)
A) FHA, FSA/RHS & VA Home Purchase Loans
B) Conventional Home Purchase Loans
C) Refinancings
D) Home Improvement Loans
G) Loans On Manufactured Home Dwelling (A B C & D)
Number
Average Value
Number
Average Value
Number
Average Value
Number
Average Value
Number
Average Value
LOANS ORIGINATED
1
$53,810
2
$55,580
5
$79,642
3
$18,780
2
$40,610
APPLICATIONS APPROVED, NOT ACCEPTED
0
$0
1
$120,300
1
$133,750
1
$9,140
1
$44,670
APPLICATIONS DENIED
0
$0
2
$101,265
2
$94,540
1
$39,090
1
$107,860
APPLICATIONS WITHDRAWN
0
$0
0
$0
3
$81,470
0
$0
1
$66,500
FILES CLOSED FOR INCOMPLETENESS
0
$0
0
$0
2
$81,975
0
$0
0
$0
Aggregated Statistics For Year 2004 (Based on 2 partial tracts)
A) FHA, FSA/RHS & VA Home Purchase Loans
B) Conventional Home Purchase Loans
C) Refinancings
D) Home Improvement Loans
Number
Average Value
Number
Average Value
Number
Average Value
Number
Average Value
LOANS ORIGINATED
1
$58,880
3
$92,467
4
$57,930
2
$55,330
APPLICATIONS APPROVED, NOT ACCEPTED
0
$0
0
$0
0
$0
0
$0
APPLICATIONS DENIED
0
$0
0
$0
4
$64,720
1
$4,570
APPLICATIONS WITHDRAWN
0
$0
0
$0
2
$107,610
0
$0
FILES CLOSED FOR INCOMPLETENESS
0
$0
1
$44,410
1
$94,920
0
$0
Aggregated Statistics For Year 2003 (Based on 2 partial tracts)
A) FHA, FSA/RHS & VA Home Purchase Loans
B) Conventional Home Purchase Loans
C) Refinancings
D) Home Improvement Loans
F) Non-occupant Loans on < 5 Family Dwellings (A B C & D)
Number
Average Value
Number
Average Value
Number
Average Value
Number
Average Value
Number
Average Value
LOANS ORIGINATED
1
$42,640
2
$81,595
9
$78,199
2
$6,345
1
$36,040
APPLICATIONS APPROVED, NOT ACCEPTED
1
$22,330
0
$0
1
$46,700
0
$0
0
$0
APPLICATIONS DENIED
0
$0
2
$40,990
4
$62,625
1
$14,210
0
$0
APPLICATIONS WITHDRAWN
0
$0
0
$0
3
$81,217
0
$0
0
$0
FILES CLOSED FOR INCOMPLETENESS
0
$0
0
$0
0
$0
0
$0
0
$0
Aggregated Statistics For Year 1999 (Based on 1 partial tract)


 Nearest zip codes: 13802, 13744, 13797, 13862, 13790, 13905.


